

asbe/iStock via Getty Images
Thesis
We follow up on another sector in the second part of our “un-loved” sectors series that we believe is on the verge of a significant long-term reversal from its underperformance in 2022. We discussed the Tech ETF (XLK) in the first part of our series.
In this article, we discuss why we believe the Consumer Discretionary ETF (NYSEARCA:XLY) should be on your watchlist after significantly underperforming the market in 2022.
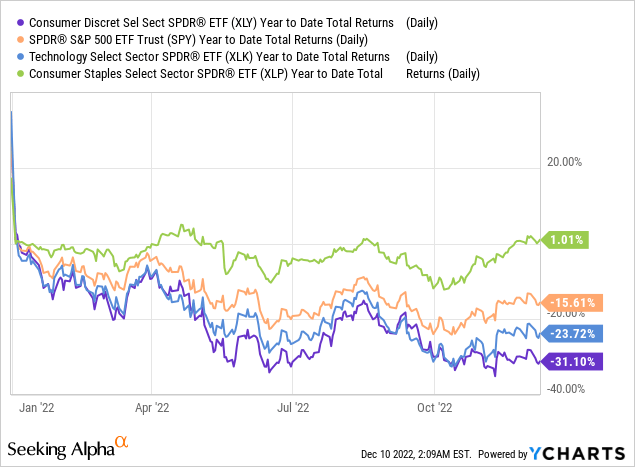
As seen above, the XLY posted a YTD total return of more than -30%, underperforming the S&P 500’s (SPX) (SP500) (SPY) -15.6%. It also underperformed the Consumer Staples ETF’s (XLP) 1% YTD total return as investors rotated out of XLY’s constituents, given the bear market.
As a result, the Fed’s record rate hikes have dealt a hammering to XLY investors in its attempt to combat elevated inflation rates expeditiously.
Despite that, we urge investors to consider whether the XLY is close to bottoming, as we gleaned that it has consistently outperformed the XLP out of every bear market.
With market strategists and company analysts turning increasingly pessimistic on 2023’s projections, we believe it has set up XLY constructively into the new year. Note that we also consider the XLY/XLP a leading indicator of the next potential bull market, given its success of bottoming ahead of the SPX dating back to the 2007/08 Great Financial Crisis.
As such, we urge investors to remain calm, assess the damage already inflicted in the XLY, and consider whether they have a high conviction in its long-term recovery.
Maintain Buy.
XLY: Median P/E Close To COVID Lows
With the XLY suffering from the effects of the housing downturn, retail stocks’ collapse, and e-commerce fallout, it was one of the worst performers in the S&P 500 YTD.
Accordingly, the XLY’s 10Y total return CAGR of 12.8% is in line with the SPX’s 12.8% 10Y average. Hence, XLY’s YTD dislocation against the SPX could offer high-conviction investors a fantastic opportunity to add exposure while the market is still highly pessimistic.
But do we see buyers supporting the XLY against its more defensive Consumer Staple (XLP) peers?
XLY/XLP price chart (monthly) (TradingView)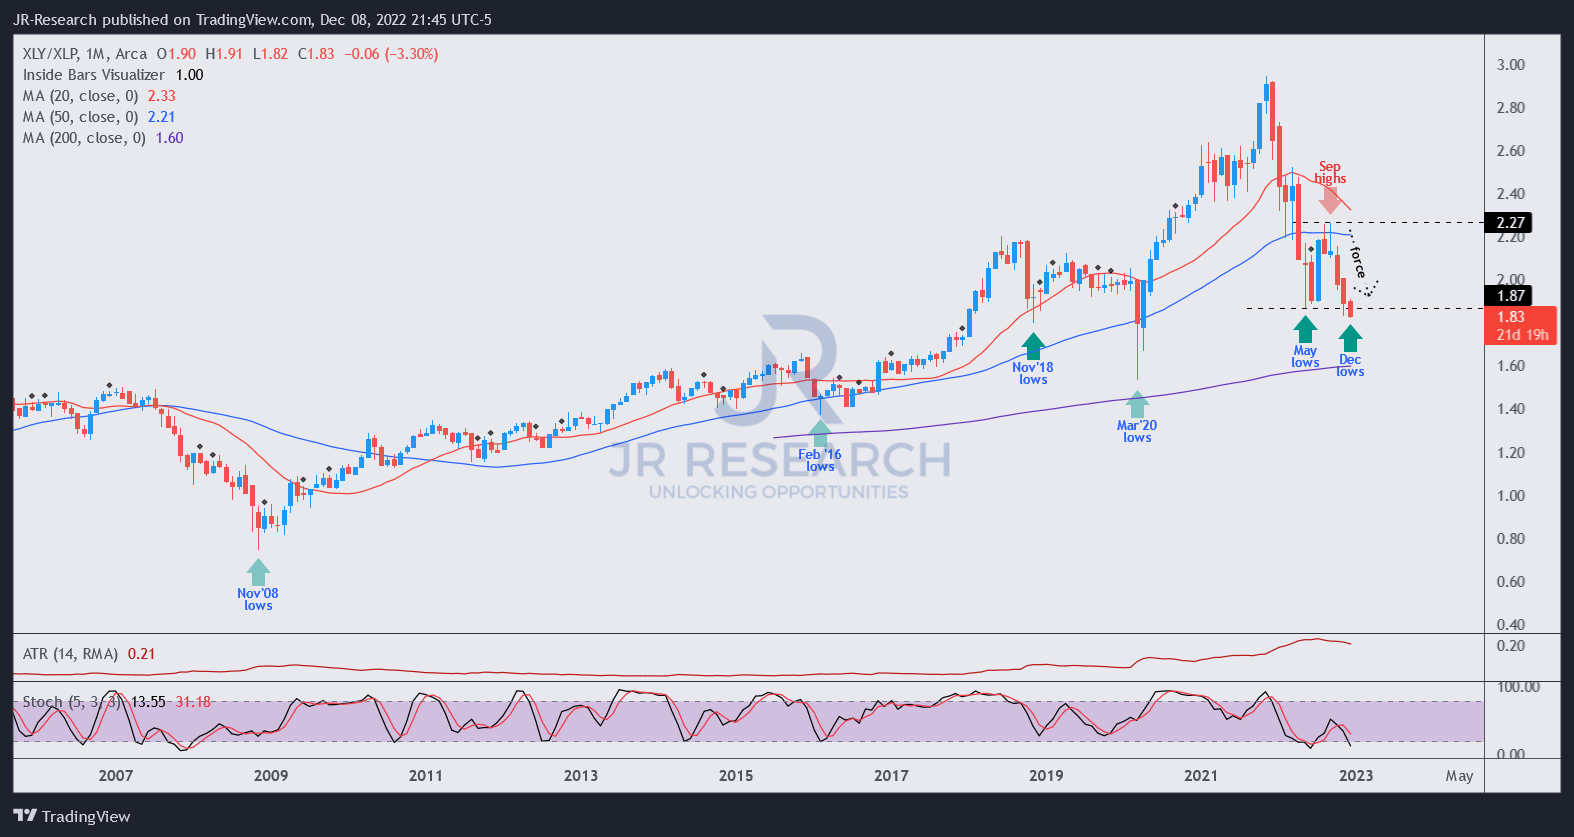
As seen above, the XLY has consistently outperformed its XLP peers out of previous bear market/deep market pullbacks since the Great Financial Crisis. Notably, as seen in the XLY/XLP’s long-term chart, it bottomed in November 2008, well before the market bottom in spring 2009.
Despite the battering from its unsustainable highs in 2021, XLY is still the fourth largest sector in the S&P 500, with a weighting of more than 10%. Hence, we believe a recovery in the XLY is instrumental in driving the SPX’s medium-term recovery. As such, investors should assess the bottoming process of the XLY/XLP’s price action to discern early clues.
While we have yet to glean a validated bullish reversal process for the XLY/XLP, we believe the recent steep selloff from its September highs is constructive as it took out its May lows.
In addition, the capitulation move sent the XLY/XLP into oversold zones, with price action similar to bear trap moves we gleaned previously. Hence, we are constructive on the capitulation move, as the market seeks to force out weak holders at its lows before potentially staging a bullish reversal.
But does its valuation support such a move? Yes, it does.
Data suggests that the XLY’s TTM median P/E has already fallen to lows last seen at the COVID bottom. Accordingly, the XLY last traded at a median P/E of 11.8x, slightly ahead of its COVID lows of 10.9x (median). It’s also well below its 2021 highs of 21.7x (median), suggesting significant damage has likely been inflicted.
Hence, we believe XLY’s valuation and price action are constructive for a subsequent bullish reversal. But, again, if you wait till the XLY/XLP potentially retakes its 50-month moving average (blue line), the reward/risk will be much less attractive.
Is XLY ETF A Buy, Sell Or Hold?
Maintain Buy.
Market strategists and company analysts have turned the most pessimistic that we observed over the last two decades. Such extreme pessimism has augured well for the market’s forward return when taken to an extreme.
Therefore, we urge investors to watch the XLY/XLP’s price action carefully, as it could lead the SPX into its next potential bull run moving ahead.
Be the first to comment