

Sviatlana Zyhmantovich
Thesis
Both the Columbia Seligman Premium Technology Growth Fund (NYSE:STK) and Global X NASDAQ 100 Covered Call ETF (NASDAQ:QYLD) are popular covered-call funds. To add to their similarity, both of their call options are also based on the same NASDAQ 100 Index. QYLD showed up on our radar recently because its yields have surged to 15%+, near its own peak level since 2014, and also more than 2x higher than STK’s 7.31% as shown in the chart below. QYLD’s current yield of 15.3% is almost 30% (27.3% to be exact) above its 4-year historical average of 12.09%. While in contrast, STK’s yield of 7.31% is almost 30% BELOW its historical average.
Such a large divergence between two seemingly similar funds certainly got our attention and motivated me to dig deeper. And in the remainder of this article, I will examine both funds more closely. And you will see why my final conclusion is that l like QYLD better, mostly due to the following consideration:
- QYLD’s dividends provide much higher current income on a monthly basis (and STK’s dividends are on a quarterly basis).
- QYLD’s yield spread above risk-free rates is also much thicker than STK’s. And historically, a thicker yield spread has positively correlated to total return potential in the near term (say about 1 or 2 years).
Source: Author based on Seeking Alpha data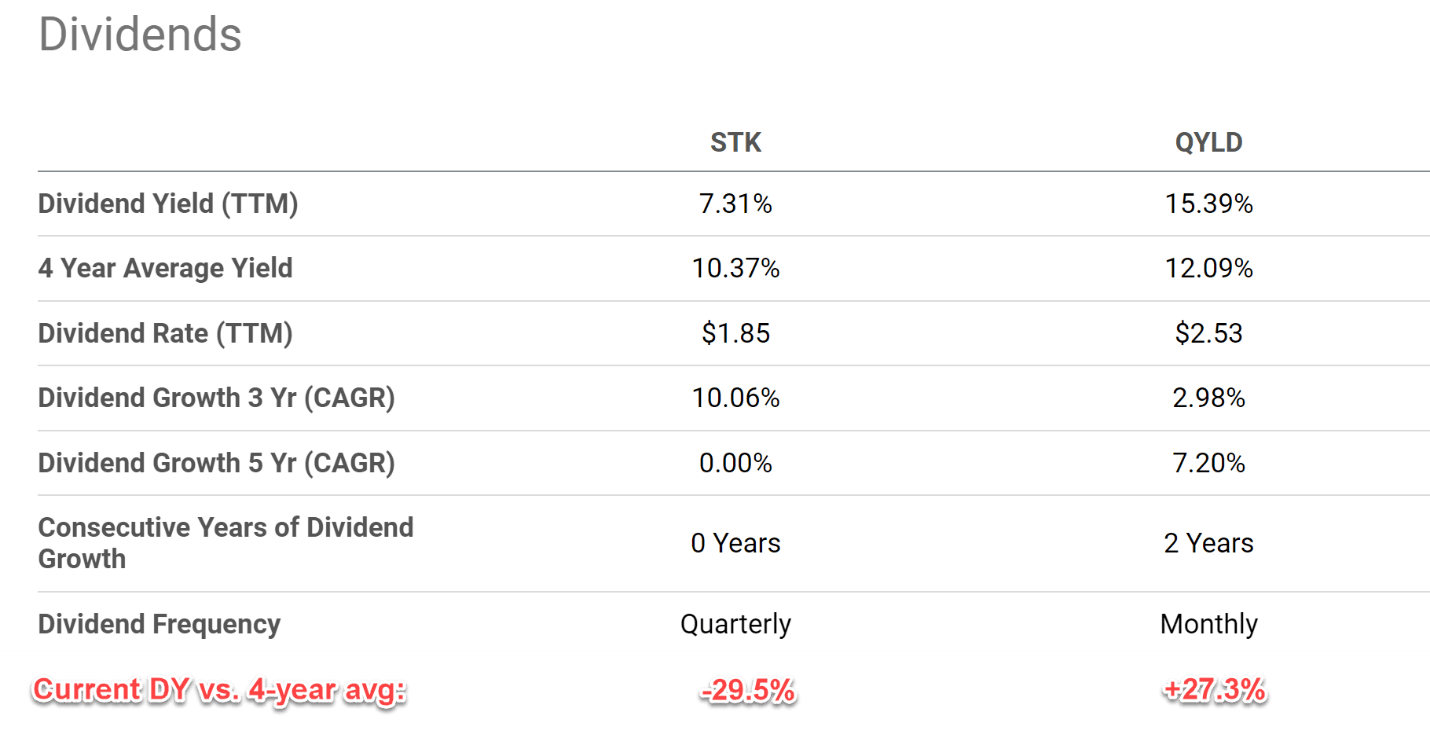
STK and QYLD: Basic information
As aforementioned, both are popular covered-call funds based on the same underlying NASDAQ 100 Index. Detailed strategies for both funds are quoted below from their fund descriptions (slightly edited with emphases added by me).
QYLD fund description: QYLD seeks to generate income through covered call writing, which historically produces higher yields in periods of volatility. QYLD writes call options on the Nasdaq-100 Index, saving investors the time and potential expense of doing so individually. QYLD has made monthly distributions 8 years running.
STK fund description: Under normal market conditions, the Funds investment program will consist primarily of (1) investing in a portfolio of equity securities of technology and technology-related companies that seeks to exceed the total return, before fees and expenses, of the S&P North America Technology Sector Index and (2) writing call options on the NASDAQ 100 Index… with an aggregate notional amount typically ranging from 25% to 90% of the underlying value of the Fund’s holdings of common stock.
Due to their similar strategies, their holdings are quite similar and many of them overlap as you can see from their top 10 holdings below. Both funds hold stocks like Apple (AAPL), Microsoft (MSFT), Google (GOOG) (GOOGL), Broadcom (AVGO). Although note that STK writes call options on 25% to 90% of its underlying value, a level that is lower than QYLD’s typical level. And we will revisit the implications of this key difference as we go.
Source: STK and QYLD fund descriptions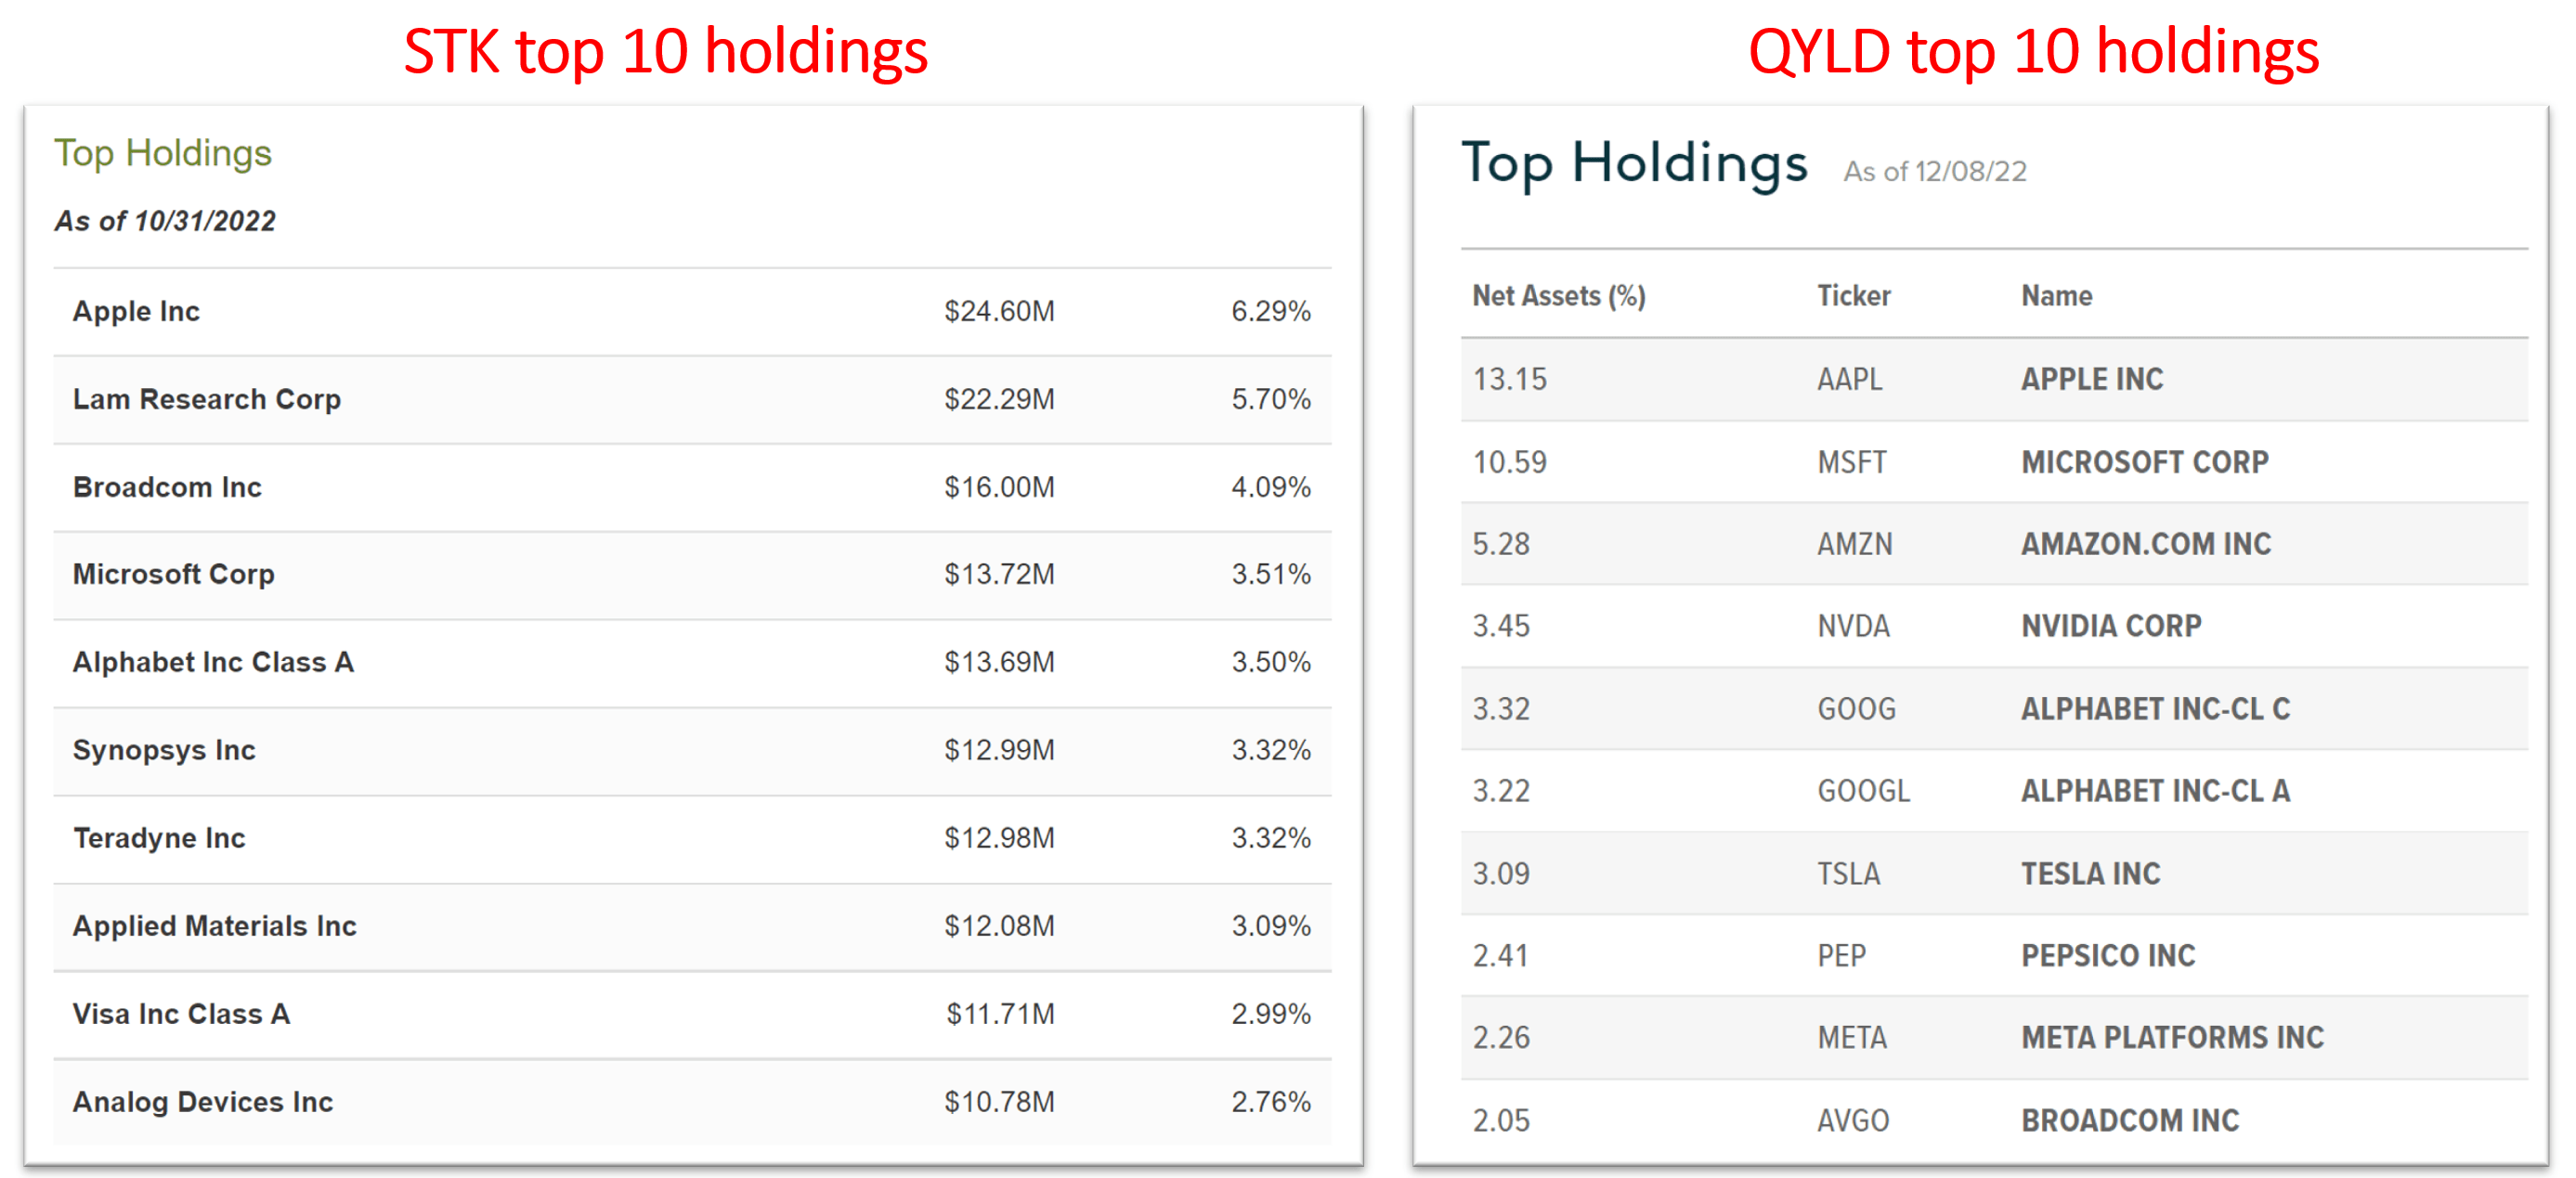
STK and QYLD: a closer look at the yields
The chart below shows the yield history for STK and QYLD over the past decade. As seen, STK’s dividend yield (the blue line) has fluctuated in a range between 10% and 15% most of the time historically. And QYLD’s yield (the orange line) has also fluctuated in a similar range after its yield stabilized quickly in 2014. As aforementioned, compared to its 4-year average of around 12.09%, QYLD’s current yield of 15.4% is almost 30% higher in relative terms.
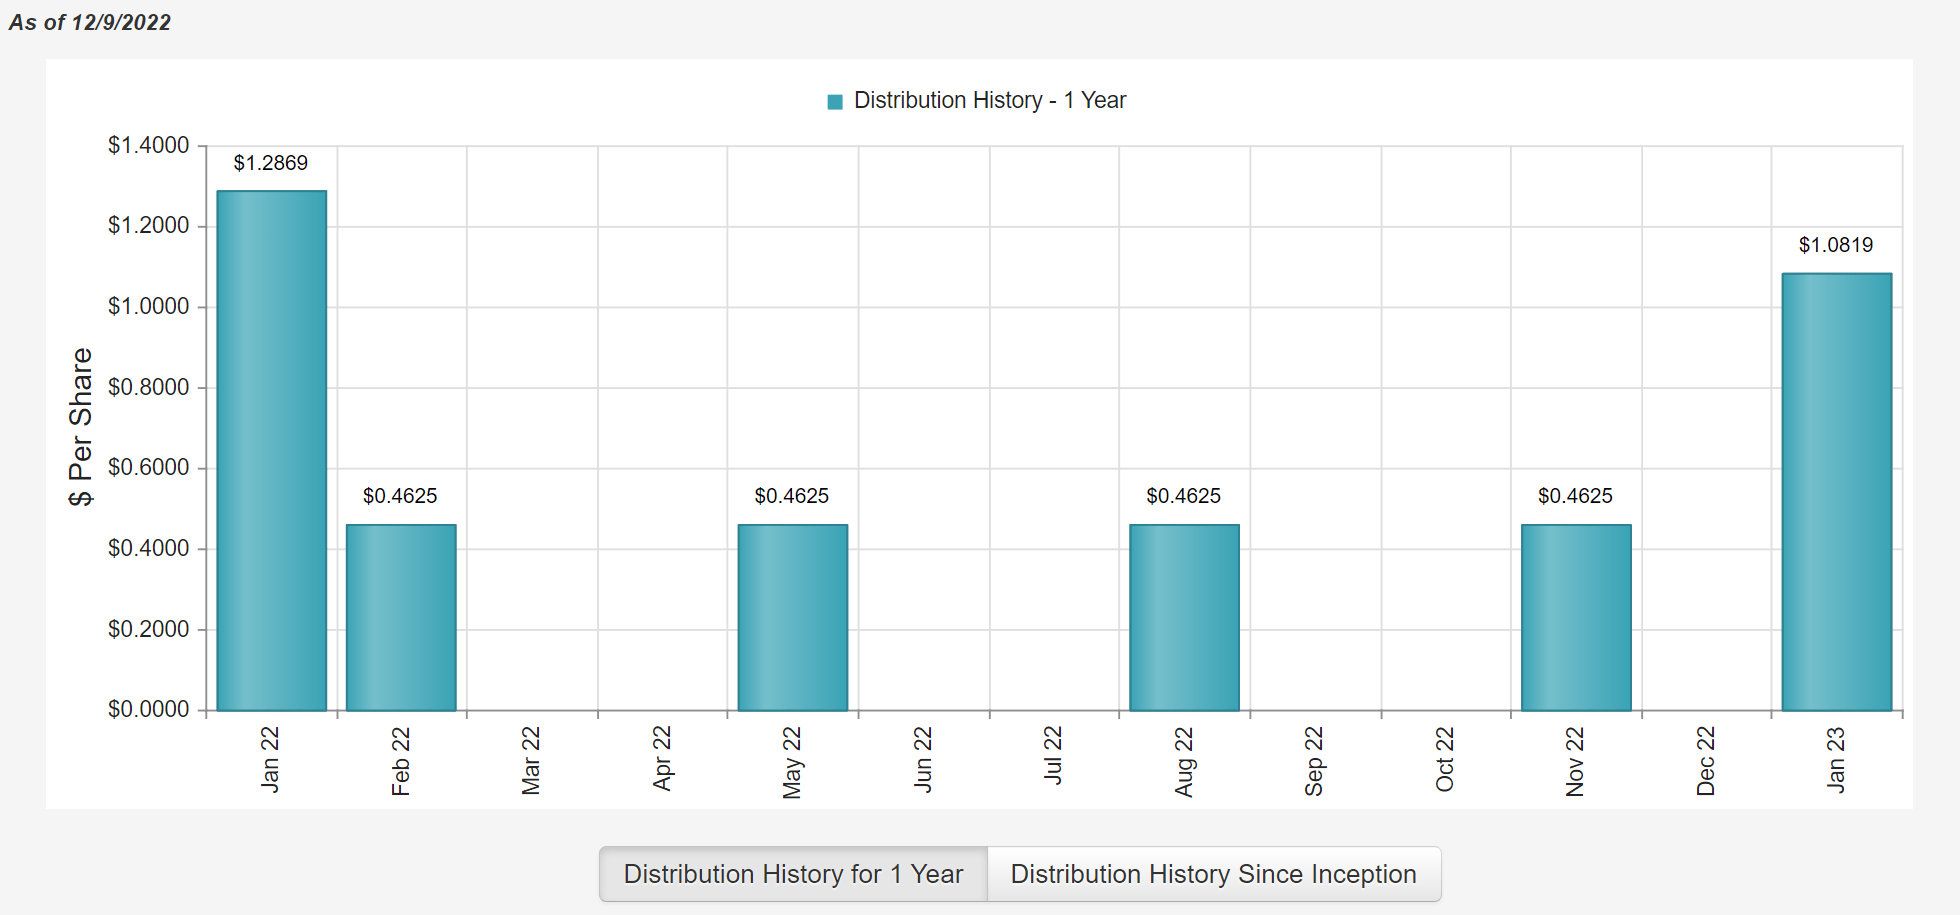
In the case of STK, you might have noted the discrepancy between the yields quoted in the first table and in the following chart. If you recall, the first table showed its TTM dividend yield to be 7.31% while the following chart shows 11.59%. Note that STK paid dividends 5 times (not 4 times) in the past 12 months as shown in the second chart below. And the “extra” payment of $1.28 in Jan 2022 is the cause of the discrepancy here. In any case, STK has announced a dividend of $1.08 for Jan 2023. And as a result, its forward annual dividend would be $2.47 per share, translating into an annual yield of 9.75% at the price as of this writing ($23.5). It is higher than the 7.31% quoted in the first section, but still below its 4-year average of 10.37% and also far below QYLD’s 15.3%.
Finally, note that both STK and QYLD have been generating yields that are far above the treasury rates (approximated by the IEF fund). And we will explore their spread relative to the risk-free interest rates next.
Source: Author based on Seeking Alpha data Source: CEF connect.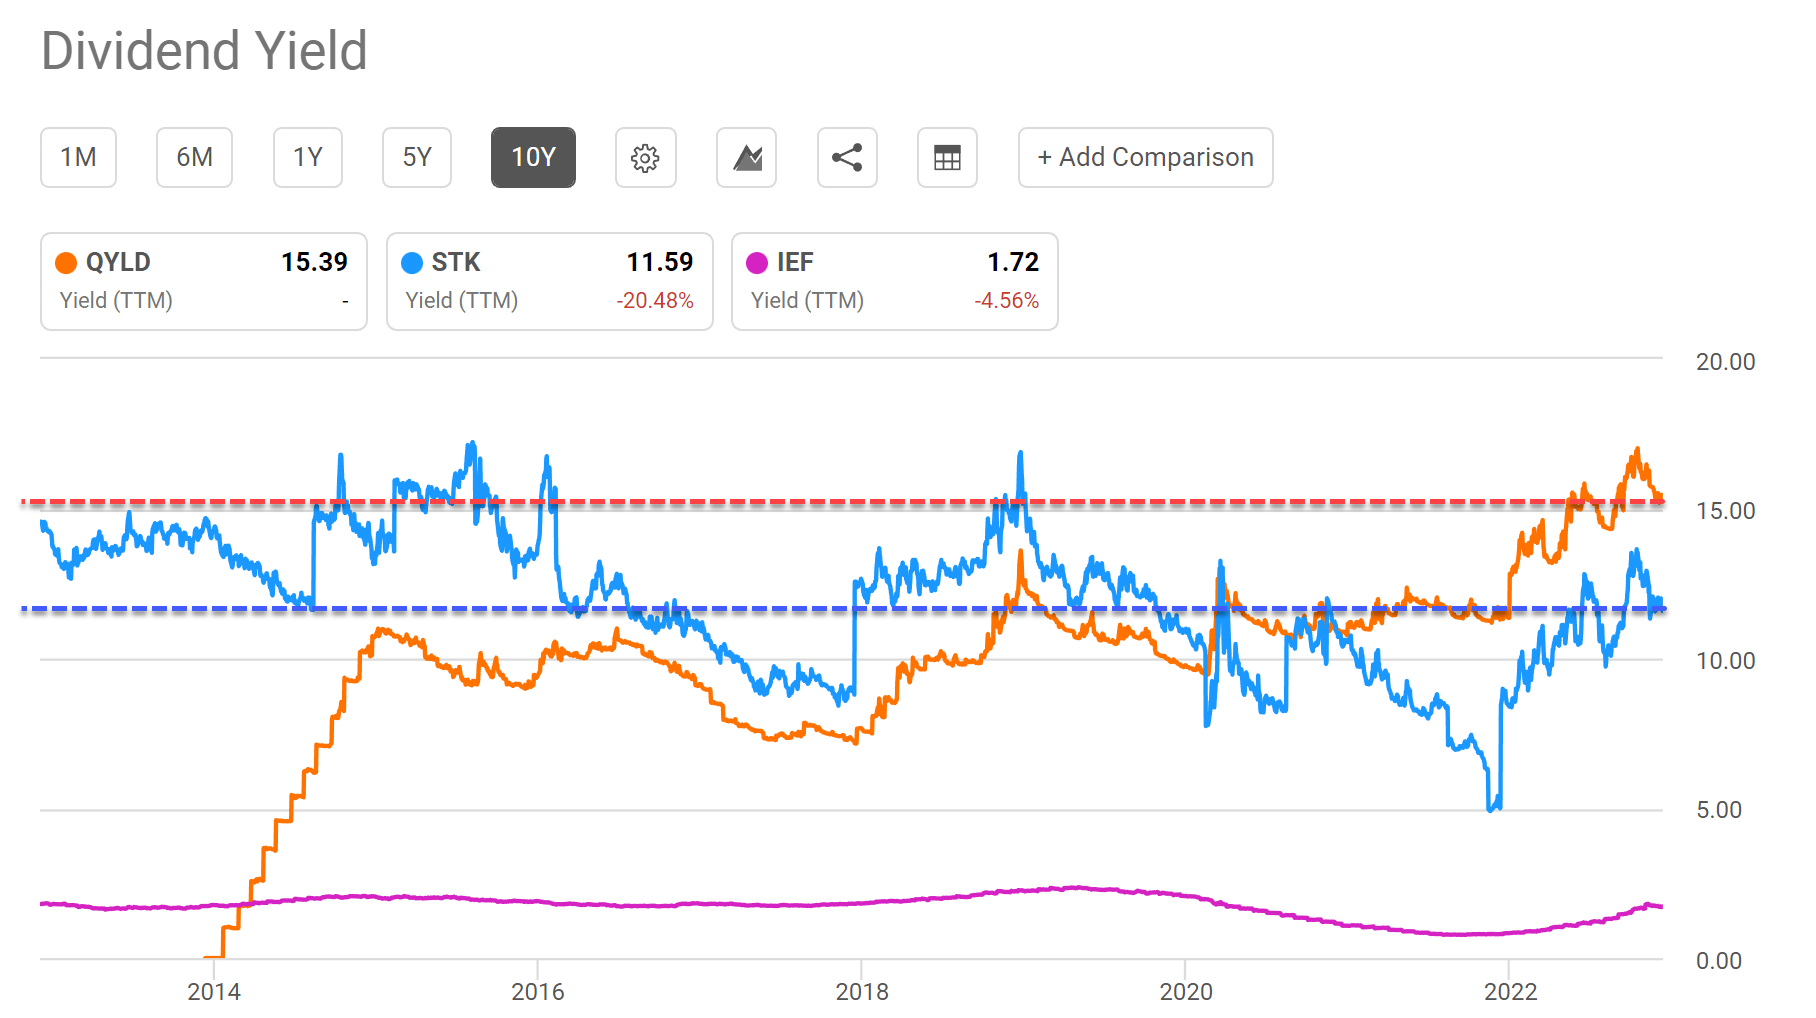
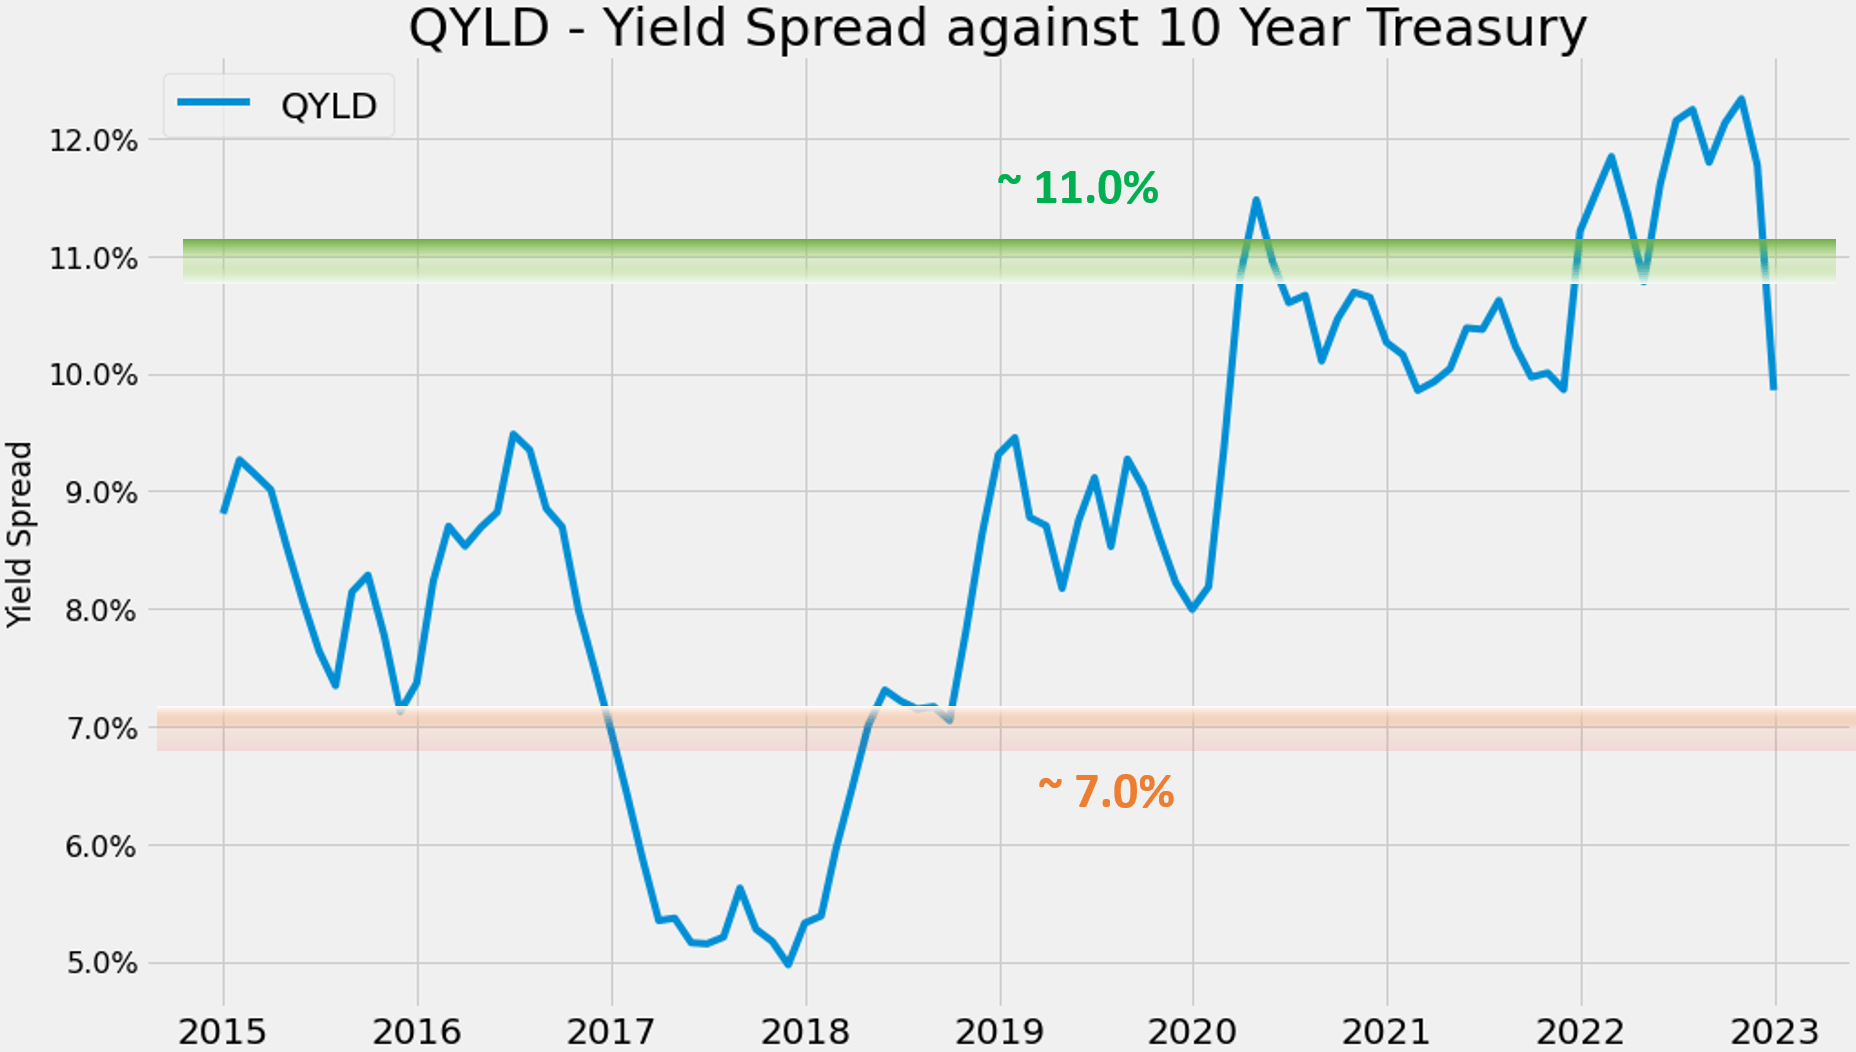
STK and QYLD: yield spread relative to treasury rates
As detailed in our earlier writings,
Risk-free interest rates act as the gravity of all asset valuations and therefore serve as the universal benchmark for all yields. For funds such as STK and QYLD that pay regular dividends, a major indicator I rely on (and fortunately with good success so far) has been the yield spread (“YS”), i.e., the dividend yield minus the 10-year treasury bond yield. The spread also provides a measurement of the risk premium investors are paying. A thinner YS indicates a smaller margin of safety, and vice versa, therefore serving as a market timing indicator.
Against this backdrop, the next two charts illustrate the YS for STK and QYLD, respectively. As seen, the YS is bounded in both cases most of the time. To wit, in the case of STK, the YS has been in the range of ~6.0% and 9.75% most of the time. Suggesting that when the YS is near or below 6.0%, STK is substantially overvalued relative to risk-free interest rates. Currently, STK’s YS is about 3.82% based on a 7.3% TTM yield or 6.26% based on a 9.75% FW yield. In either case, the YS is near the thinnest level since 2011, signaling a high-risk premium relative to the risk-free rates.
The picture for QYLD is drastically different as seen in the 2nd chart. Its current yield of 15.3% is 11.8% above the 10-year treasury rates (about 3.49% as of this writing). And as you can see, such a YS is near the peak level since 2014.
Source: Author based on Seeking Alpha data Source: Author based on Seeking Alpha data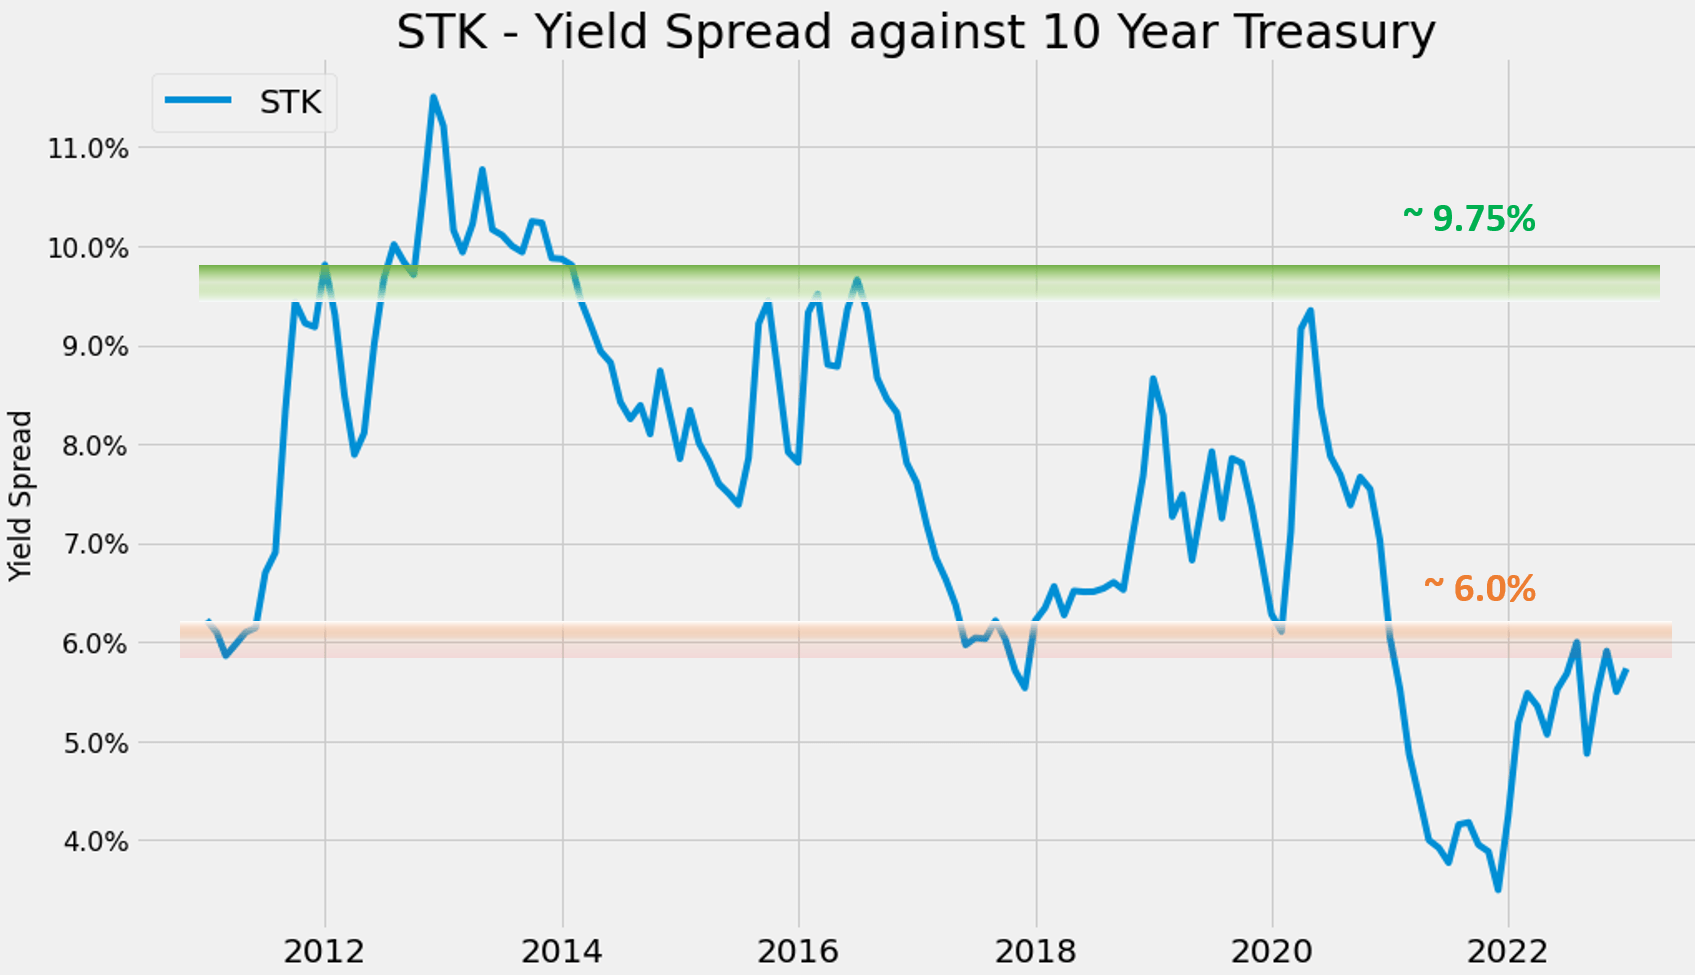
Readers familiar with our analyses know that short-term returns are closely correlated with YS for funds like QYLD or STK. For instance, the chart below displays the 1-yr total return from STK (including both price changes and dividend payouts) regressed on YS. The Pearson correlation coefficient is 0.43, indicating a clear positive correlation. In particular, as highlighted in the orange box, when the YS is near or about 9.0% as aforementioned, the total returns have been all positive except for 1 data point and there are several instances with 40%+ total returns.
As mentioned above, STK’s current YS is about 3.82% based on a 7.3% TTM yield or 6.26% based on a 9.75% FW yield. In either case, these levels of YS have not correlated favorably with near-term total returns in the past as shown.
Source: Author based on Seeking Alpha data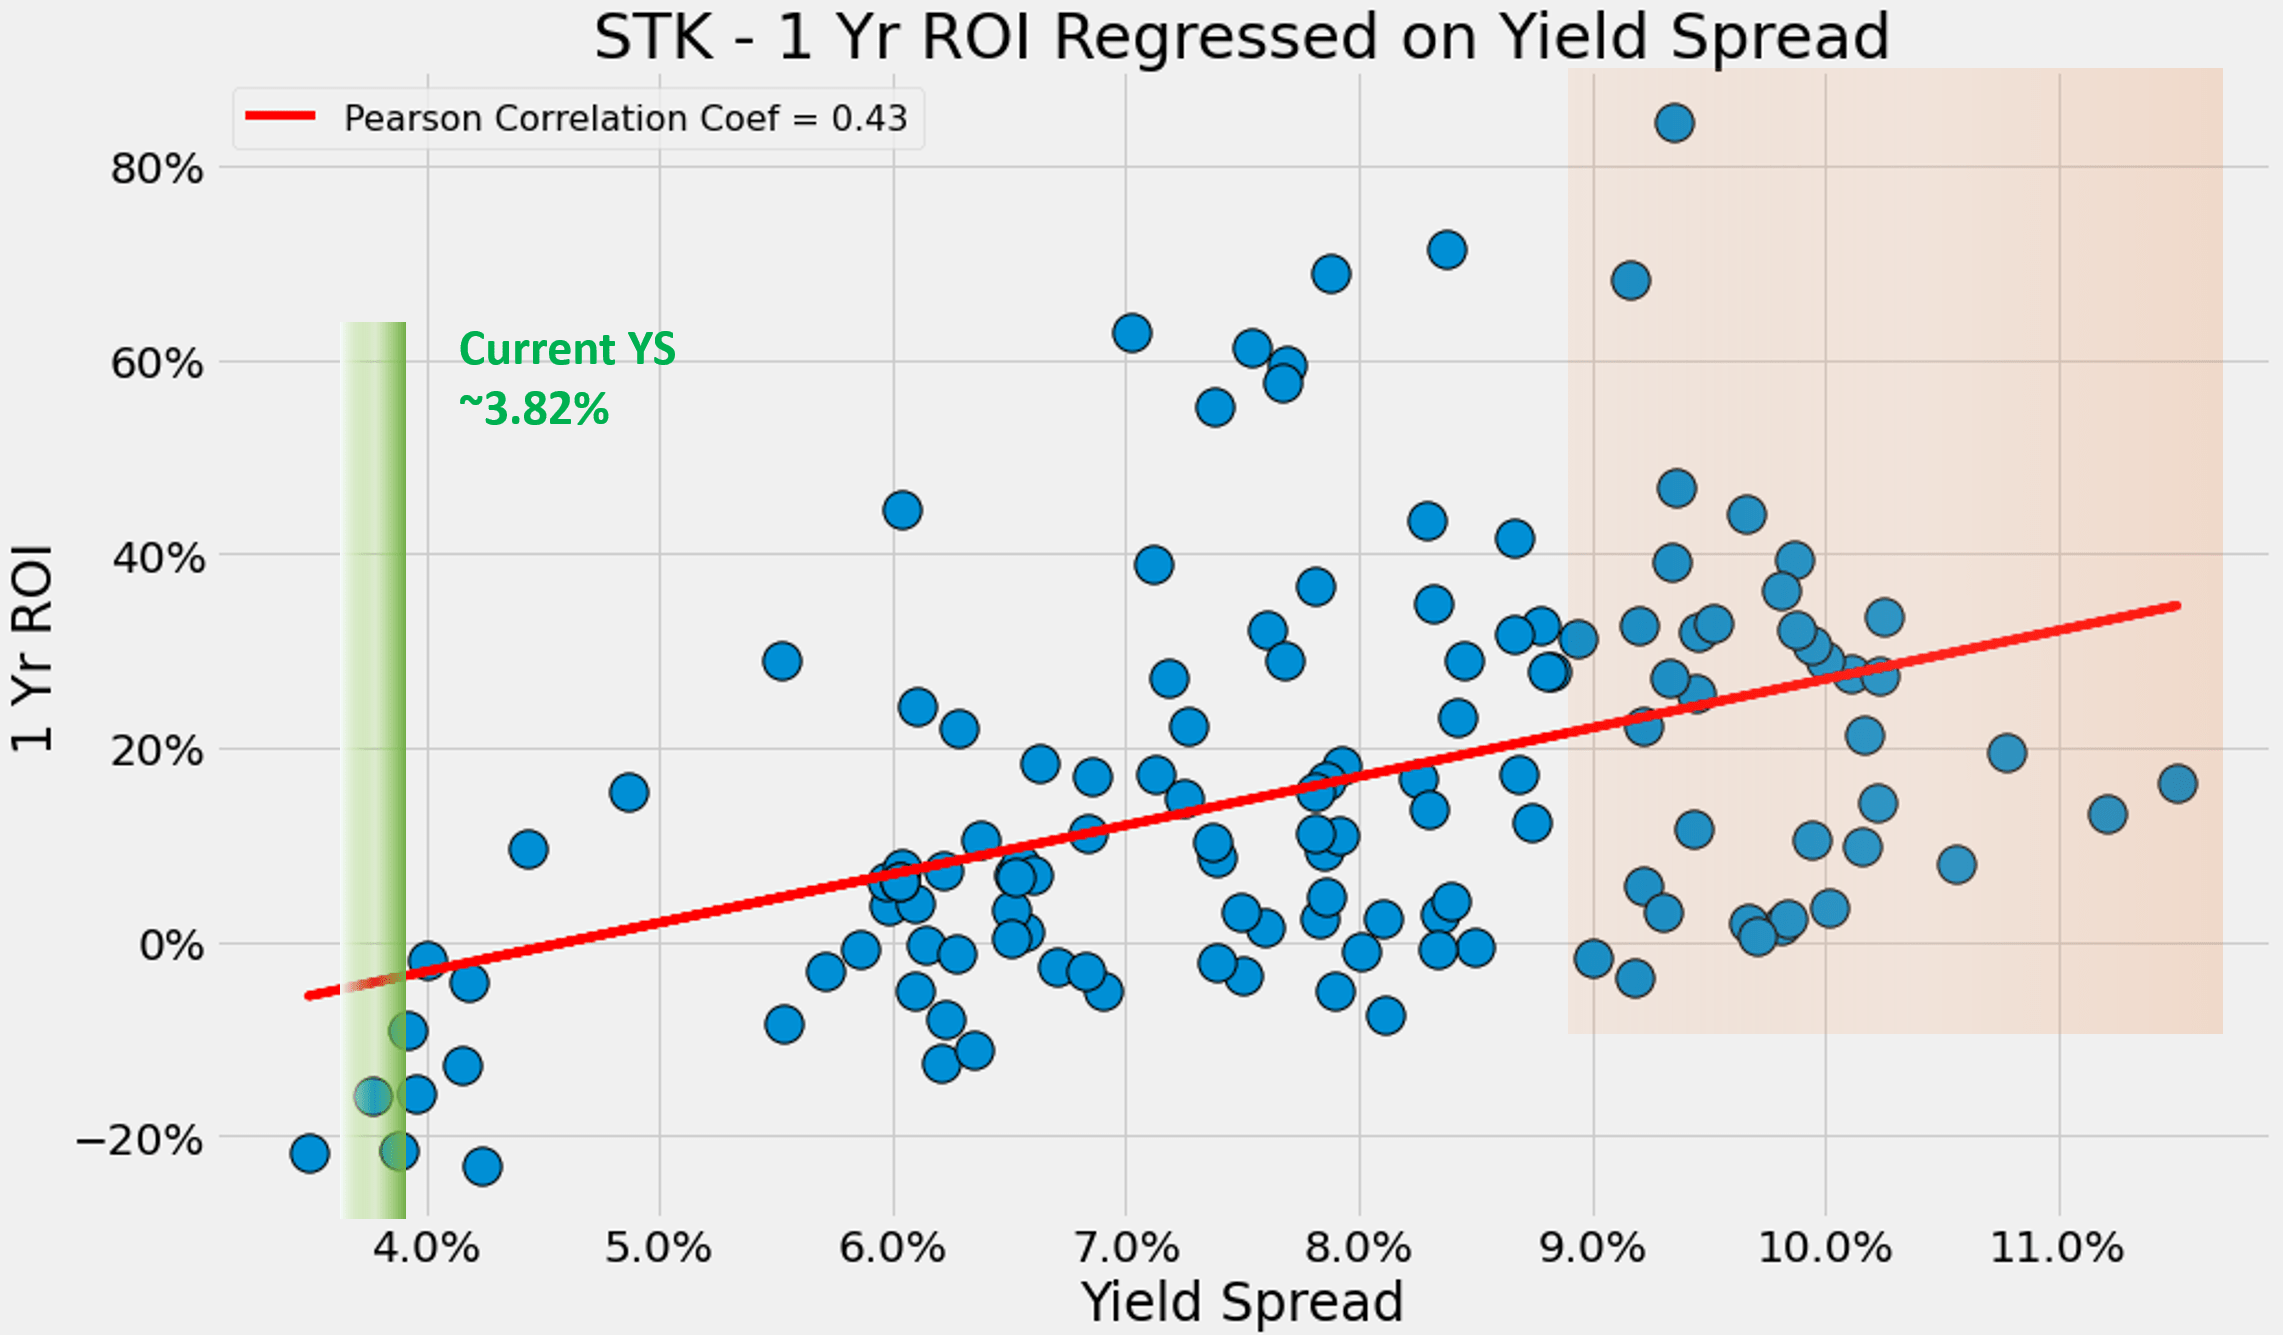
Other risks and final thoughts
Both funds face similar fundamental risks because of their use of call options. In a bull market, both STK and QYLD’s upside would be limited because of the use of covered calls. And since STK applies a lower level of its asset to write calls, this limitation is more severe on QYLD (as aforementioned, STK writes call options only on 25% to 90% of its underlying value). As a result, in a strong bull market, as you can see from the following chart, QYLD would underperform STK (and by a LOT in this case given the spectacular bull run during 2014 and 2022).
Source: Portfolio Visualizer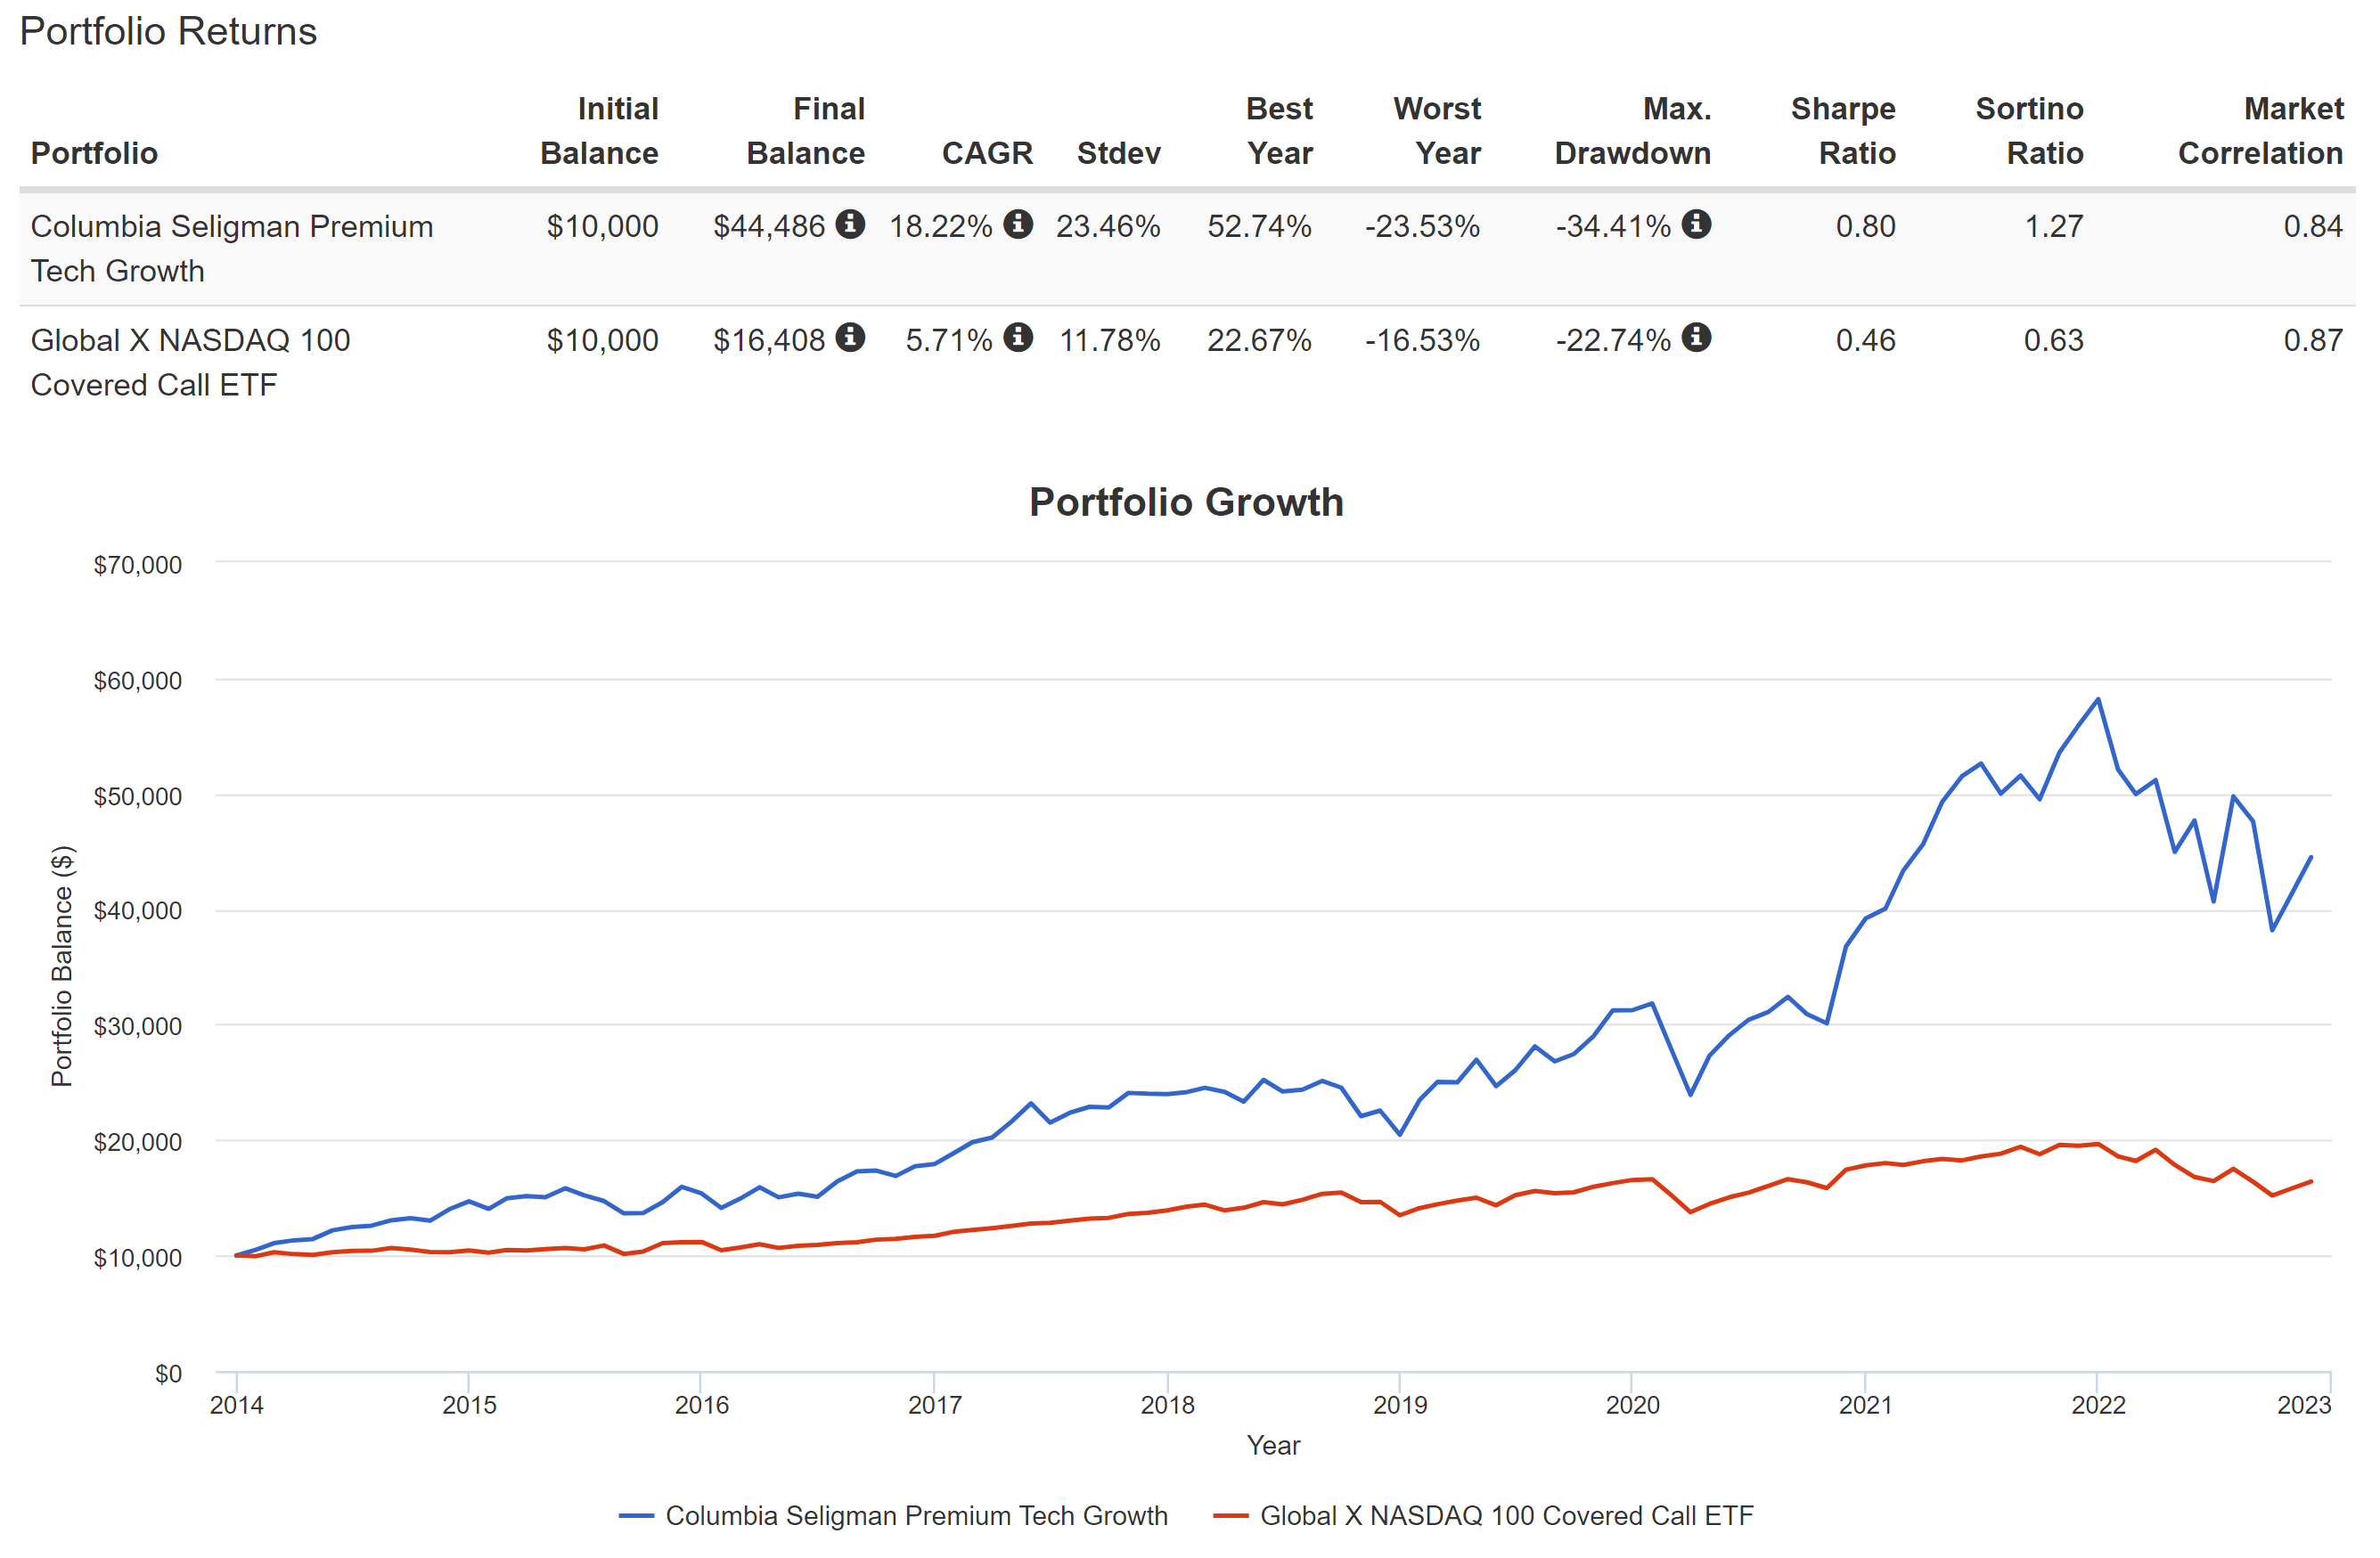
Although under current conditions, my overall conclusion is the risk-premium in STK relative to risk-free interest rates is the dominating force here. The valuation and YS divergence between STK and QYLD are too large here. And as a result, the upside limit posed by the use of calls is only a secondary consideration in the near term (say the next 1 or 2 years). The dynamics may change if their valuations change, risk-free interest rates change, or both. And I will provide an updated assessment if these changes happen.
Happy investing in 2023!
Be the first to comment