

DNY59
LVHI strategy and portfolio
The Franklin International Low Volatility High Dividend Index ETF (BATS:LVHI) tracks the QS International Low Volatility High Dividend Hedged Index. It has been launched on 07/27/2016. As of writing, it has 107 holdings, a 30-day SEC yield of 5.64% and a total expense ratio of 0.40%. It pays quarterly distributions.
As described by Franklin Templeton, eligible stocks must:
- be listed in one of 18 developed countries,
- be in the MSCI World ex-US IMI Local Index,
- show profitability over the last 4 fiscal quarters,
- have paid or are anticipated to pay a dividend.
A “stable yield” score is calculated by adjusting the yield of stocks with price volatility, earnings volatility, local interest rates and withholding taxes on dividends. Weights are calculated to maximize the aggregate stable yield score. Limits are set for constituents (2.5%), sectors (25% in general, 15% for REITs), countries (15%) and regions (50%). The underlying index is reconstituted annually and rebalanced quarterly. The fund seeks to mitigate the risk of currency fluctuations for dollar-based shareholders using foreign currency forward contracts, futures and swaps. Hedging positions are usually reset on a monthly basis.
The fund invests mostly in large cap companies (about 80% of asset value). Japan and the U.K. are the heaviest countries in the fund (15.5% and 14.8%, respectively). Hong Kong weighs 4.8%, which represents a moderate exposure to geopolitical and regulatory risks related to China. The next chart plots the top 11 countries, representing 95% of asset value.
LVHI countries. (chart: author; data: Franklin Templeton.)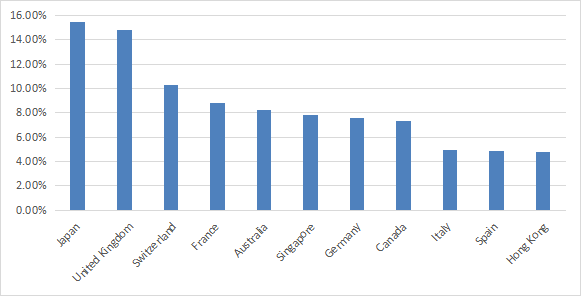
Financials are the heaviest sector with over 23% of asset value. Communication, consumer staples and utilities are in a 12% to 13% range. Other sectors weigh no more than 10% individually and 37% together. The fund almost ignores energy and technology.
LVHI sectors. (chart: author; data: Franklin Templeton.)
The next table lists the top 10 companies / top 11 holdings. The position in Rio Tinto (RIO) is doubled because it is dual-listed, and it is a part of national indexes in both the U.K. and Australia. This list represents about 30% of the portfolio. Rio Tinto weighs 5.74% in total, other companies are below 3%.
|
Ticker |
ISIN |
Name |
Weight% |
Currency |
|
RIO |
AU000000RIO1 |
RIO TINTO LTD |
2.87 |
AUD |
|
RIO |
GB0007188757 |
RIO TINTO PLC |
2.87 |
GBP |
|
NOVN |
CH0012005267 |
NOVARTIS AG-REG |
2.79 |
CHF |
|
8058 |
JP3898400001 |
MITSUBISHI CORP |
2.79 |
JPY |
|
6178 |
JP3752900005 |
JAPAN POST HOLDINGS CO LT |
2.71 |
JPY |
|
IBE |
ES0144580Y14 |
IBERDROLA SA |
2.71 |
EUR |
|
BATS |
GB0002875804 |
BRITISH AMERICAN TOBACCO |
2.66 |
GBP |
|
DBS |
SG1L01001701 |
DBS GROUP HOLDINGS LTD |
2.65 |
SGD |
|
BHP |
AU000000BHP4 |
BHP GROUP LTD |
2.65 |
AUD |
|
2914 |
JP3726800000 |
JAPAN TOBACCO INC |
2.62 |
JPY |
|
BMW |
DE0005190003 |
BAYERISCHE MOTOREN WERKE |
2.62 |
EUR |
(source: Franklin Templeton)
Past performance compared to competitor
The next table compares LVHI since August 2016 with its closest competitor, the WisdomTree International Hedged Dividend Growth Fund (IHDG), reviewed here, and a U.S. dividend benchmark, the SPDR Portfolio S&P 500 High Dividend ETF (SPYD). It would make little sense to compare LVHI to non-hedged global dividend ETFs.
|
Total Return |
Annual.Return |
Drawdown |
Sharpe ratio |
Volatility |
|
|
LVHI |
24.35% |
3.49% |
-33.75% |
0.27 |
13.49% |
|
IHDG |
74.93% |
9.20% |
-30.48% |
0.63 |
13.80% |
|
SPYD |
57.14% |
7.37% |
-43.56% |
0.41 |
19.56% |
Data calculated with Portfolio123
LVHI has underperformed IHDG by about 50 percentage points in total return since inception (reinvesting dividends). However, in the last 12 months, LVHI has beaten IHDG:
LVHI vs IHDG, last 12 months (Portfolio123)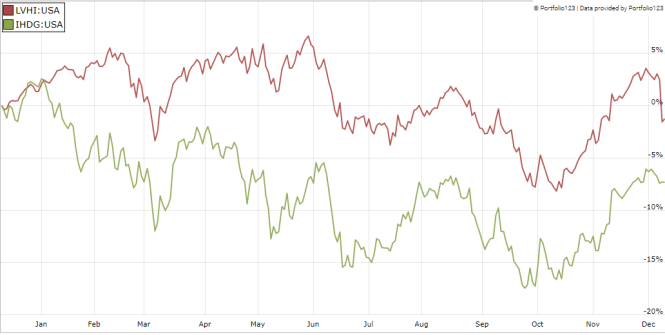
Since inception, the share price has gone sideways with ups and down, gaining only 4%.
Share price (without dividend) (Trading View on Seeking Alpha)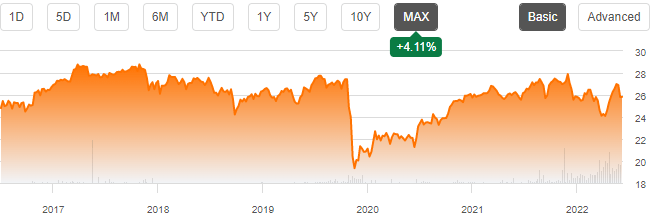
The next table shows that the annual sum of distributions also has large ups and downs. 2022 is a great year, but there is no pattern to predict how it will evolve in 2023.
|
2017 |
2018 |
2019 |
2020 |
2021 |
2022 |
|
0.95 |
2.57 |
1.45 |
0.84 |
0.86 |
1.98 |
Takeaway
LVHI is a currency-hedged ex-US dividend ETF. It is invested exclusively in developed countries, Japan and the UK taking the first 2 ranks. The heaviest sector is financials with about 23% of asset value. LVHI has significantly lagged its closest competitor, IHDG. Unexpectedly, the “low volatility” strategy results in a quite high volatility in price and distributions. The share price has been on a roller coaster with no trend since inception, and annualized distributions show large variations. For transparency, a dividend-oriented part of my equity investments is split between a passive ETF allocation and my actively managed Stability portfolio (14 stocks), disclosed and updated in Quantitative Risk & Value.
Be the first to comment