

pabradyphoto/iStock via Getty Images
Former Fed Chairman Alan Greenspan was famous for obfuscation in his public comments on Fed policy. He once said:
“I know you think you understand what you thought I said, but I’m not sure you realize that what you heard is not what I meant.”
The philosophy at the time was that by not being transparent, the Fed had more flexibility to better control things. By not holding press conferences or issuing statements following FOMC meetings, the Fed could change policy without being tied to previous statements.
Greenspan’s successor, Ben Bernanke, was instrumental in steering the Fed to become less secretive and more transparent. He instituted holding regular press conferences to better explain monetary policy decisions and began to provide forward guidance. This allowed investors to have a better understanding of the direction of Fed policy.
The current Fed continues in this vein. After the March 16 Fed Meeting Fed Chairman Jay Powell announced a 25 basis point hike in the Fed Funds rate, the Fed’s first rate increase since 2018. He is determined to bring down inflation, and plans to do this with additional Fed Funds rate hikes, as well as a reduction in the Fed’s balance sheet.
This past week several Fed members have expressed their views that the Fed will be more aggressive in reducing its balance sheet to control inflation. With the release of the minutes from the March FOMC meeting, the Fed’s intentions became clearer:
Fed officials agreed that a maximum of $60 billion in Treasury’s and $35 billion in mortgage backed securities will be allowed to roll off each month, phased in over three months, and likely starting in May.
Why Reducing the Balance Sheet is Necessary
The Fed first began using its balance sheet as a major monetary policy tool during the 2008 global financial crisis. Their immediate policy response to the crisis was to lower the fed funds rate, which was cut from 2% to essentially zero during the fourth quarter of 2008. However, more stimulus was needed to prevent the economy from collapsing. Having hit the zero lower bound for interest rates, the Fed turned to a less conventional policy tool of Large Scale Asset Purchases, more commonly known as Quantitative Easing. Purchased securities were placed in the System Open Market Account (SOMA).
This resulted in a massive expansion of their balance sheet, from a pre-crisis level of $850 billion, to $4.5 trillion.
The dramatic increase in the balance sheet was always intended to be temporary. Once the economy stabilized and the crisis had passed, the goal was to remove the extraordinary measures used to combat the crisis and to return to a more normal policy. A balance sheet normalization plan was put in place, but it proved to be more difficult to implement than expected.
Despite experiencing the longest economic recovery in our history, lasting for more than 10 years, with the unemployment rate falling to a 50 year low of 3.6% and stocks setting all-time highs, the Fed was only able to cut $670 billion of the $3.65 trillion it had added to the balance sheet.
Then COVID happened, causing a complete shutdown of our economy.
The Fed stepped in again, cutting rates back to zero and injecting massive amounts of liquidity through more Quantitative Easing. The balance sheet ballooned to almost $9 trillion.
In two years the SOMA portfolio has doubled and is now ten times the level prior to the onset of Quantitative Easing.
Federal Reserve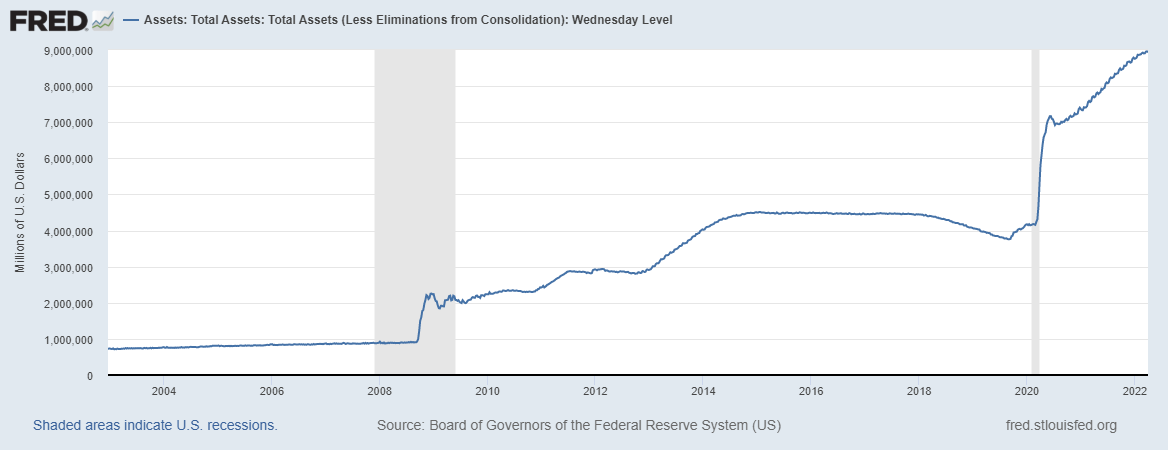
The fear has always been that this dramatic infusion of liquidity would be inflationary, but for several years this fear was unfounded. Inflation initially remained quite stable. While the Fed has had an implicit target of 2% inflation since 1995, in 2012 Bernanke made that target explicit. The FOMC announced that an inflation rate of 2% is consistent with the Fed’s long run goal of price stability.
When the 2% inflation target was breached in the second quarter of 2021, the Fed felt that the increase was transitory, but now, a year later, that has proven not to be true. Inflation rates are currently the highest they have been in almost 40 years and the Fed is concerned.
BLS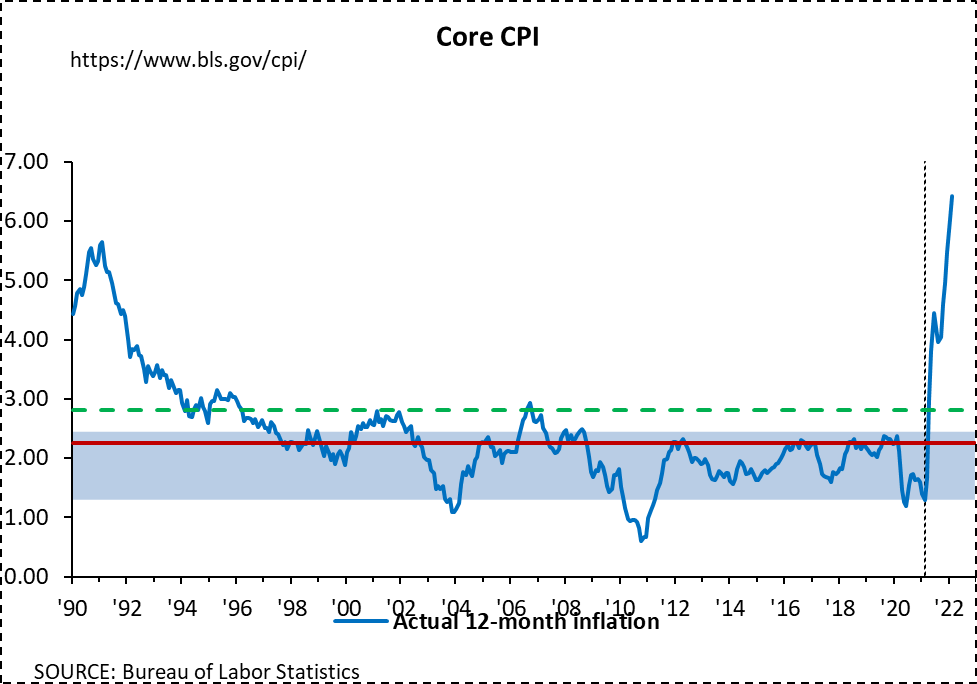
The Fed has two main tools for tightening monetary policy to control inflation. The first is to increase the interest rate they pay on bank reserves and the second is to reduce the stock of bank reserves. Both were announced in the minutes of the March 16 FOMC meeting.
The interest rate paid on reserve balances was immediately increased to 0.40%. To reduce reserves, the committee announced plans to begin the roll off from their SOMA portfolio starting in May.
While action is being taken, one can argue that it is too little, too late. There are lags between the implementation of monetary policy and its economic effect, and the Fed has gotten off to a slow start.
The Unspoken Impact of Inflation of the Balance Sheet
As inflation has increased, so have interest rates, and this rise in rates has had a significant impact on the Fed balance sheet.
A large portion of the purchases of Treasury and MBS securities occurred when rates were extremely low. In fact, $3.2 trillion of the asset purchases occurred when the 10 year Treasury note was yielding less than 1.0%. This is more than 1/3 of the entire SOMA portfolio. Another $2.0 trillion of the SOMA portfolio was purchased with the 10 year note yielding less than 2.0%. Combined, almost 60% of the portfolio was purchased with the yield on the 10 year note less than it is today.
Federal Reserve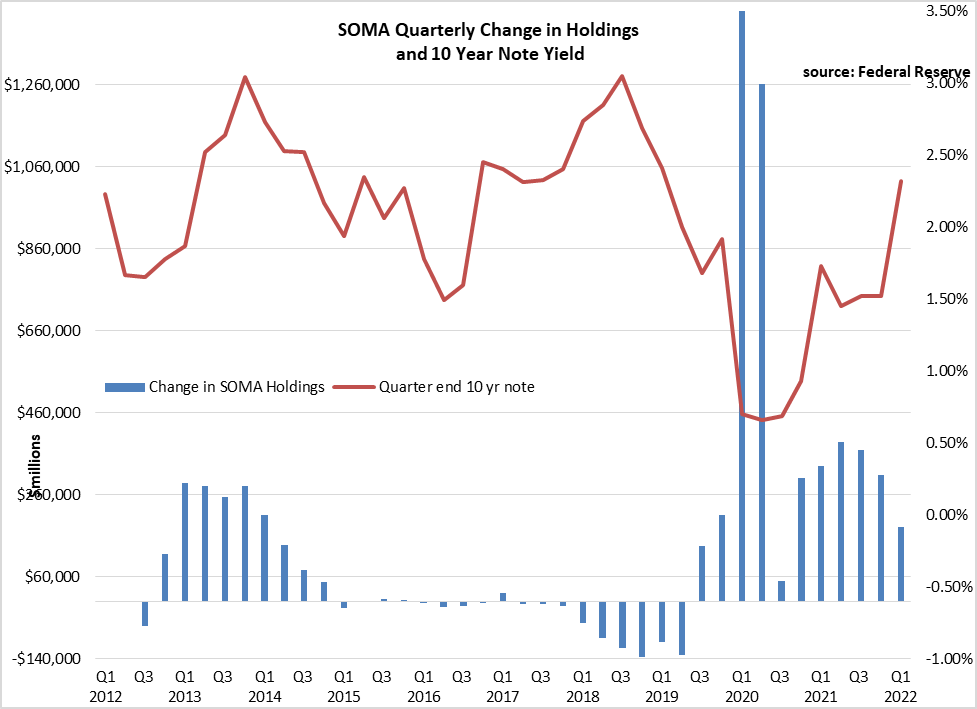
The net of this is that on a market value basis, the entire Federal Reserve SOMA Portfolio is underwater. That is, the market value of the portfolio is less than the cost of acquiring the assets!
When the Fed reports its quarterly financial statement for March 31, 2022, the unrealized loss for its SOMA Portfolio will be an estimated -$157 billion.
This is even more startling when one considers that the total capital for the Federal Reserve is $41 billion. The unrealized losses of the Fed’s portfolio are large enough to wipe out the Fed’s capital four times over!
This calculation is at quarter end when the 10 year note was yielding 2.32%. Over the ensuing week, the 10 year note has jumped another 38 basis points to 2.70%.
Assuming the Fed’s SOMA portfolio has a 4.8 year duration, this 38 basis point increase in rates would imply an additional $160 billion unrealized loss on the Fed portfolio. If rates continue to rise in this tightening cycle, the unrealized loss will only grow larger.
Federal Reserve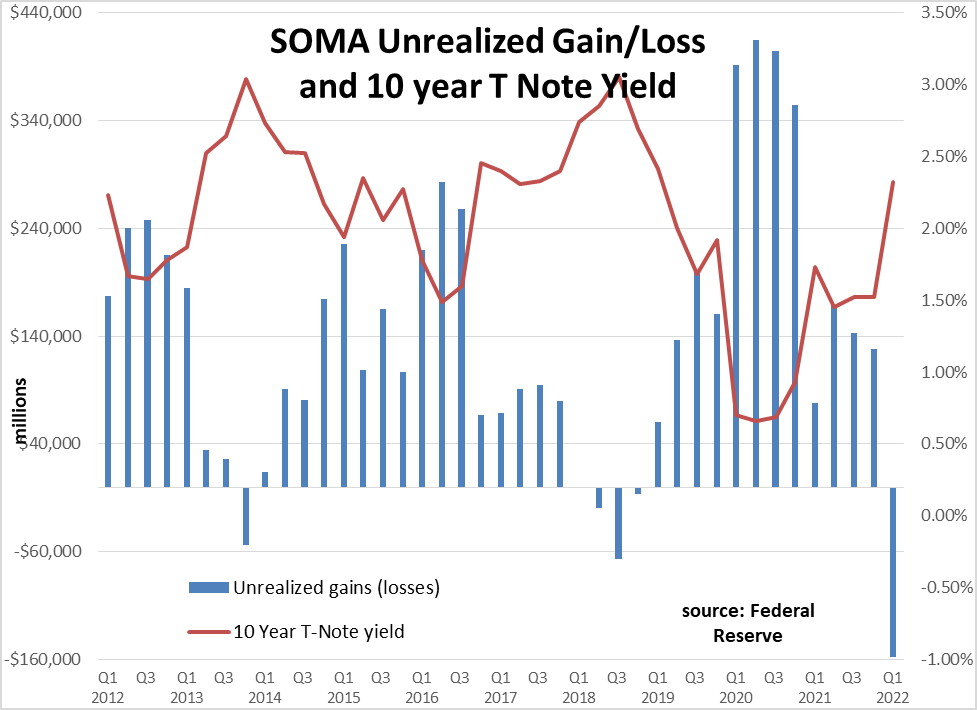
The Fed is fortunate in that it they use their own unique set of accounting rules. They are guided by accounting principles as determined by the Federal Reserve Board of Governors which, unlike GAAP accounting, allows the Fed to carry securities at “Amortized Cost” instead of at “Fair Value.” As such, gains and losses due to market movement are only recognized upon the sale of securities. Instead, they monitor their unrealized gains and losses in a footnote.
This accounting principle limits the Fed’s ability to reduce its balance sheet by selling assets, because it would force them to recognize losses. They do, however, have a mechanism that would allow them to carry losses without impairing their capital. To do so, a new category would be created called “deferred asset” which would show up as a negative entry on the asset side of their balance sheet.
These accounting maneuvers, however, do not change the fact that the SOMA portfolio has a market value that is significantly lower than its cost. This fact does not exude confidence in the Fed.
While the current Fed attempts to be transparent in their policy announcements, perhaps there is still some Greenspan obfuscation lingering.
Be the first to comment