

Darren415
This article was first released to Systematic Income subscribers and free trials on Oct. 24.
CLO (collateralized loan obligation) equity closed-end funds (“CEFs”) like Oxford Lane Capital Corp (NASDAQ:OXLC) and Eagle Point Credit Company Inc. (NYSE:ECC) continue to appeal to income investors due to their high distribution rates. In this article, we highlight some of the misconceptions that surround these funds. The key takeaway is that while these funds undoubtedly carry risk, some investors tend to be worried about the wrong things. We also highlight how investors can think about valuations of the CLO Equity asset class in gauging attractive entry points. Within the trio of CLO Equity CEFs, we see value in ECC, trading at a flat discount and a 16.4% current yield.
Key CLO Equity CEF Misconceptions
In this section, we highlight some of the key misconceptions we have come across in the commentariat relating to these funds as well as to the CLO Equity asset class more broadly. Ultimately, income investors are best served when they get a fuller picture of the risk/reward on offer.
CLOs will do X because of Y
This is a bit of a pet peeve but a lot of commentary across both CLO Equity and CLO Debt securities speaks blithely about “CLOs” as in CLOs will do X or Y in this or that market environment. It doesn’t make any sense to speak about CLO performance or behavior in general terms. That’s because CLO Debt and CLO Equity have extremely different risk / return profiles.
Higher-rated CLO Debt securities are: 1) static securities; 2) are short a call option; and 3) are some of the highest-quality securities available in the fixed-income space outside of Treasuries with an incredible track record (i.e., no defaults on CLOs originally rated AAA ever and only 1 for AA-rated CLOs).
On the other hand, CLO Equity are: 1) better described as dynamic investment strategies than securities; 2) long the refi and reset options; and 3) have highly variable performance due to greater dependence on CLO vintage and manager alpha.
5Y CLO Equity total returns are negative now or compare poorly to some other funds, e.g., SJNK, SPY
It may sound counterintuitive but an asset class that happens to have a low return over a given period does not actually tell you a whole lot. There are tons of examples of major asset classes going through periods of low or negative returns. The chart below shows the rolling 5Y return of the High Yield corporate bond market. Just in the last three years, we have seen the 5Y return move close to zero on two different occasions. There were two other instances where the 5Y return moved into negative territory this century. Does this make HY corporate bonds uninvestable? No. Are there many more 5Y periods where the HY market had fantastic performance? Yes.
Systematic Income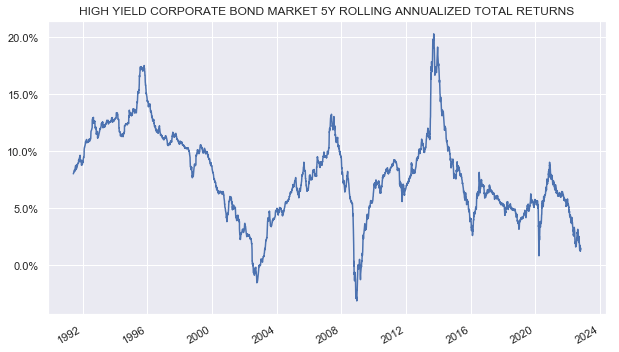
HY bonds are not alone here. There are also multiple decade-long periods where U.S. stocks delivered no returns. Does this make U.S. stocks uninvestable as an asset class? No.
Credentwealth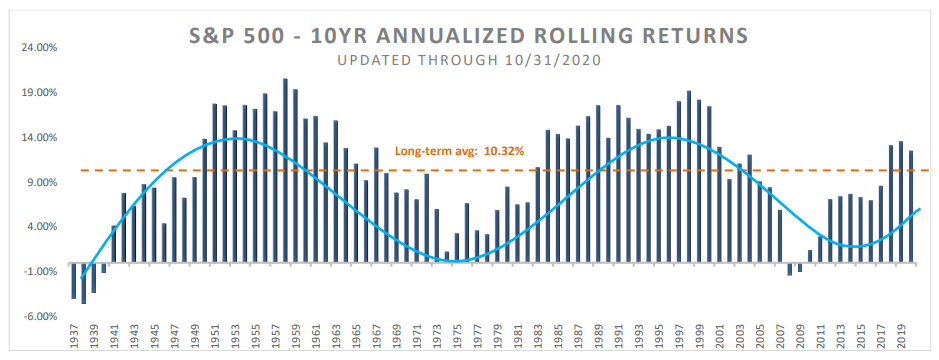
This will come as little surprise to most income investors, but asset prices can fall and sometimes they can fall a lot. 2022 is one of those times. Therefore, it’s not shocking to find that CLO Equity has delivered a low 5Y total return – the same is true for most other asset classes. Having a low 5Y return in 2022 tells us nothing about whether a given asset class is worth allocating to or not. In fact, previous low return periods have marked fantastic entry points.
The other reason why the 5Y period total return is misleading is that CLO Equity CEF valuations have fallen significantly. In other words, a big reason for the low 5Y total return of CLO Equity CEFs like OXLC and ECC has to do with the deflation in the funds’ premium rather than any collapse in NAV returns. The following chart shows that the valuation of ECC fell from north of 20% to about zero. As many investors know, buying any fund at a 20+% premium is asking for trouble.
Systematic Income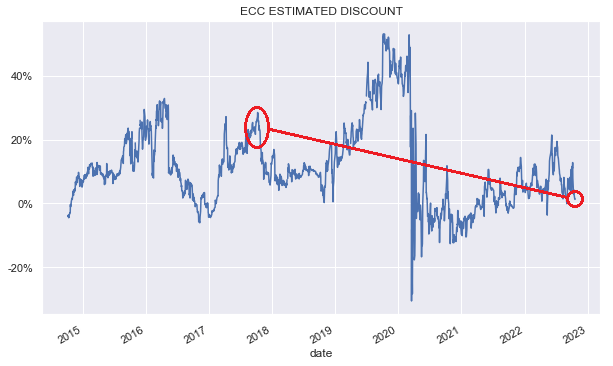
If we focus on total NAV returns, they look much better – the 5Y total NAV return for OXLC and ECC is 10% and 5.9% CAGR, respectively – that’s better than the vast majority of credit CEFs, even the vaunted PIMCO credit CEFs.
Systematic Income CEF Tool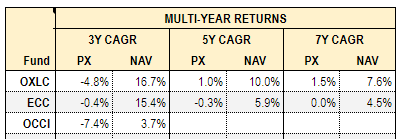
In short, using the 5Y total return window is a misleading way to analyze securities given today’s credit valuations and it is particularly poor at getting a sense of CEFs, whose returns are influenced as much by moves in discounts as by their total NAV performance.
So whenever investors are offered a price chart of OXLC and ECC like this to “prove” that they are “bad” funds, they should instead reply with the total NAV return chart of the funds.
Google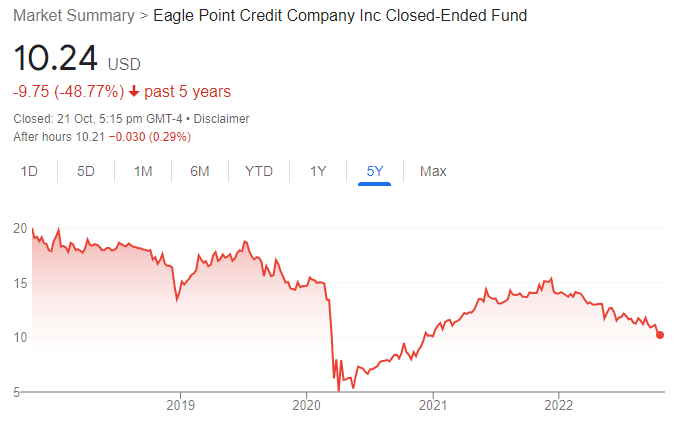
And that chart looks like the following. For investors trying to understand the actual value-generation capacity of CLO Equity CEFs this chart is much more useful.
Systematic Income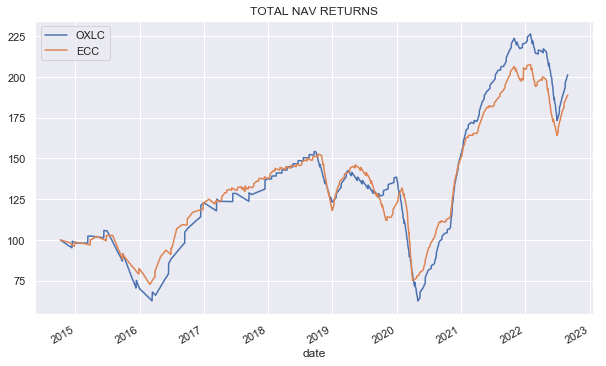
Holding CLO Equity going into a recession is dumb
This view is very intuitive. After all – CLO Equity is a leveraged play on bank loans. And loans, as well as other credit assets, tend to struggle during recessions. The chart below shows that loan defaults tend to spike during recessions as they did during the GFC, the near Energy shock recession. and the COVID recession.
S&P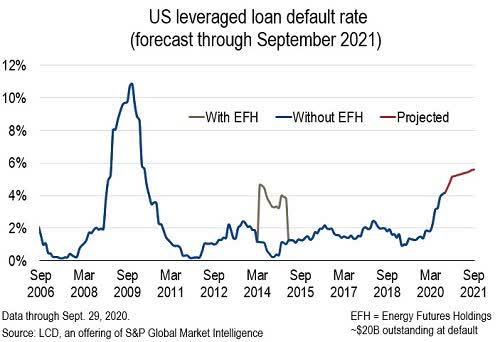
However, this is another example of where a little knowledge is a dangerous thing. The point is that CLO Equity is not just a leveraged play on loans. As we suggested above, it is more akin to a dynamic allocation strategy. Specifically, CLO Equity benefits from a number of embedded options such as the reinvestment option and the call option which allow CLO Equity to generate additional returns in a weak market environment.
Specifically, in a period of elevated default rates, CLO Equity benefits from reinvested principal prepayments and amortization payments into loans trading at depressed prices. Since the majority of these loans tend to redeem at par, this accrues directly to the CLO Equity tranches. The chart below shows that CLO Equity delivered stellar results through the GFC specifically because of this dynamic.
Nuveen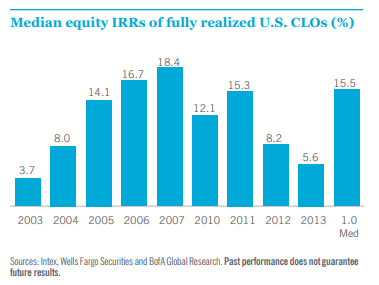
Total NAV returns over the COVID shock were very strong as well – they are highlighted in the table below from our CEF Tool.
Systematic Income CEF Tool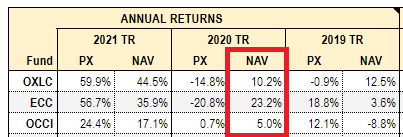
It’s important to understand why results over the GFC and the COVID shock were so strong and why they did not align with the simple intuition that holding leveraged exposure to bank loans in the form of CLO Equity over a recession is dumb.
What’s important to understand is that there is a self-correction element to both CLO Equity and CLO Debt. The self-correction elements of CLO Debt securities are baked into the CLO structure in the form of various performance tests, summarized below.
Guggenheim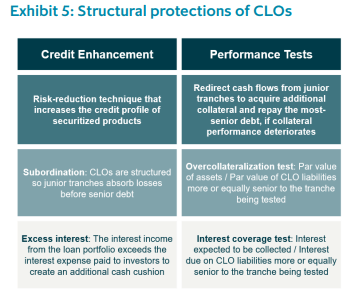
CLO Equity, on the other hand, benefits from a number of options which become highly valuable during periods of high volatility. The chief among these, and the one most relevant in the current market environment, is the reinvestment option which allows CLO managers to reinvest principal and amortization payments on loans in the portfolio into loans trading below par.
A loan acquired at $90 which redeems at par sees the entire $10 go right to the bottom line of CLO Equity. This is why a distressed loan environment can be highly advantageous for CLO Equity since skilled managers can acquire loans at a steep discount and enjoy the full accretion back up to par. Granted, some loans will suffer defaults and the loan prepayment rate typically slows in a difficult market environment, but the history is very clear – CLO Equity has performed exceptionally well during periods of distress because of this important feature. Neglecting the power of the reinvestment option also causes many investors to wrongly conclude that it is “obvious” that holding CLO Equity in a tough market environment is a dumb thing to do.
Other options enjoyed by CLO Equity include the refi option, also called the “call” option as well as the reset option. The refi option allows managers to refinance the transaction after the non-call period, allowing them to lower the cost of leverage and restructure the CLO with debt at lower levels. This is particularly powerful in an environment of strong risk appetite such as the one we saw in 2021. A reset allows managers to extend the term of the CLO deal. These options combine to deliver a much stronger performance potential for CLO Equity than the usual view that some investors have that they are just dumb leveraged portfolios of loans.
Ever falling NAVs show CLO Equity overdistribute
That OXLC and ECC NAVs have fallen over time is a fact.
Systematic Income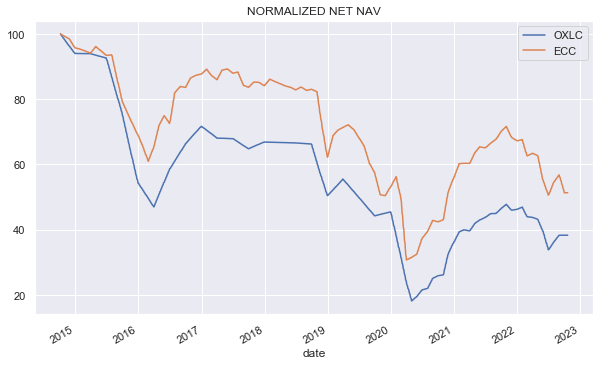
What may surprise investors is that these funds are far from alone in this behavior. All fixed-income funds have seen lower NAVs over time – a selection of sectors is shown in the chart below. This behavior doesn’t make Municipal bonds or High Yield bonds or Preferreds a Ponzi scheme like some investors attest. There are multiple drags on fixed-income performance, ranging from the coupon convention of Municipal bonds which causes them to be issued at prices above par but redeemed at par to typical credit losses on higher-yielding assets such as loans or corporate bonds.
Systematic Income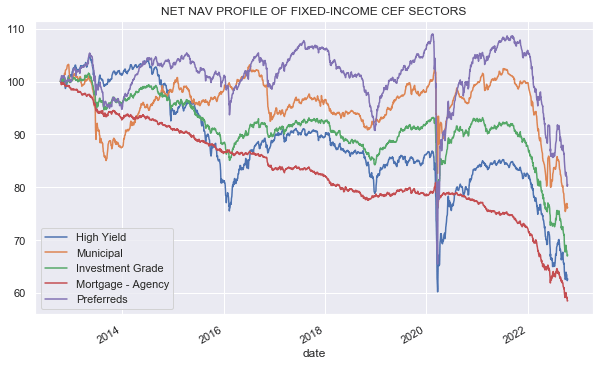
Separately, the complaint that CLO Equity funds see a deterioration in the NAV misunderstands the nature of the CLO Equity asset class. Specifically, CLO Equity has an annuity flavor to it – it distributes a lot of its principal through its periodic cashflows. This may seem odd for a credit security – many investors believe that a credit security should pay you a coupon and then the principal later on. However, this is simply not the way CLO Equity works.
The chart below shows two sample cashflow profiles from a study of CLO Equity returns. Both CLO tranches had very strong double-digit returns over their life. However, one looked like an annuity and the other paid out a “principal” equivalent to around 70% of “par.” If you hold these kinds of securities in a fund and distribute all of the income, the NAV of the fund will reduce over time. That’s just a reflection of the asset class. Other fixed-income asset classes have a similar annuity profile – mortgages are probably the most familiar to investors that have this flavor.
Maxwell Consulting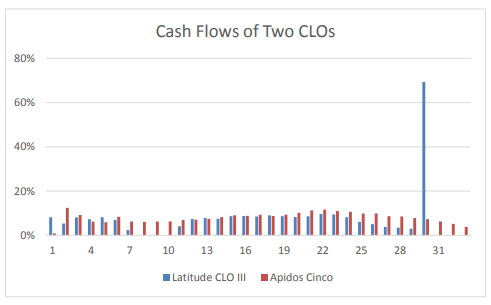
The NAV is just a random number based of Level 3 assets. Calculating it is complicated! It goes up, it goes down so don’t look at it.
We have some sympathy for the fact that CLO Equity is much less transparent than that of a typical credit fund. However, the idea that the NAVs of CLO Equity funds is some sort of complex random number and should be entirely ignored is also unfounded. The right answer for how investors should think about CLO Equity NAVs is somewhere between it being a Ponzi scheme that’s going to zero tomorrow and so random that it should be ignored.
The trajectory of CLO Equity fund NAVs is going to be downward. At the same time, it does give investors a decent guide for what kind of total returns they should expect. These total returns are very likely to be shy of the current distribution rates these funds boast. The specific drags these funds face are their partial annuity profile, high distribution rates, and occasional deleveraging in periods of high volatility and others. These drags are also found in many other credit CEF sectors.
Getting A Sense of CLO Equity Valuations
Apart from its dynamic profile and, perhaps, less intuitive nature, one thing that makes CLO Equity a tricky asset class for income investors is the fact that getting a sense of valuations is hard. Specifically, investors would like to know at any given time – how attractive is CLO Equity right now?
For instance, to gauge the attractiveness of corporate bonds we have historic credit spreads and yields. Loans are a bit more complicated because of the refinancing option, so there is something called discount margin which assumes a given refinancing period – usually 3 years.
For CLO equity there is no single analogue. There is something called net interest margin which is basically the residual yield that goes to CLO equity once CLO Debt tranches are paid their contractual coupons. A historic chart of CLO Equity NIM from Blackstone is shown below.
Blackstone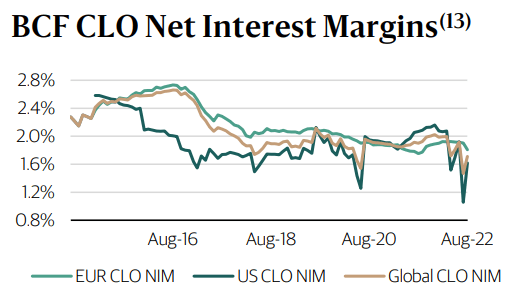
However, NIM is impossible to observe in real time (at least by retail investors) and, arguably, more relevant for new CLOs. It also doesn’t fully take into account the value of the reinvestment option. In other words, when equity NIM looks low such as right now (it’s around 1.6% versus the typical 1.8-2% range historically) it could be depressed by the fact that the value of the reinvestment option is fairly high since loans are trading at around $95.
We can also look at CLO Equity fund NAVs as shown below in a normalized way (i.e., starting from $100) for OXLC and ECC. Sharp drops in the NAV have historically offered an attractive entry point. This makes sense however there are limits to this as well. That’s because historically CLO Equity NAVs have moved lower over time – for example, ECC started at $20 in 2014 and is around $10 now – the 2021 peak was $14.
Systematic Income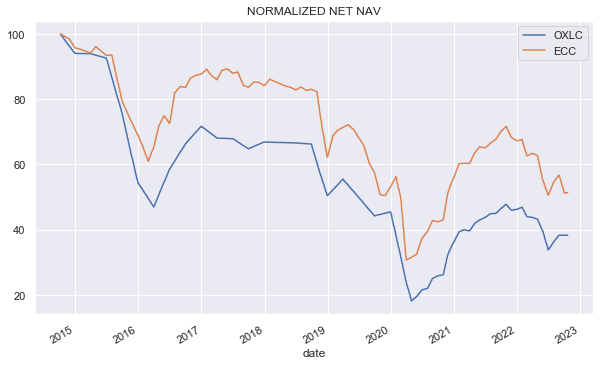
We can also look at the drop from the recent peak which is around 30%, and this gives a better sense of potential, although it’s not a metric that works over more than 1-2 years so it’s not able to give us a good historic profile.
We can also look at the average loan price – since, after all, CLO Equity is a leveraged portfolio of loans (with some other bits) and the value of the reinvestment option derives from the average loan price. Historically, loans tend to trade in the high 90s on average, outside of periods of distress as the following chart shows.
S&P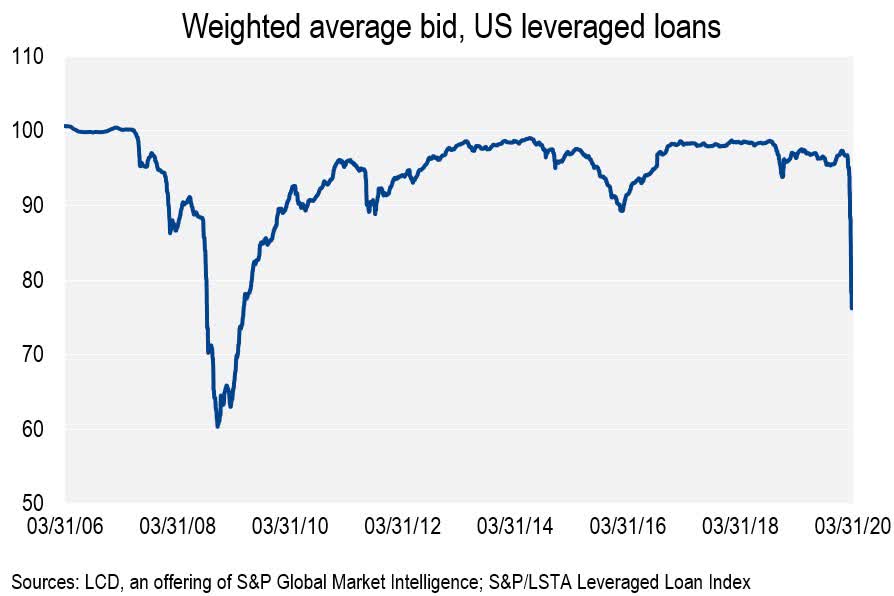
Current levels of around $95 are around $2-3 below the average level of the previous decade, indicating a decent entry point.
TCW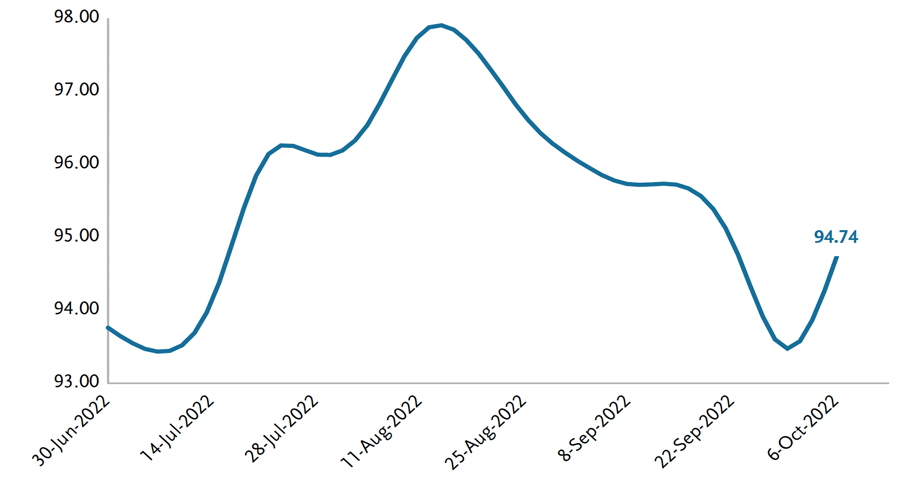
Ultimately, it’s a combination of a lot of these metrics that can give a good sense of the value in the asset class today. Today is a decent time to enter or add to CLO Equity exposure, and this is true for nearly all credit sectors.
Risks To Consider
As we suggest above, many of the misconceptions about the CLO Equity asset class come from the bearish side. At the same time, this doesn’t mean the asset class is without risk. It’s just that the things that tend to be highlighted are not the kind of risks that investors should focus on.
One key risk for investors in CLO Equity CEFs is the risk of deleveraging. All three CLO Equity CEFs (OXLC, ECC and OCCI) leverage themselves exclusively with senior securities, i.e., preferreds and senior unsecured debt. There are regulatory rules which prevent the funds from making distributions on common shares if the asset coverage of these leverage instruments falls below a certain level. And because these funds don’t like suspending distributions on common shares, they will tend to deleverage during periods of stress. This creates a drag on the performance of these funds.
The second key risk is that CLO Equity net interest margin remains at currently low levels. Lower excess spreads for Equity may result in lower returns going forward, all else equal.
The third risk is that prepayments fall significantly. A lower prepayment rate will make the reinvestment option less valuable for CLO Equity tranches. So far, the prepayment rate is holding up well in 2022 according to ECC but it could fall in the future.
Fourth, defaults may increase but loan prices could hold up, meaning CLO Equity is hurt by rising defaults but cannot benefit as much from the reinvestment option. This seems very unlikely, as credit markets usually price in a hefty premium for losses. In other words, loan prices tend to be significantly below actual realized losses over the cycle and this dynamic benefits CLO Equity.
Fifth, rating agencies expect loan recoveries to be lower in the next default cycle relative to historic averages. This is the result of an increase in cov-lite issuance, various structural features such as sidecars as well as an increase in no bond loan issuers, EBITDA addbacks and others.
Finally, it seems possible that the CLO 2.0 structure which is prevalent now in the market may be less advantageous for CLO Equity investors. As the following table shows, CLO 2.0 has generated a lower level of returns than CLO 1.0, which was more prevalent prior to and through the GFC. Clearly, the two market periods were not identical but there could be something there.
Citibank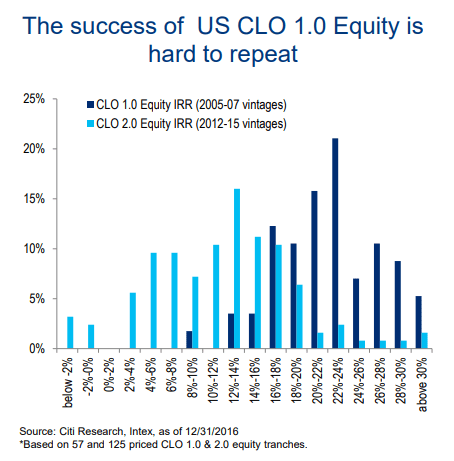
Stance And Takeaways
Overall, we view the CLO Equity space as attractive right now. Within the sector we currently favor ECC, despite its highest valuation in the CLO Equity CEF trio. It is currently trading at a flat discount versus a 20% discount for OCCI and an estimated 3% discount for OXLC (the estimate is based on our OXLC NAV estimate of $5.11 versus 5.74% in August as OXLC has not yet released its September NAV as of this writing).
One reason for us favoring ECC is that the fund has a higher weighted-average reinvestment period in its portfolio of 3.3 years versus 3.1 for OXLC, though the difference gap looks to have closed considerably. In our view, an extended recession is likely to keep loan prices longer below par, allowing the fund to benefit more from its reinvestment option.
Apart from the misconceptions discussed above, the key takeaway here is that entry valuations matter a great deal for CLO Equity CEFs. Buying CLO Equity funds at a 20% premium when the average loan price is trading at $99 is not well advised as it leaves very little margin of safety across both CEF valuations and underlying credit valuations. Current levels are much more favorable for strong through-the-cycle forward returns for investors than they were at most points over the last couple of years.
Be the first to comment