

Lemon_tm
Written by Nick Ackerman, co-produced by Stanford Chemist. This article was originally published to members of the CEF/ETF Income Laboratory on July 15th, 2022.
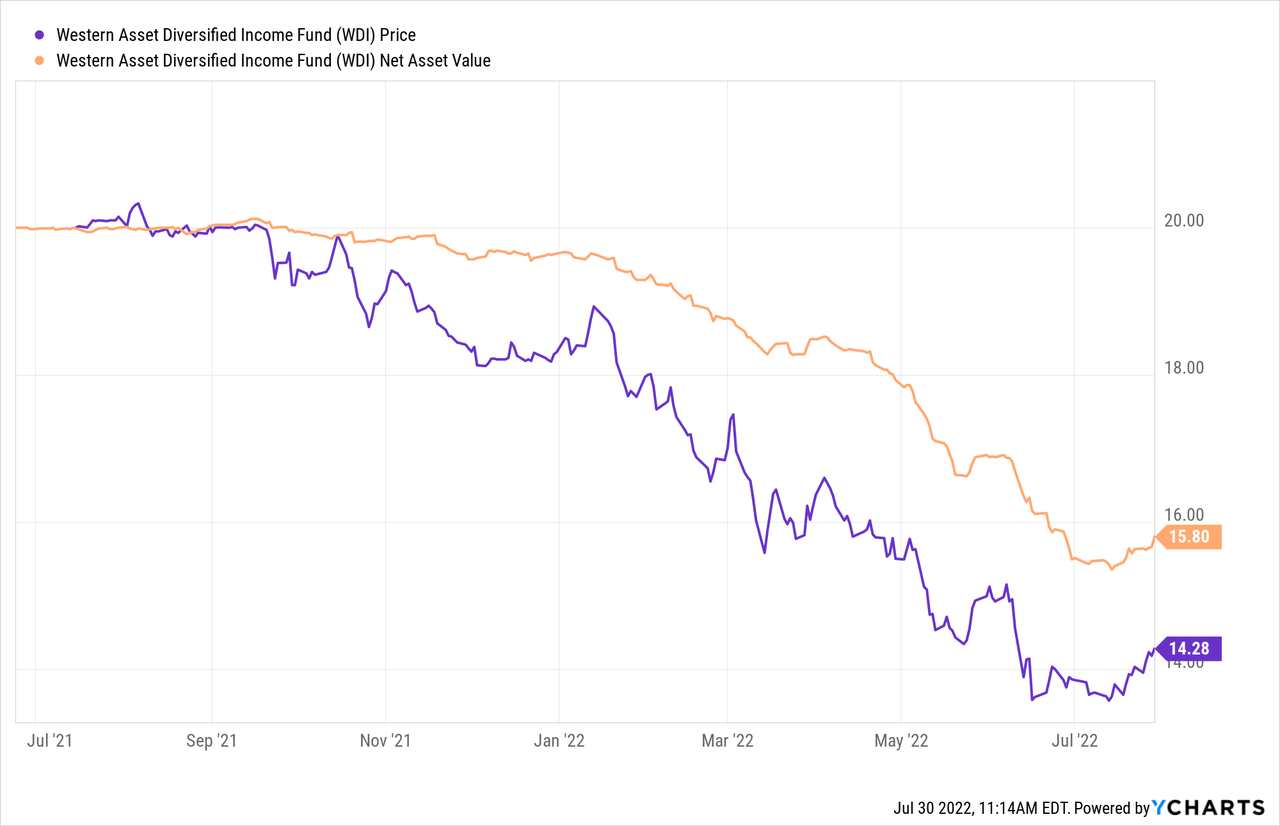
Western Asset Diversified Income Fund (NYSE:WDI) gets the award for being one of the worst-timed funds to launch when it did. It launched in June 2021, so we recently just celebrated its first anniversary. Although investors who invested in it around its launch are probably not celebrating but cursing the fund. For what it’s worth, some funds launched in 2007, which would have had an even worse trajectory.
Since then, the price and NAV have only gone in one direction: downward. Shortly after its launch, the Fed started to broadcast they would be raising rates sooner than expected. Then have subsequently begun increasing rates at a more rapid pace. The topic of poor timing for the launch is something we’ve discussed in our previous coverage.
However, the fund bumped up its monthly distribution a bit. That’s why I think it’s worth revisiting this fund today. This is a great reminder that the price of the underlying bonds and portfolio doesn’t equate to the amount of income being generated. This was a further reminder from WDI as PIMCO Dynamic Income Opportunities Fund (PDO) raised recently too.
All things being equal, the income is still coming in, and if they are invested opportunistically, it can result in even higher income. The fund is leveraged, so that’s worth pointing out that some of those benefits are lost due to higher leverage costs.
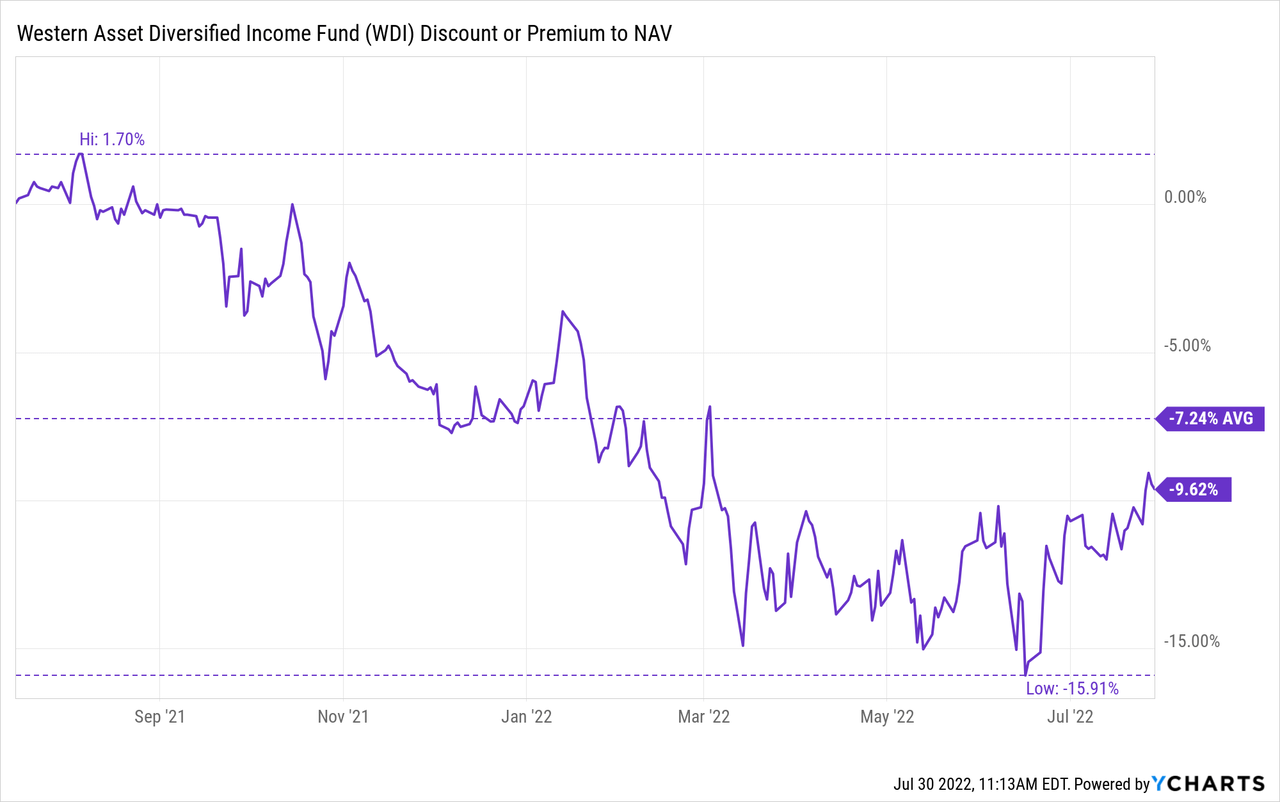
We can also see that the actual share price has fallen much more rapidly than the NAV, which is what has resulted in the fund’s deep discount.” In fact, at the time of writing, it has edged to a bit of an even wider discount. The deeper discount should mean further discount expansion could be limited. Additionally, the bump in the distribution signals at least some confidence from the managers.
The Basics
- 1-Year Z-score: -0.42
- Discount: 9.62%
- Distribution Yield:10.16%
- Expense Ratio: 1.48%
- Leverage: 31.76%
- Managed Assets: $1.2 billion
- Structure: Term (anticipated liquidation date June 24th, 2033)
WDI’s objective is “to seek high current income. As a secondary investment objective, the fund will seek capital appreciation.” They will bring a “flexible and dynamic” approach. They anticipate doing this by “rotating sectors and securities in response to market conditions, focusing on what we believe are undervalued securities with attractive fundamentals.
For greater flexibility, they have no restrictions on investing in investment-grade or below investment grade. Meaning that they will span the credit quality spectrum, leading to a truly multi-sector bond fund with limited constraints. This can be a positive if they can successfully manage it. It leaves investors a bit more in the dark and more reliant on the management team to operate the fund.
The fund’s leverage has been creeping up, but a large part of this appears to be that the underlying portfolio value is decreasing. While borrowings can stay the same, declines mean the leverage takes up a larger percentage of the managed assets. They pay at a spread above LIBOR but will be looking to transition to SOFR as LIBOR is discontinued.
To help offset some of the interest rate sensitivity, the fund participates in futures and interest rate swaps. When including leverage expenses, the expense ratio comes to 1.82%.
WDI Expenses and Fees (Western Asset)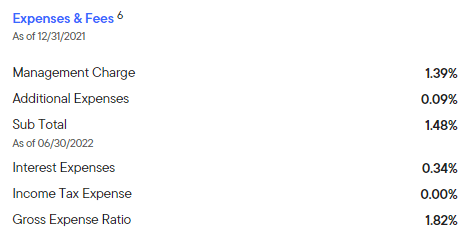
Performance – Discount Remains Deep
Another highlight in my previous article was that the fund was deeply discounted. This remains to be the case today, and further losses on the fund probably aren’t helping the fact. Of course, the fund isn’t alone in generating losses. It has declined a similar amount to the S&P 500.
WDI Performance (Seeking Alpha)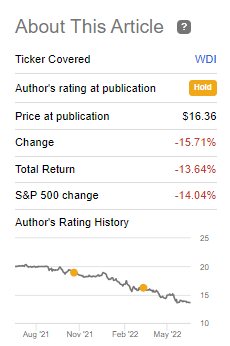
An equity index isn’t a great benchmark but gives us some context of how poor investments are doing across the board. Below is a YTD performance of total NAV and total price returns compared to PDO. I’ve also included the Vanguard Total Bond Fund (BND).
YCharts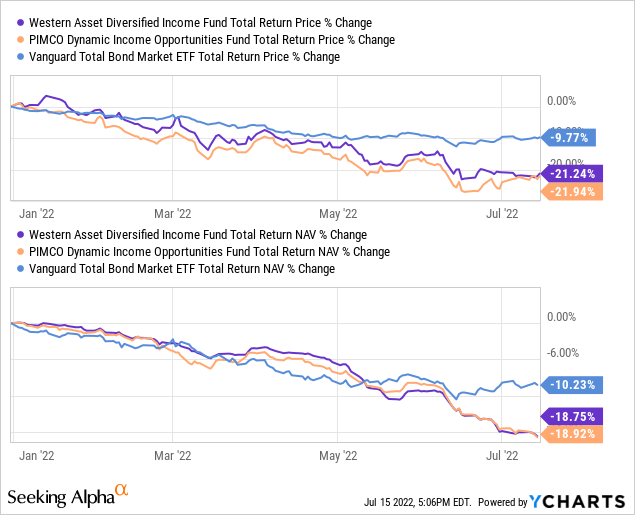
For the most part, WDI and PDO have been showing similar results. Even BND wasn’t a place to hide, which invests in almost all investment-grade quality bonds and U.S. Government issuances. It was only more recently that it began to show some defensiveness.
All this being said, the deep discount remains in place. It has bumped up a bit from where it was before but not materially. This seems to be a comfortable level that investors are allowing the fund to get to. For some brief periods, it has dipped lower. That being said, a further discount expansion for a meaningful period would seem limited beyond this level, given the trend.
Distribution – Small Bump
I keep reiterating the “small” part of the increase. It simply went from $0.117 a month to $0.12. Any increase at this time is encouraging. It helps give managers confidence that income should continue to flow in. The fund’s distribution yield has pushed into double-digits at 10.16%, with a NAV yield of 9.20%.
WDI Distribution History (CEFConnect)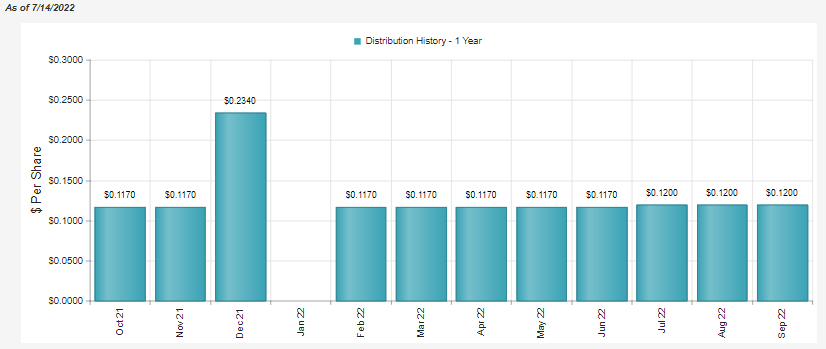
The fund doesn’t provide monthly UNII reports from what I could find. That being said, they do provide some quarterly updates. When looking at that, it is worth noting that they still listed $370 million in borrowings at the end of March 31st, 2022. So, an increase could have been between now and the end of June.
If they did increase their leverage, that could explain why they felt more comfortable increasing the distribution. In their last annual report, they reported that they could go up to $400 million in borrowings.
Additionally, from that period, we see only a small change in the total net investment income of the fund. It wasn’t even enough to change the per share NII figure. A small decrease or increase from quarter to quarter isn’t unsuspected and can do with the timing of payments. That’s why six months or a year is even better. In this case, it gets rid of that variability from quarter to quarter.
WDI Q1 NII (Western Asset)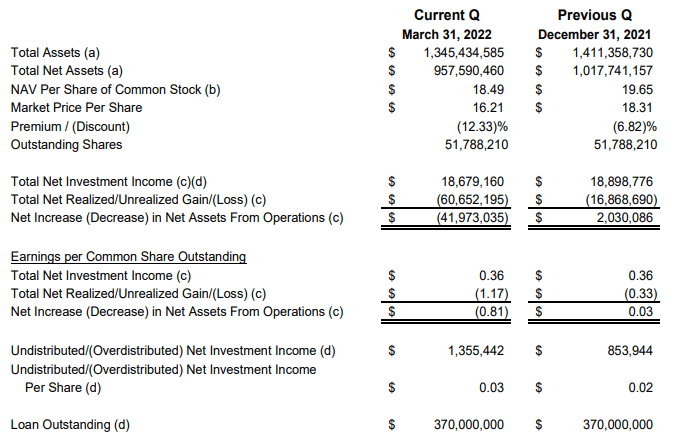
UNII has increased over the quarter, but realized and unrealized losses have been meaningful. That’s exactly what we see play out in the NAV of the fund, the underlying holdings declining in value.
For tax purposes, the entire distributions paid in 2021 were ordinary income. As a fixed-income fund, it would generally mean it is more appropriately held in a tax-sheltered account.
WDI Tax Character (Western Asset)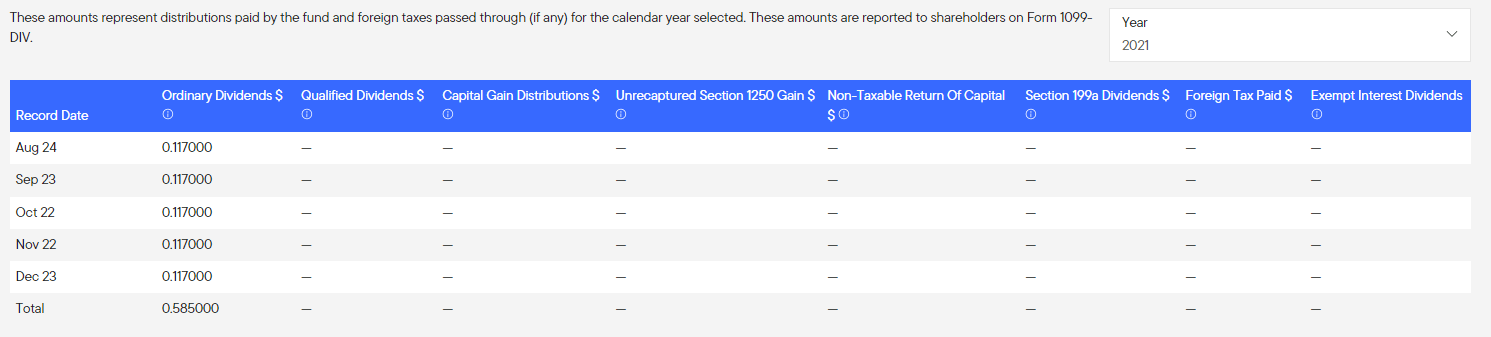
WDI’s Portfolio
As mentioned above, WDI has hedges against higher rates in place. One of these is from selling futures contracts.
WDI Futures Contracts (Western Asset)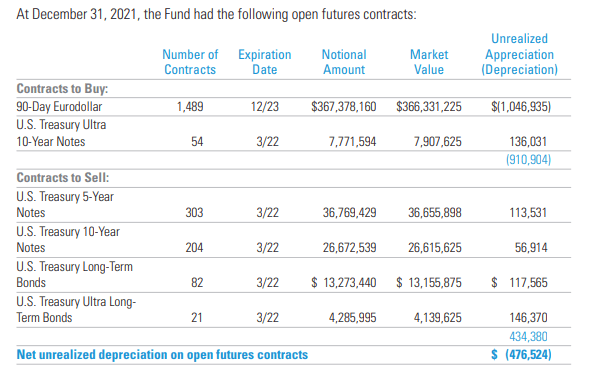
Most of these contracts have expired now, but they help give an investor an idea of how they could be positioned.
We also have interest rate swaps.
WDI Interest Rate Swaps (Western Asset)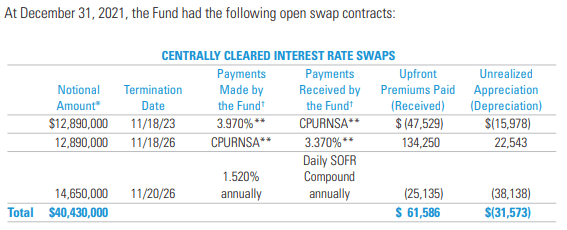
These are the sorts of portfolio positioning that I wouldn’t necessarily do in my own portfolio. That’s why having this type of exposure via WDI or the PIMCO funds can be beneficial.
To further protect from interest rate sensitivity, that’s where the fund’s flexibility can come in.
WDI Sector Exposure (Western Asset)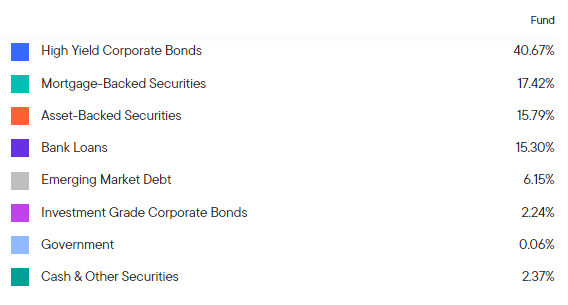
They are invested heaviest in high-yield corporate bonds. These often have shorter maturities relative to investment-grade bonds. However, the fund has some exposure there. Additionally, the fund’s exposure to bank loans would also be an offsetting factor for interest rate sensitivity. Bank loans are generally floating rate securities.
The fund’s effective duration is 3.23 years, with an average maturity of 7.04 years. The weighted average coupon for the fund is 6.64%. Adding leverage on top of that pushes us to be able to cover more of that 9.38% NAV rate.
However, going with a higher allocation to high-yield bonds means that the portfolio is rather risky. Credit risks are a real concern, with a potential economic slowdown as the Fed continues to hike rates. Thus, why we’ve seen a lot more declines in the underlying portfolio than I think we otherwise would. That is, above and beyond what we would on interest rate changes alone.
WDI Credit Quality (Western Asset)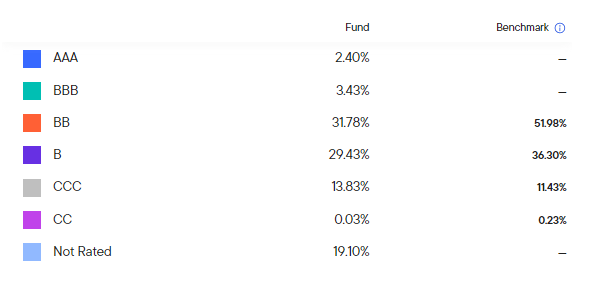
One way to counteract this risk is to invest in hundreds of positions. WDI does just that with 298 holdings. They also invest across various sectors, which further adds to diversification. Consumer cyclicals and energy make up the largest groups, which would arguably be some riskier and more unpredictable holdings.
WDI Sector Weightings (Western Asset)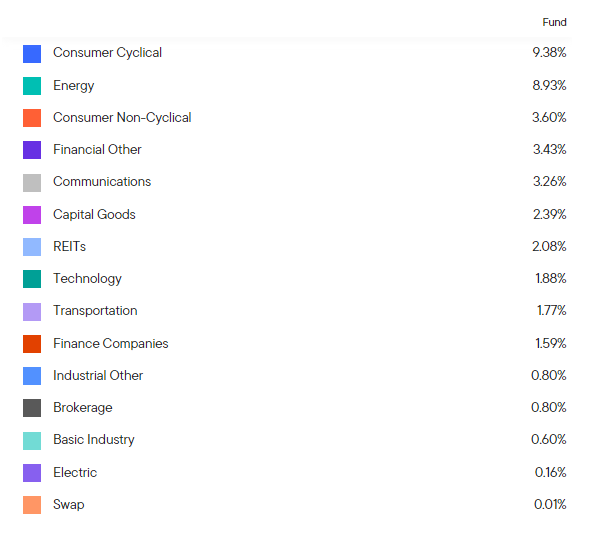
Conclusion
WDI recently upped its distribution. This isn’t the only multi-sector bond fund to do this recently, as PDO boosted their payout. In that case, their coverage was significant and was a larger increase. Despite that, this is yet another reminder that bond prices don’t change the income being generated. At least, not for fixed-rate investments, of course. There have been substantial declines in the prices of the underlying bonds, which is why the portfolio has declined meaningfully. On the other hand, the income has barely moved. If they are opportunistic in their investment approach, it could lead to better income generation down the road.
Be the first to comment