

imaginima
Kinder Morgan (NYSE:KMI) is a well-known pipeline stock that sports a huge 6.2% dividend. Like most oil stocks, it has beaten the market this year, but its 10% gain is not as good as what E&Ps are delivering. This year, Exxon (XOM) is up 45%, and the Energy Sector Select SPDR Fund (XLE) is up 31%. Compared to those returns, KMI’s 10% gain isn’t impressive, though it does represent vast outperformance of the S&P 500.
Other energy companies may not be the best comparison for KMI, as pipelines have a different business model from E&Ps. Pipelines “rent” their network to clients, who often pay for it even when they’re not using it. In this sense, their business model is similar to that of landlords, which is why many REIT investors like pipelines.
Still, there is a correlation between pipelines and other energy stocks. Many people who hold E&Ps also hold midstream stocks. There’s a case to be made for holding both. Pipelines are less sensitive to oil prices than E&Ps are, so they can help lessen the volatility of an energy investor’s portfolio.
If you’re interested in Kinder Morgan, you’re probably interested in the yield. Its stock isn’t known for huge price appreciation and Seeking Alpha Quant’s ‘D’ rating on growth doesn’t suggest that will change in the future. Past results don’t predict future results, but we’re talking 5.6% compound growth in free cash flow over 5 years, and negative growth in EBIT over the same period. This isn’t a growth stock by any standard, and therefore, the thesis largely revolves around how sustainable the dividend is.
In this article, I will explore the sustainability of KMI’s dividend, concluding that it is basically safe. I’ll also explore some factors that point to tepid capital gains, even if oil stocks as a whole perform well. Ultimately, I conclude that the stock is a ‘hold.’
KMI’s Dividend as it Stands Today
KMI is best known as a dividend stock with a very high yield. Therefore, it makes sense to analyze the stock in terms of the dividend, as the dividend is one of its main attractions.
Kinder Morgan pays a dividend of approximately $0.28 per quarter. That works out to $1.12 per year. At Friday’s closing price, we get a forward yield of 6.22%. That looks nice on paper, but is the dividend sustainable?
In a previous article, I covered Enbridge’s (ENB) dividend. Much like Kinder Morgan’s, its yield is very high: 6.18% on the date I wrote the article. However, I noted in my article on Enbridge that the stock’s payout ratio was a little high: 120% based on earnings, 69% based on cash flows.
Kinder Morgan is in a similar boat. It has a 101% payout ratio if you go by earnings, but only 49% if you use cash from operations (“CFO”). KMI’s payout ratio is lower than ENB’s based on both earnings and operating cash flows. In fact, KMI’s CFO payout ratio is rather low for a pipeline, though its free cash flow (“FCF”) payout ratio is even higher than the earnings payout ratio.
Why is KMI’s payout ratio so high when its operations produce more than enough cash to pay the dividend?
It comes down to investments. Pipelines generally spend a lot of money on infrastructure upgrades, and Kinder Morgan is no exception. KMI had $3.06 billion in capital expenditures (“CAPEX”) in the last 12 months, which knocks the $5.045 billion in CFO down to $1.985 in unlevered FCF. Take out financing expenses and you’re down to $1.014 billion in levered FCF.
To really know whether Kinder Morgan’s dividend is sustainable, we need to know what it’s spending so much money on. Sometimes, capital expenditures create new revenue streams and boost profits, other times, they’re just made because regulators require them. So, we need to construct a model for Kinder Morgan to see whether its dividend can be paid in the future.
Q2 Earnings
The first step in building a model for KMI is to look at its most recent earnings. The company released just last week, so we have some up-to-date information on how it’s doing in 2022.
In Q2, KMI delivered:
- $5.15 billion in revenue, up 63.5%.
- $1 billion in operating income, up from a loss.
- $653 million in net income, up from a loss.
- $1.176 billion in distributable cash flow, about $540 million greater than common share dividends paid.
So, the quarter showed strong growth and a dividend that’s sustainable based on cash flows. The trends look good, and the results beat on the top line. Having established that, we can move on to modelling the income statement.
Income Statement
Modelling Kinder Morgan’s income statement starts with revenue. There are two approaches we could take to this: top down and bottom up. Top down starts with macro factors (e.g. GDP growth) and works down to the company. Bottom up starts with company segments and moves up from there.
Kinder Morgan’s businesses generally have long-term contracts, so it’s unlikely that its revenue will fluctuate much with GDP. Therefore, a bottom up approach is most suitable for this company.
Here’s what we know about KMI’s segments:
-
Nat gas pipelines have an average contract length of six years remaining.
-
The terminals business has been known to sign 10-year contracts.
-
A crude pipeline contract template on the company’s website is for 12 years.
-
Recent CO2 contracts have a weighted average term of 16 years.
It appears that KMI’s contracts are usually for 10 years or longer, so it’s safe to say the company’s revenue will be stable for the next 5 years. On top of that, there is always the possibility for growth by acquiring assets, raising tolls, or doing more volume. We should therefore model some positive growth in revenue. It wouldn’t be conservative to assume that the past year’s 22% growth will continue, but the five-year compound growth rate of 5.5% looks sensible. So, we’ll use that growth rate in our model.
Next up, we have cost of goods sold (“COGS”). This tends to increase directly in proportion to revenue. According to GuruFocus, Kinder Morgan’s COGS-to-revenue ratio is 0.63. Rather than estimating a growth rate in COGS, I’ll use this ratio for each year in the model.
Next, we have operating expenses. As the image below shows, this has been pretty much flat for the last five years. There is no specific reason to think that operating costs will rise with income like COGS does. So, in our model, we can assume this cost category stays fixed at $3.2 billion per year.
KMI operating income (Seeking Alpha Quant)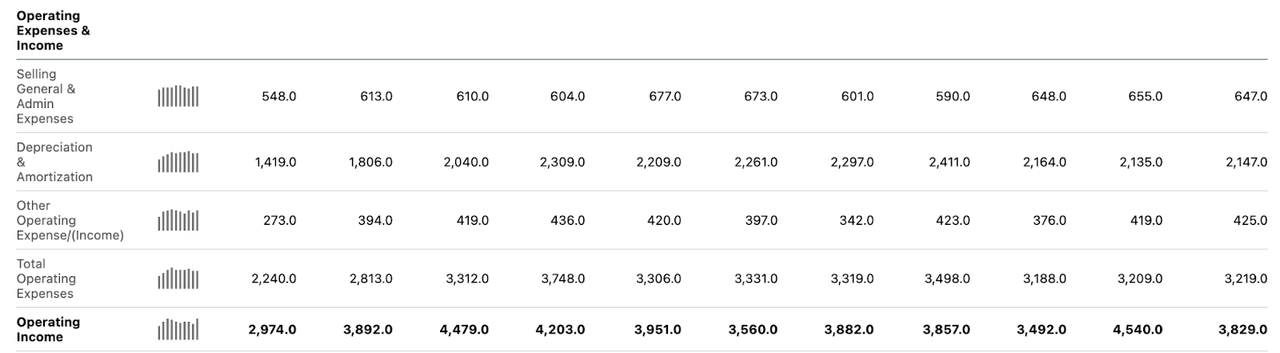
Finally, we have interest and taxes. Kinder Morgan is in the process of reducing its debt, in the most recent quarter, it reduced net debt by 0.59%. Given that KMI has enough earnings coming into repay debt, we should expect this to continue. Therefore, I’ll assume that interest expenses decrease by 0.59% per year. I’ll likewise use the historical tax rate (15.6%) as the estimated future tax rate.
Balance Sheet and Cash Flows
It’s worth looking at where KMI’s balance sheet and cash flow statement will go in the years ahead. My model will use earnings instead of cash because KMI’s heavy capital investments reduce FCF to a level that doesn’t reflect day-to-day operations. However, it’s still worth making a few observations about the balance sheet and cash flow statement:
-
KMI has been retiring debt and growing earnings, so its returns on invested capital should rise over time.
-
KMI’s assets are also declining, resulting in lower equity. Therefore, the debt-to-equity ratio isn’t necessarily improving.
-
The company’s cash from operations (“CFO”) has been trending upward long term but is volatile.
-
The company’s FCF is always dramatically lower than CFO due to heavy capital expenditures. Kinder Morgan says that CAPEX is largely being invested into expansion projects, so today’s spending may increase earnings and FCF in the future.
Valuation
Having looked at the basic pieces of KMI’s business, we can now proceed to a model. Based on the growth rates I estimated above, we get this income statement model for Kinder Morgan:
|
Base year |
Year 1 |
Year 2 |
Year 3 |
Year 4 |
Year 5 |
|
|
Revenue |
$17.56B |
$18.52B |
$19.54B |
$20.62B |
$21.75B |
$22.95B |
|
COGS |
$10.6B |
$11.66B |
$12.31B |
$12.99B |
$13.70B |
$14.45B |
|
Operating cost |
$3.2B |
$3.2B |
$3.2B |
$3.2B |
$3.2B |
$3.2B |
|
Interest |
$1.426B |
$1.417B |
$1.408B |
$1.40B |
$1.392B |
$1.383B |
|
Non-cash gains/costs |
$801 gain |
N/A |
N/A |
N/A |
N/A |
N/A |
|
Pre-tax income |
$3.135B |
$2.243B |
$2.63B |
$3.03B |
$3.45B |
$3.91B |
|
Tax |
$633M |
$349M |
$410M |
$472M |
$539M |
$611M |
|
Net income |
$2.4B |
$1.894B |
$2.2B |
$2.5B |
$2.9B |
$3.3B |
One thing to note about this model: I didn’t factor in non-cash items like depreciation or investment gains. These factors provided a net gain in the base year, so my model shows a brief decline in earnings in years 1-2. In reality, the company could keep making gains on investments, and exceed my forecast. But it wouldn’t be conservative to model for that, so I will stick with this model.
At any rate, we get a $3.3 billion after-tax profit in year 5. In the last 12 months, KMI paid $2.5 billion in common share dividends, so this year’s dividend would be fully covered by earnings after five years. That might not sound great but remember that KMI’s dividend is already covered by operating cash flows. The earnings-based payout ratio is high, but it should come down even if we assume only very modest growth from the company.
We can also do a discounted cash flow valuation based on the earnings forecast above. Using $3.3 billion as a terminal cash flow, and assuming no growth after that, we get to $1.45 in diluted EPS after 5 years. Using this year’s $1.07 at a starting point, we get 6.3% CAGR earnings growth over the forecast period. Using Kinder Morgan’s 5.66% Weighted Average Cost of Capital as the discount rate, we get a fair value of $24.93. That’s a decent upside to today’s price, and of course, anybody investing today could boost their returns by reinvesting their dividend.
One Big Risk to Watch Out For
As I’ve shown so far, Kinder Morgan’s dividend is fairly safe, and its stock has a little bit of potential upside. Overall, it looks like a solid defensive pick. However, there is one risk for anybody who invests in KMI to watch out for:
Spending.
Kinder Morgan does about $3 billion worth of capital expenditure every year, an amount that is far greater than net income. Lately, the company has been reducing its debt even with all of these expenditures, but there’s no guarantee that that will be the case forever. If the company encounters a hiccup in its operations, then it will have to borrow to keep the spending going. In that scenario, its interest expense would increase a lot, because interest rates are rising this year. KMI’s management says that this year’s spending will expand the company, but you can never be 100% certain that any investment will pay off. So, it pays to watch this company’s expenses very closely. They don’t wreck the thesis on the stock, but they are worth thinking about. For me, they’re a big enough concern to make the stock a ‘hold’ rather than a buy.
Be the first to comment