

Olemedia
Software companies have come under fire later for a lack of profitability, with some comparing the SaaS business model to shale oil production. In particular, stock-based compensation is a point of contention, which some have suggested is used to hide poor economics. While many software companies are unprofitable, accounting statements are not gospel, and investors must try and understand what a business will look like in the future, not just what it looked like in the past. There are a number of rules of thumb which investors can use as a guide when comparing companies, but it can be difficult to move from an abstract rule of thumb to an estimate of profitability for valuation purposes. Ideally the unit economics of a business would be used to assess how a company’s finances will change over time, but this is difficult with publicly available information. Capitalizing a portion of a company’s operating expenses, to reflect the fact that they are an investment in future growth, and amortizing those expenses over time can provide more insight into the underlying economics.
Rules of Thumb
There are a number of rules of thumb which are used to benchmark software companies. Each has its own strengths and weaknesses, but they generally show a similar trend.
Contribution Margin
Contribution margin shows how a dollar of incremental revenue growth contributes to profitability. An incremental dollar of revenue should improve profits, so this figure should generally be positive. It is likely to be noisy though. The magnitude of the contribution margin will also generally depend on the size and growth rate of the company, and how quickly those are changing. It is therefore not really clear what a good contribution margin is.
Equation 1: Contribution Margin (source: Created by author) Figure 1: Salesforce Contribution Margin (source: Created by author using data from Salesforce)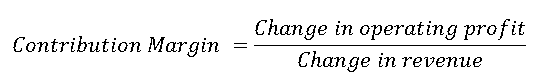
Magic Number
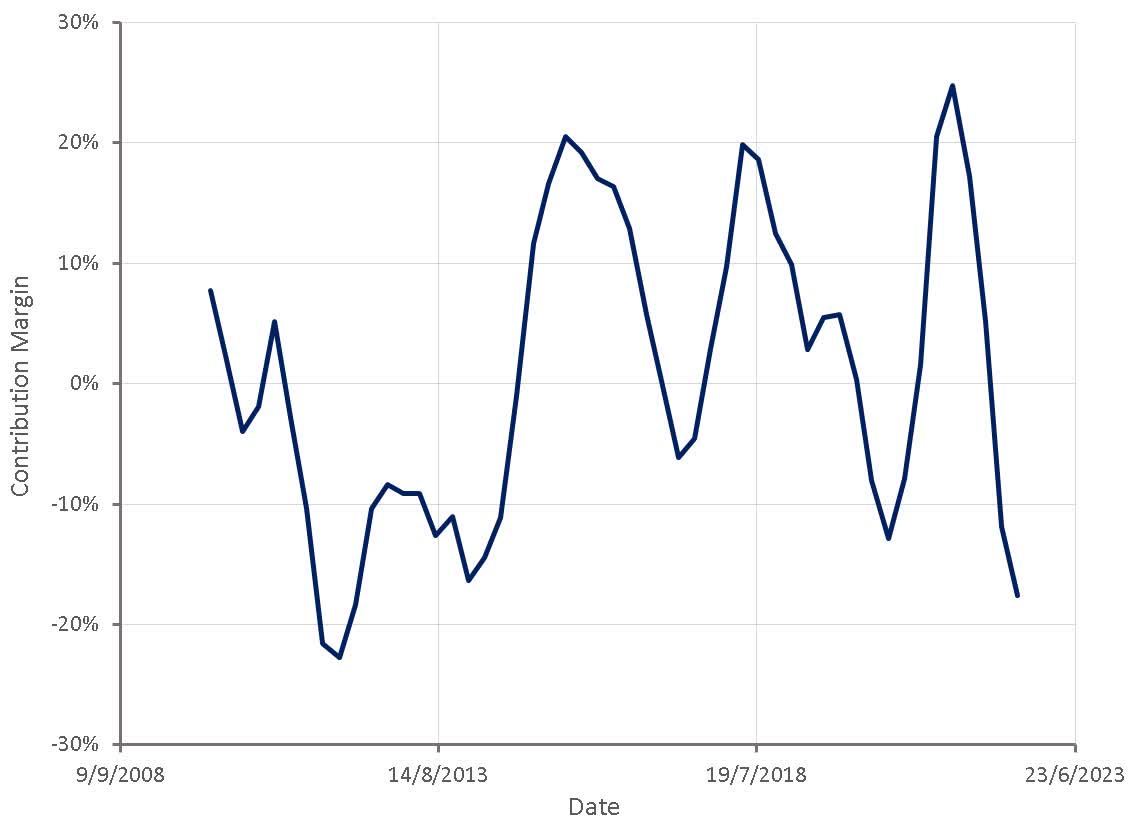
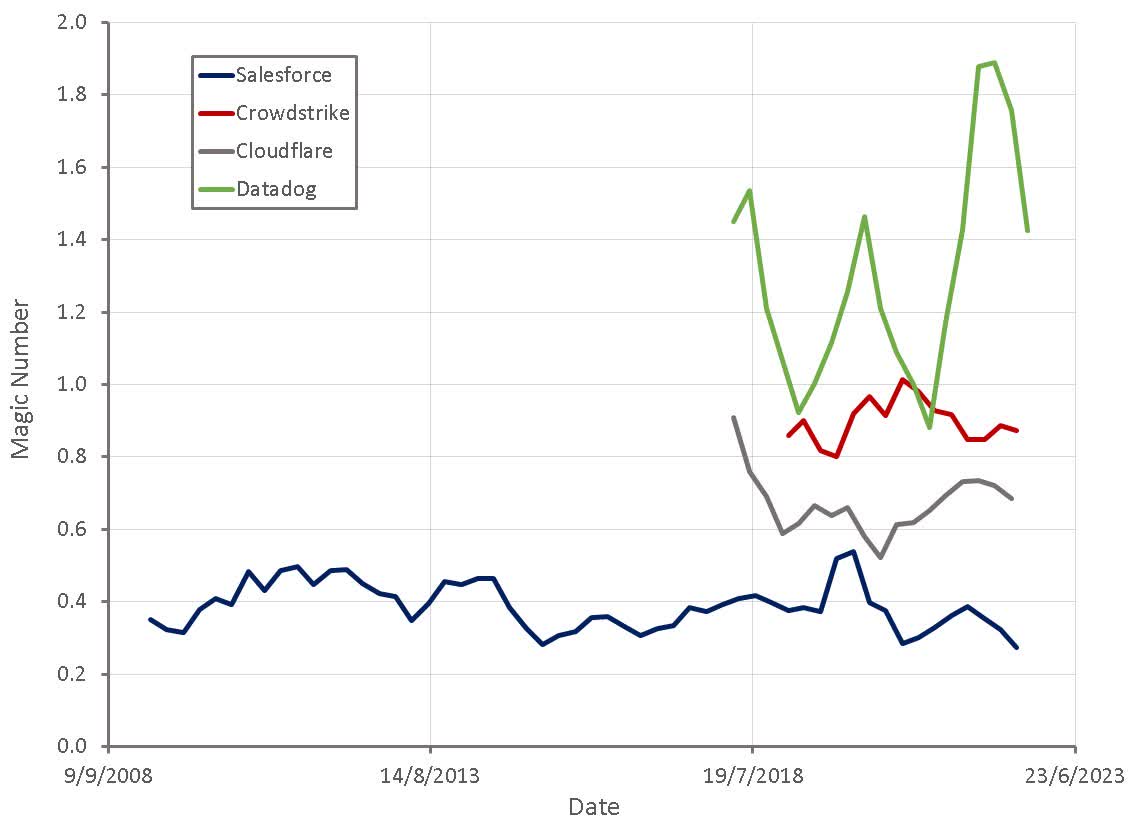
The magic number is a measure of sales efficiency. It is generally calculated using revenue, although gross profit is likely to give a better picture of a business’s performance. The magic number does not consider R&D or general and administrative expenses, and so may be misleading. The magic number may be skewed by companies that have extremely high expansion rates, particularly if there is little effort directed towards acquiring new customers.
The magic number is more relevant for fast growing companies, and becomes less relevant as growth trends towards zero. It is also more focused on customer acquisition than customer retention. A small and rapidly growing company may have a high magic number even if it has a customer retention problem. In this case sales and marketing expenses will remain high, even as growth slows.
Equation 1: Magic Number (source: Created by author) Figure 2: Example Magic Numbers (source: Created by author using data from company reports)
Rule of 40
The rule of 40 states that companies should aim for their growth rate plus profit margin to exceed 40. The rule of 40 combines two different units, leaving a number that is difficult to interpret, but it is generally a reasonable indicator of performance. This is because growth and profits are often highly correlated.
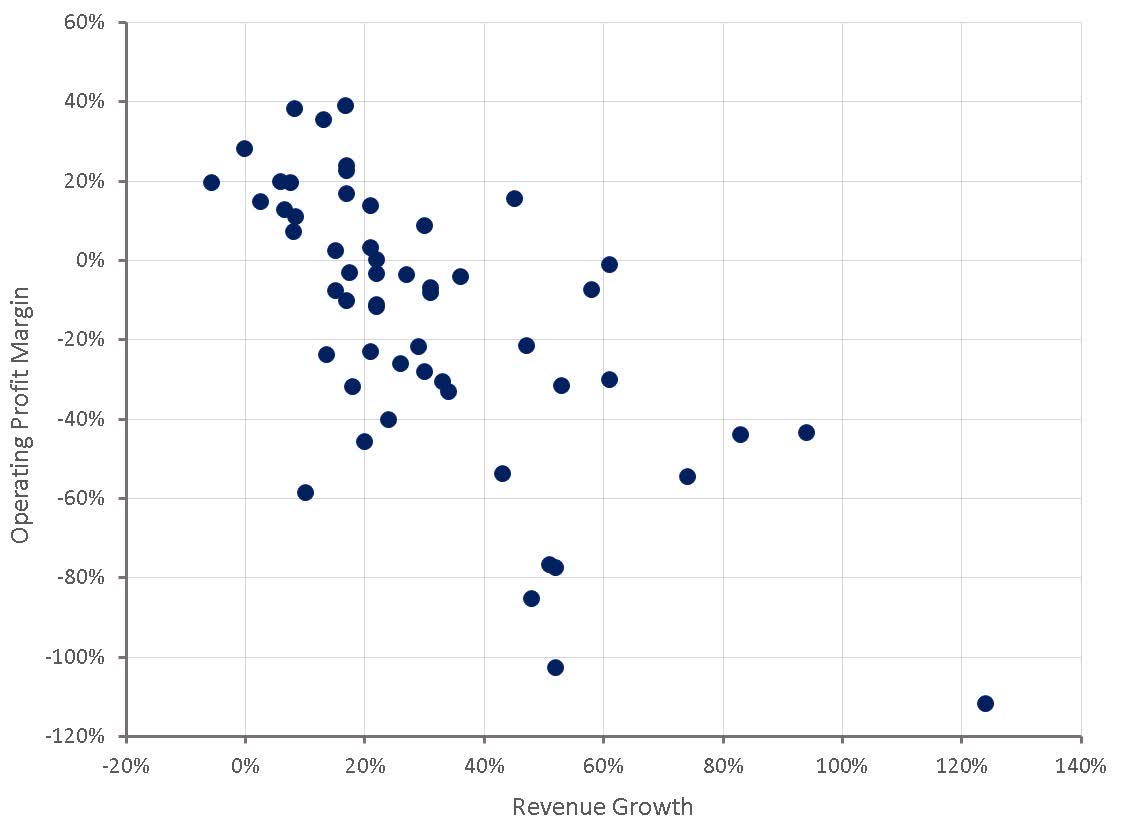
The rule of 40 does not consider the size of a company, and hence smaller companies may look artificially bad if they are operating below the optimal scale. It also does not consider what is driving costs. For example, a company with a platform that addresses a large number of use cases may invest heavily in R&D. This would be desirable if customer acquisition costs are reasonable and retention rates are high. The rule of 40 may deem that this company is a poor performer though.
Equation 3: Rule of 40 (source: Created by author) Figure 3: Revenue Growth and Operating Profit Margins for a Range of Public Software Companies (source: Created by author using data from company reports)
The rule of 40 is less useful when growth and profits are not highly correlated. This is the case for Datadog (DDOG), which relies on bottom-up adoption and product led growth. Datadog’s rule of 40 number will continue to decline as growth moderates, but this does not imply there is anything wrong with the company.
Figure 4: Datadog Rule of 40 (source: Created by author using data from Datadog)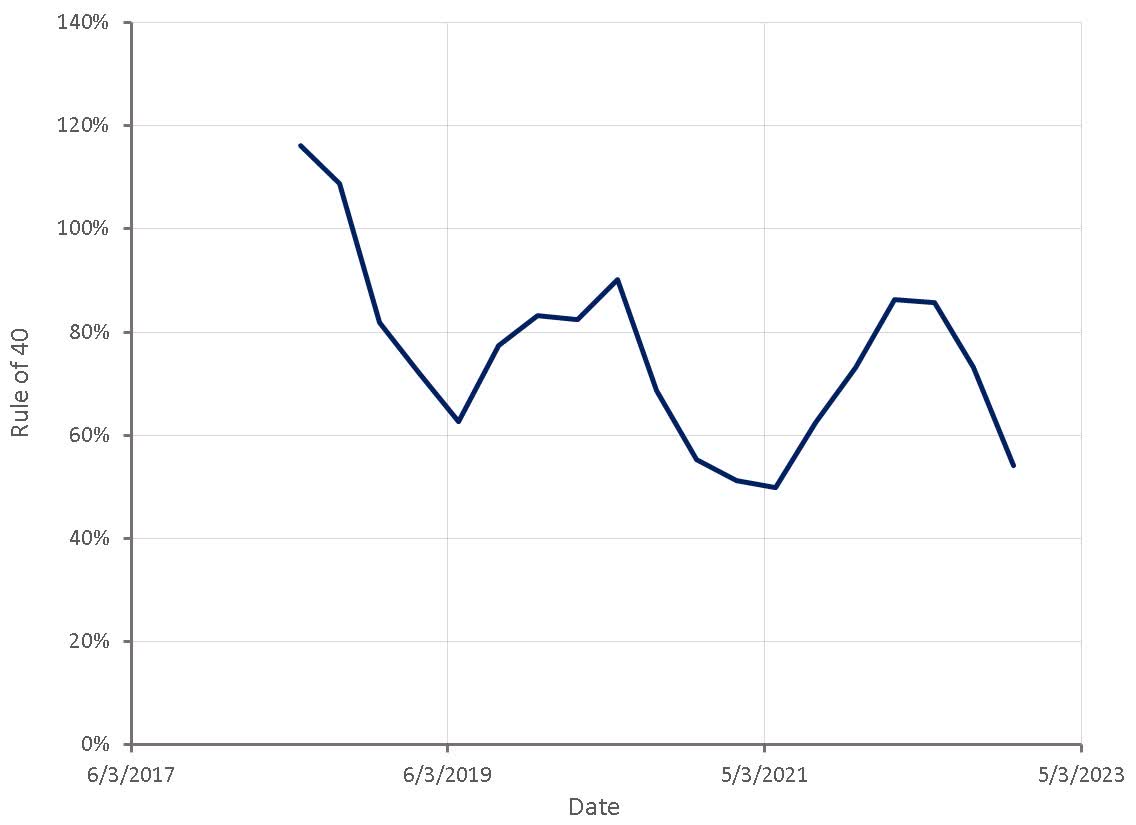
Obviously, it is desirable for R&D and sales and marketing investments to drive revenue growth, but there should be some caution if revenue growth is highly correlated with sales and marketing expenditures. If growth is driven primarily by sales and marketing, then the return on those investments must be sufficient or the business fundamentally does not work. If the correlation between sales and marketing expenses and growth is weak, then sales and marketing may be inefficient or the business may be creating growth through other means.
LTV/CAC
The lifetime value of a company’s customers relative to their acquisition costs should give a reasonable picture of unit economics at the customer level, although it ay not be possible to calculate accurately with publicly available information (churn, expansion, customer acquisition costs). Even if this information is available, the estimate will be a blended average across the customer base. Ideally companies would segment their customer base (government, enterprise, SMB, etc.) and calculate LTV/CAC for each segment.
LTV/CAC considers both customer acquisition and retention, and hence should be a reasonable indicator of the burden of sales and marketing expenses for a mature company. It should be noted that churn can change over time as the competitive environment evolves and acquisition costs will potentially rise as a company begins to saturate its core market.
Figure 5: Crowdstrike and SentinelOne Estimated LTV/CAC Ratios (source: Created by author using data from company reports)
Incremental Asset Turnover
Incremental asset turnover compares the change in revenue with the change in assets used to generate that revenue. For software companies, it is better to exclude cash and cash equivalents as they contribute little to the business and include capitalized operating expenses (intangible assets) as these are the primary growth drivers. Incremental asset turnover is a measure of return on investment rather than a measure of profitability. For a company that has high gross profit margins and high R&D / sales and marketing expenses, it should be indicative of profitability though.
Equation 4: Incremental Asset Turnover (source: Created by author)
Crowdstrike’s (CRWD) incremental asset turnover has generally been high and greater than its asset turnover, except when acquisitions resulted in a large increase in goodwill on the balance sheet. This indicates that Crowdstrike’s operating expenses (investments) are efficiently driving growth and current losses should not be a concern for investors.
Figure 6: Crowdstrike Incremental Asset Turnover (source: Created by author using data from Crowdstrike)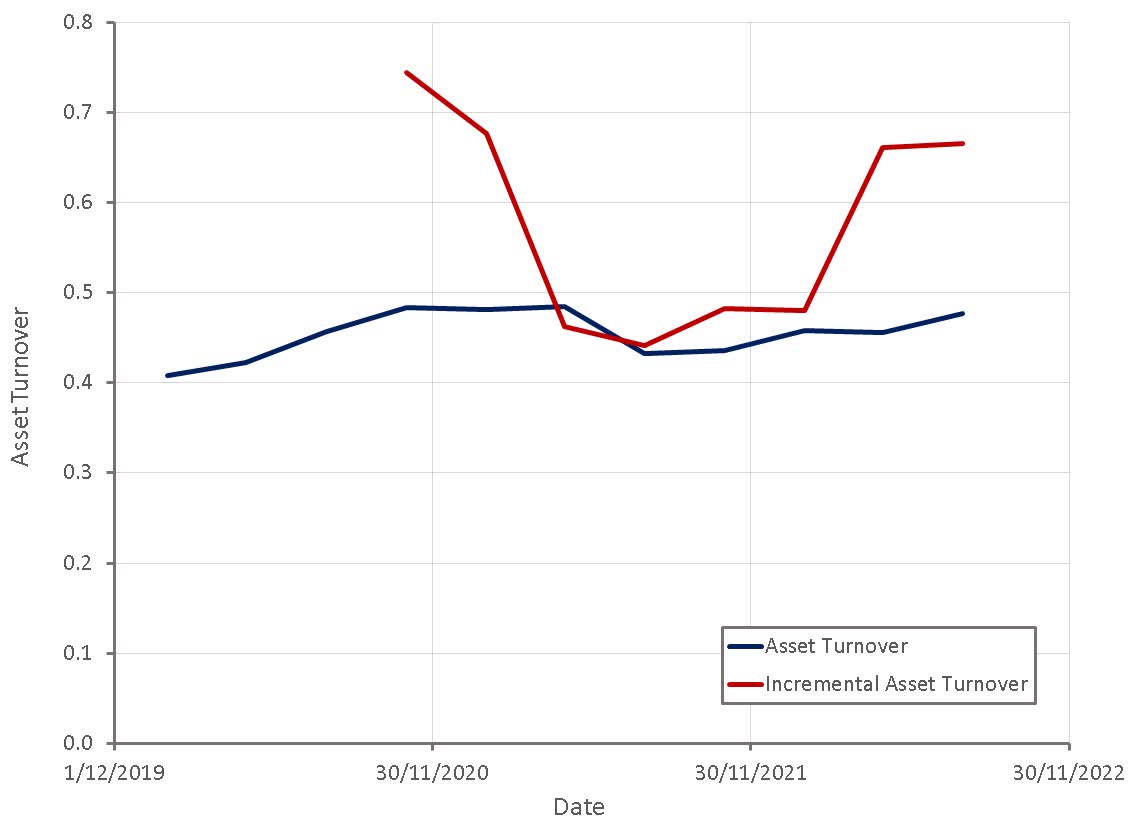
Investment versus Expense
Capitalizing operating expenses is a subjective process, which is why accounting standards generally do not allow it to be done. From an investor’s perspective, this ignores the fundamental reality of intangible driven businesses, like software. It is an even more subjective process when companies provide little information on the nature of their expenses.
The importance of treating operating expenses properly is elucidated by comparing a company with a preference for internal development with one that pursues an M&A strategy. Neither approach is inherently superior, but the internal development strategy will temporarily depress margins and elevate asset turnover when compared to the M&A strategy. Salesforce (CRM) has historically invested little in R&D and made a large number of acquisitions. As a result, their business has not had the accounting losses of some of their peers and their asset turnover has trended downwards over time. While Salesforce’s asset turnover is low relative to many software peers, it is not necessarily bad, it just reflects intangible investments that are missing from the balance sheet of peers.
Figure 7: Salesforce Asset Turnover (source: Created by author using data from Salesforce)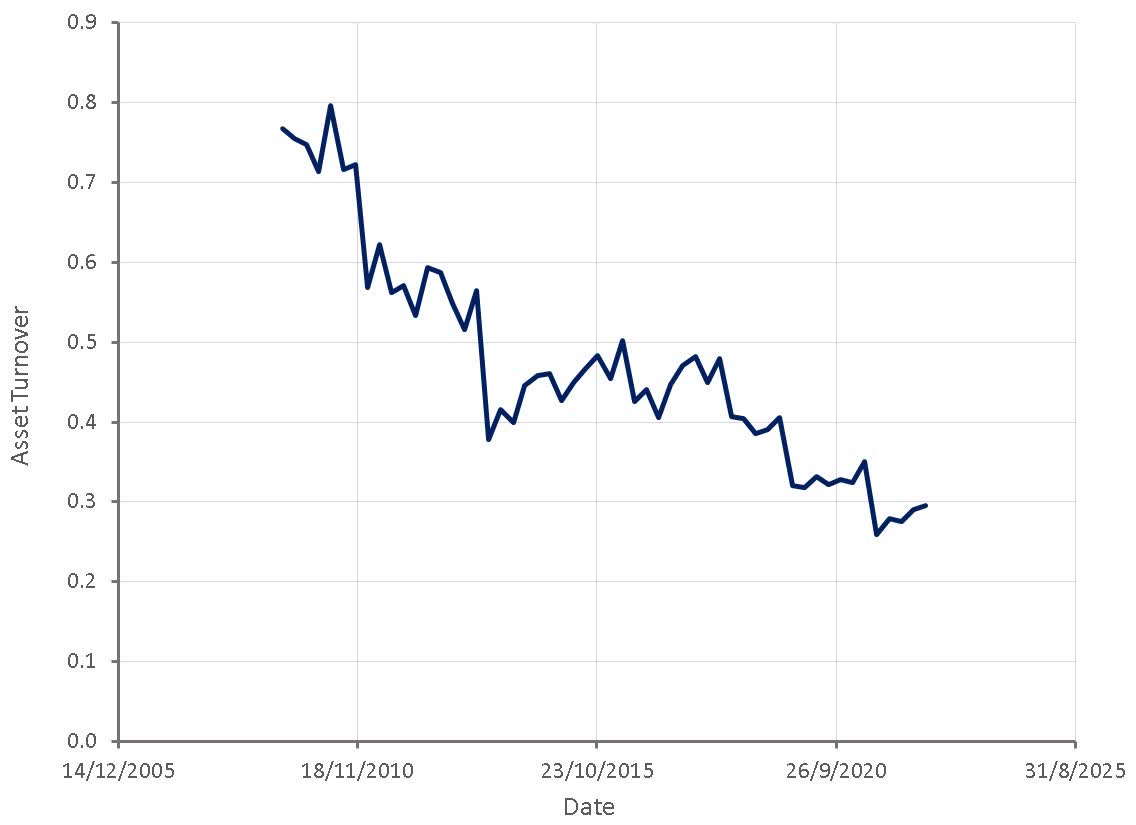
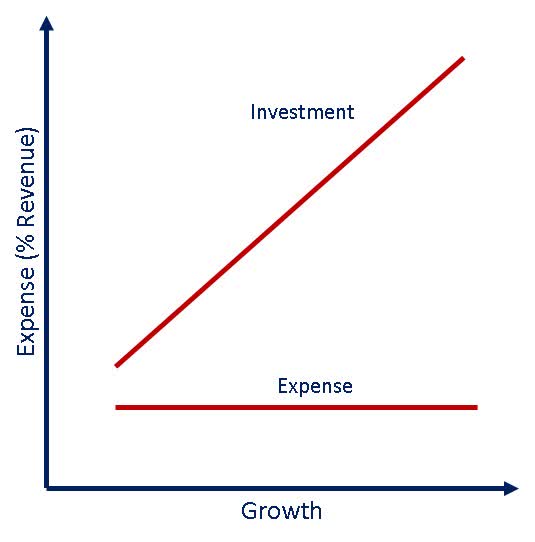
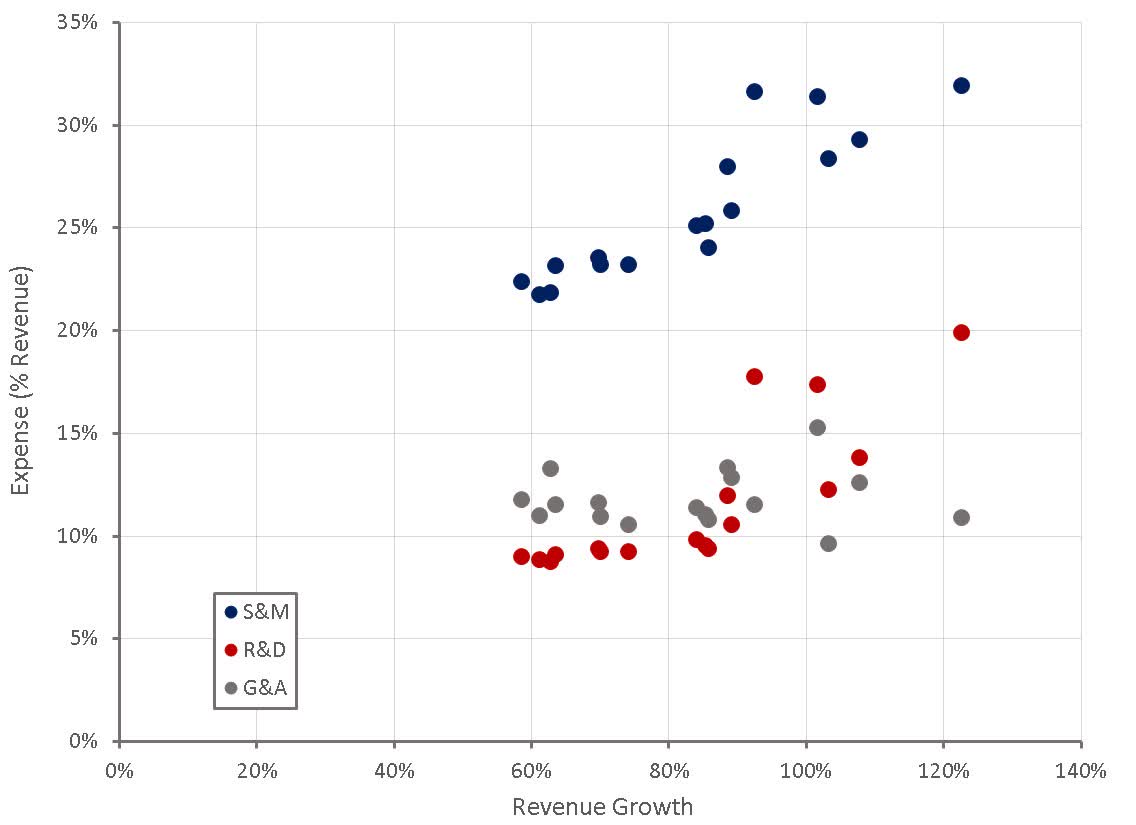
The dependence of operating expenses (relative to revenue) on a company’s growth and scale potentially hints at their nature and can guide their treatment. If an operating expense is fairly independent of growth and scale, it is more likely to be an actual expense. If an operating expense is highly correlated with growth and / or scale, it is more likely to be an investment.
Figure 8: Dependence of Operating Expenses on Scale (source: Created by author) Figure 9: Dependence of Operating Expenses on Growth (source: Created by author)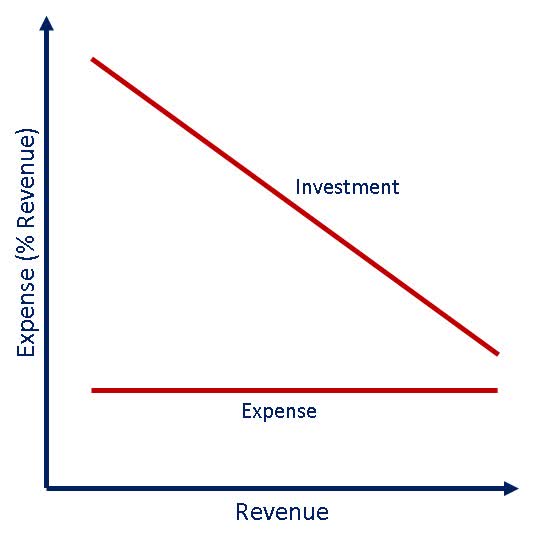
Growth and Scale Adjusted Profit Margin
To understand what a company’s margins are likely to be at maturity, its current margins must be adjusted for growth and size. This can be done by capitalizing a portion of operating expenses and adjusting for economies of scale. This is highly subjective, particularly with publicly available information, but asset turnover (including capitalized intangibles) and the variation of operating expenses with growth and scale provide a sanity check.
Given the difficulty of doing this with public information, a regression of profit margins against growth and revenue could also be performed. This will not always work though, For example, Datadog’s profit margins have generally been independent of growth and scale.
Figure 10: Salesforce Adjusted Operating Profit Margins (source: Created by author using data from Salesforce)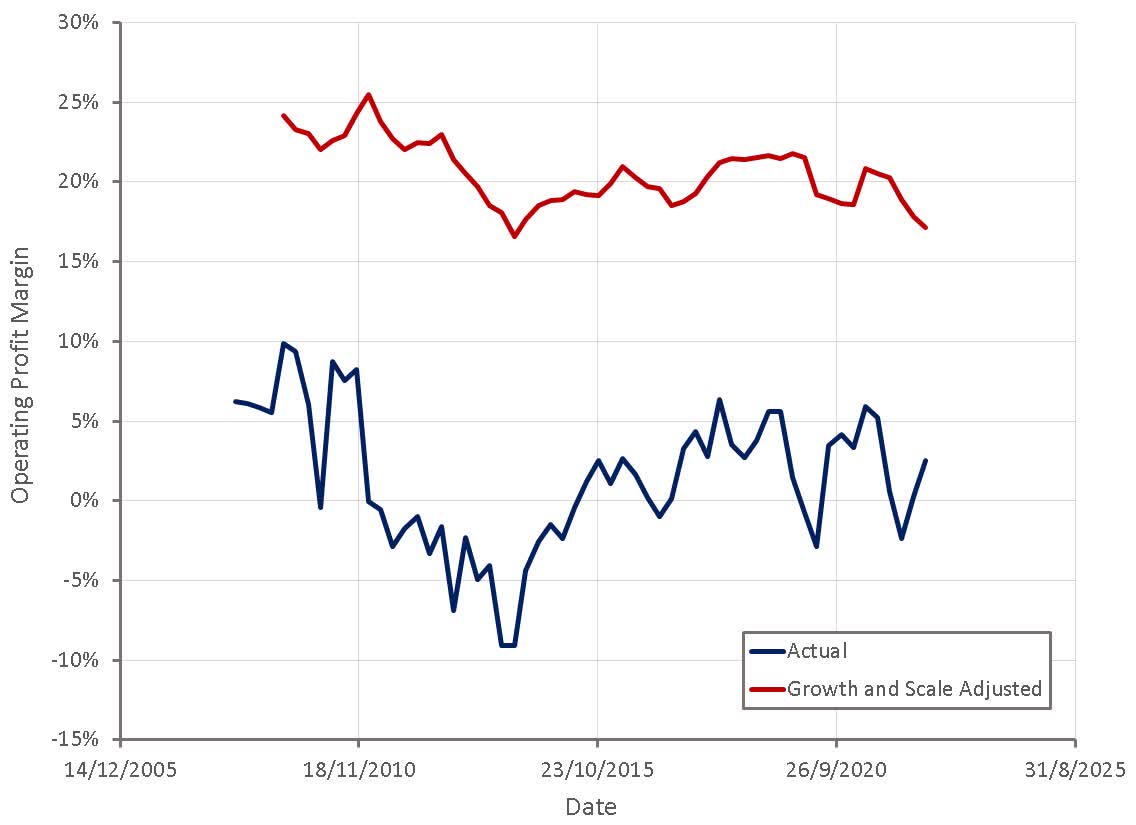
Crowdstrike’s estimated adjusted operating profit margins have generally been around 30% since their gross profit margins stabilized. This is a relatively high figure, and is a function of their efficient sales model and high customer retention. As the business matures, the burden of general and administrative costs should decline and R&D investments should moderate, leaving a highly profitable business.
Figure 11: Crowdstrike Adjusted Operating Profit Margins (source: Created by author using data from Crowdstrike)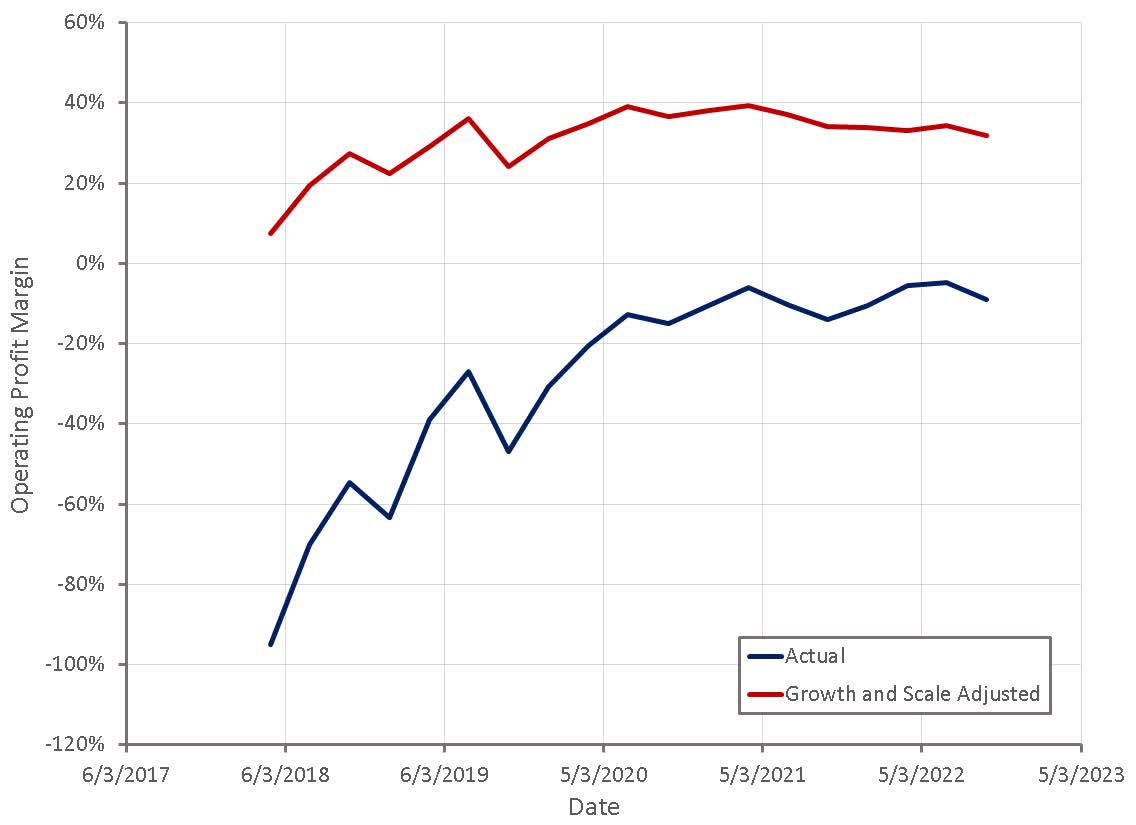
Crowdstrike’s asset turnover (including capitalized intangible investments) has generally been increasing over time, although has been impacted by large acquisitions. This could mean that Crowdstrike is improving the utilization of its assets over time, that an insufficient amount of operating expenses are being capitalized or that intangible assets are being amortized too quickly.
Figure 12: Crowdstrike Asset Turnover (source: Created by author using data from Crowdstrike)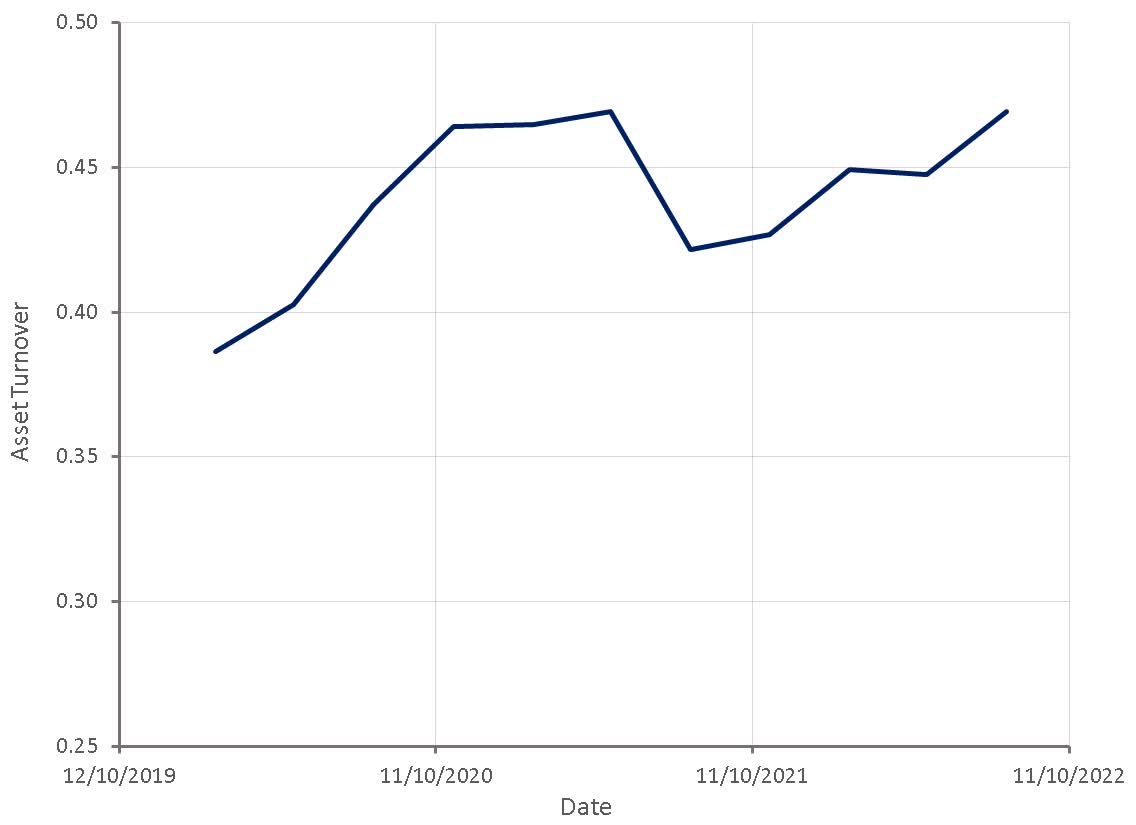
Comparing operating expenses after capitalization and amortization can also indicate whether they are being treated properly. Crowdstrike’s sales and marketing expenses are still somewhat dependent on scale and growth, which could mean that an insufficient amount is being capitalized, or they are being amortized too quickly. Given Crowdstrike’s high gross retention rate it may make sense to amortize sales and marketing expenses slowly.
Figure 13: Dependence of Crowdstrike’s Operating Expenses on Scale After Capitalization (source: Created by author using data from Corwdstrike) Figure 14: Dependence of Crowdstrike’s Operating Expenses on Growth After Capitalization (source: Created by author using data from Crowdstrike)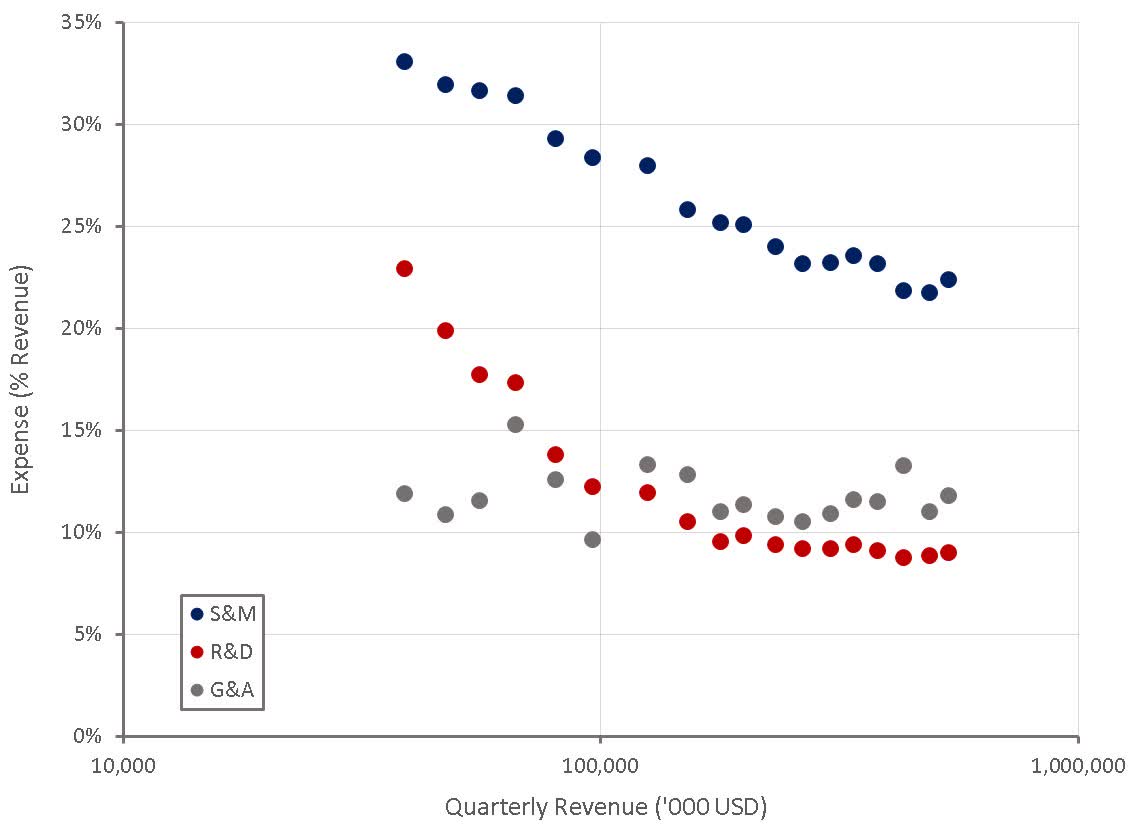
LTV/CAC and Profits at Maturity
The correlation between LTV/CAC ratios and estimated operating profit margins is high. This is expected, as at maturity R&D and general administrative expenses should generally be low. Margins are therefore driven by the burden of sales and marketing, which is low when customer acquisition costs are low and retention is high.
This depends on whether the company can maintain its competitive position and whether the business is managed efficiently. General and administrative costs may remain high if the business is poorly managed and R&D costs may remain high if the company loses its competitive advantage or pursues growth in new markets. Some businesses will also inherently have greater R&D requirements due to the nature of the product.
Figure 15: LTV/CAC and Estimated Operating Profit Margins at Maturity (source: Created by author using data from company reports)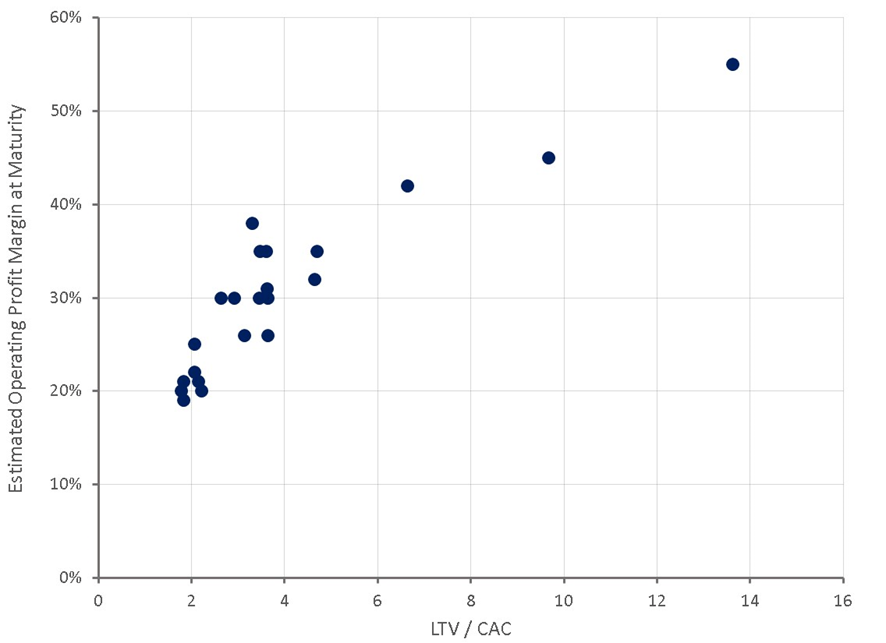
Conclusion
While it is never desirable for a company to lose money, not all losses are the same. If a company has a subscription product with high gross profit margins, low customer acquisition costs and low churn, it may be desirable to invest aggressively in growth, particularly if there is a first mover advantage.
The period of losses should ideally be short though and the target market should be large with the potential for sustainable returns above the cost of capital. The company must also have a sustainable competitive advantage, or the business’ unit economics may deteriorate before shareholders can benefit.
Be the first to comment