

borchee/E+ via Getty Images
Introduction
When last discussing MPLX (NYSE:MPLX) back in 2022, my previous article foresaw that higher distributions were only months away and much to the pleasure of unitholders like myself, they subsequently followed up with an impressive 10% distribution increase. Not many high-yielding investments deliver an increase of this magnitude without hindering their growth outlook but thankfully, it still seems that both roads lead to higher distributions in the years ahead.
Coverage Summary & Ratings
Since many readers are likely short on time, the table below provides a brief summary and ratings for the primary criteria assessed. If interested, this Google Document provides information regarding my rating system and importantly, links to my library of equivalent analyses that share a comparable approach to enhance cross-investment comparability.
Author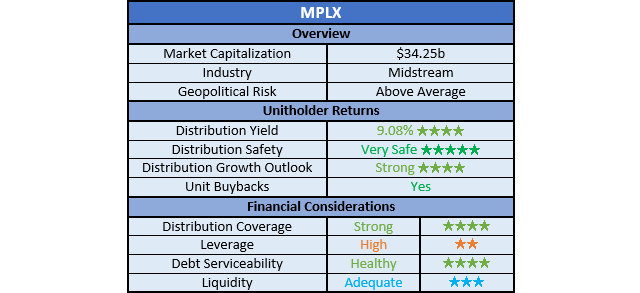
Detailed Analysis
Author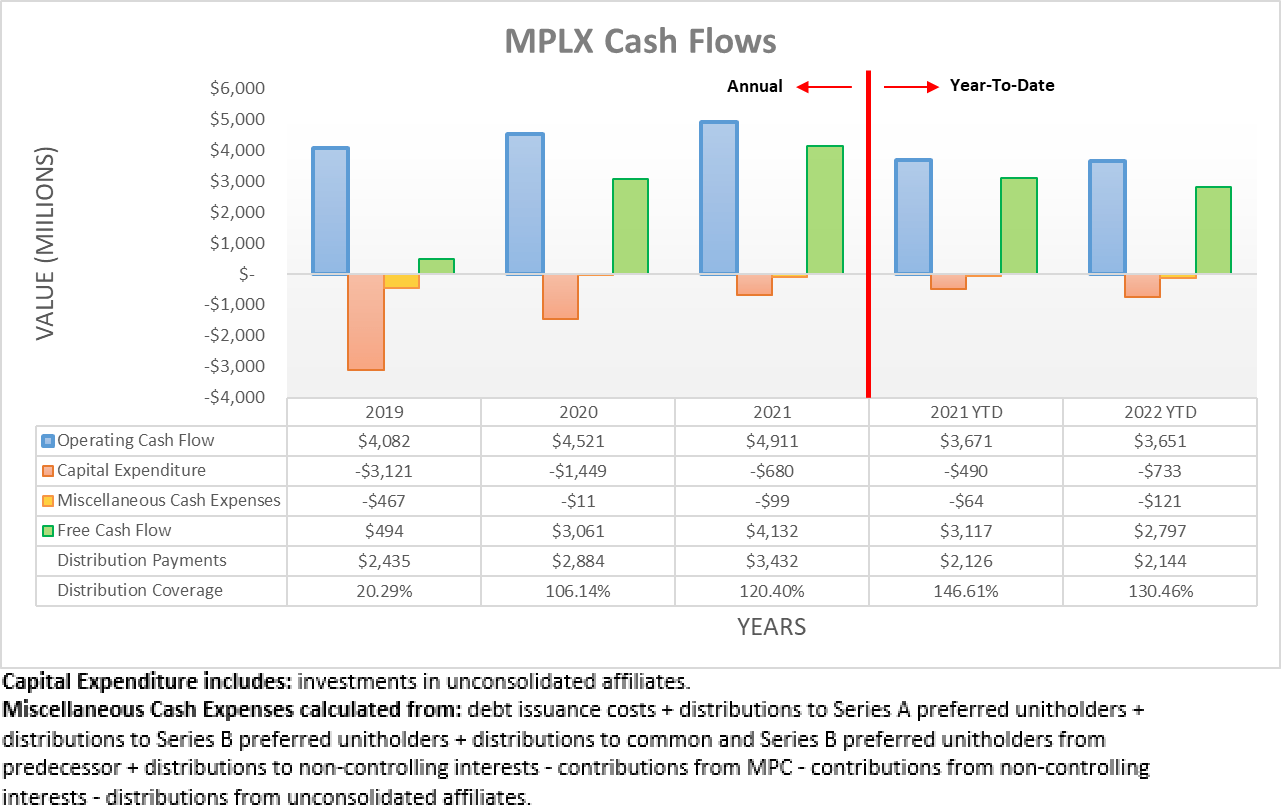
Earlier in 2022, they enjoyed strong cash flow performance with the first half seeing their operating cash flow climbing year-on-year, thereby building upon their strong results in previous years. On the surface, it initially seems the third quarter was a letdown, as their operating cash flow across the first nine months was $3.651b and thus down ever-so-slightly year-on-year versus their previous result of $3.671b during the first nine months of 2021. In theory, this signals a noticeable deceleration during the third quarter of 2022, although much to the relief of unitholders, this was not necessarily the situation.
Author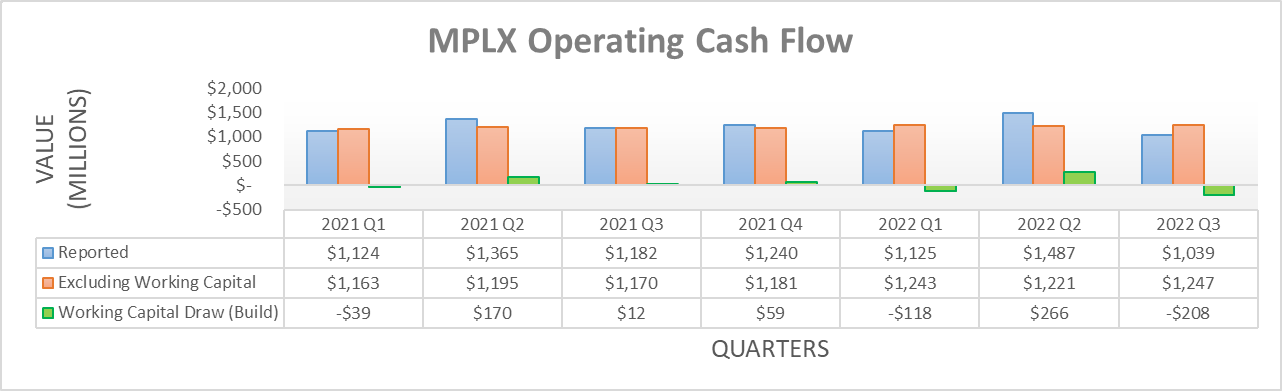
Thankfully, this soft result was merely due to the third quarter of 2022 enduring a $208m working capital build that proved a temporary hindrance versus the $12m build they enjoyed during the third quarter of 2021. If removed, their underlying result for the first nine months of 2022 jumps to $3.711b and thus modestly ahead year-on-year versus their previous equivalent result of $3.528b during the first nine months of 2021.
Since they are tracking ahead versus 2021, their results for the recently ended fourth quarter of 2022 should see their operating cash flow cross the $5b mark for the first time ever, as 2021 landed at $4.911b. In light of their consistently strong cash flow performance, I see no reason to expect 2023 will be any softer. If anything, it is actually more likely to be even stronger given their higher growth investments during the first nine months of 2022, which resulted in capital expenditure expanding to $733m versus its previous level of $490m during the first nine months of 2021.
Whilst only time will ultimately tell, this strong base nevertheless sets a positive tone heading forwards into 2023 and beyond, which I suspect underpinned management lifting their already high-yielding distributions another 10% higher in late 2022. After such an impressive and frankly speaking, rare move, it naturally raises questions regarding whether there is any scope for higher distributions in future years.
As it stands right now, their latest outstanding unit count is 1,003,242,909 and thus, their new quarterly distributions of $0.775 per unit will cost $3.11b per annum. Whilst their capital expenditure guidance for 2023 and beyond remains presently unknown, this leaves a circa $2b gap between their estimated operating cash flow for 2023 and beyond. To put this another way, their distribution payments should consume around 60% of their operating cash flow and even though free cash flow ultimately funds the former, in the medium to long-term their operating cash flow informs how close they are to their absolute ceiling.
Obviously, no company nor master limited partnership could ever safely return the entirety of their operating cash flow via distribution payments, as nothing would be left for even maintenance capital expenditure. Whilst a somewhat debatable topic, I personally view the absolute ceiling as around 80% for the capital-intensive but nevertheless steady midstream industry, thereby leaving cash to sustain their assets without significantly risking their distributions.
Concurrently, this implies there is still room for materially higher distributions in coming years, even if the partnership were to take a low capital expenditure road that ultimately sees their top-line growth track sideways. That said, there is also the more appealing road whereby they continue utilizing this cash to fund growth capital expenditure and unit buybacks, which drive top-line growth in the medium to long-term and thus as a result, create greater scope for higher distributions. Whilst the road they take presently remains to be seen, both lead to higher distributions, which is very desirable given their existing high circa 9% yield that is underpinned by a solid financial position.
Author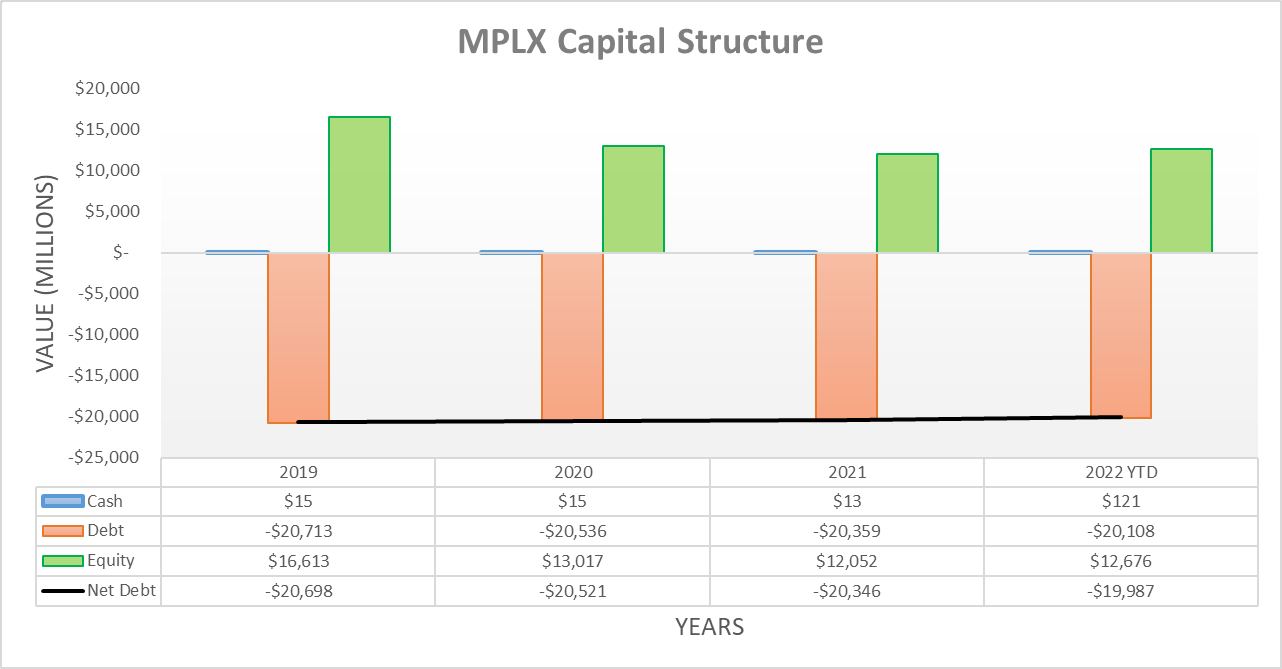
Notwithstanding their strong financial performance, their net debt still edged higher during the third quarter of 2022 to land at $19.987b versus the second quarter, when it landed at $19.477b. This $510m increase primarily stemmed from their $208m working capital build, plus the accompanying $180m of unit buybacks with the residual due to immaterial routine variables. As for the recently ended fourth quarter and further into 2023, their net debt will most likely continue fluctuating around its circa $20b level, as they once again most likely continue balancing cash inflows with cash outflows via share buybacks.
Since their net debt only saw a relatively minor increase versus the second quarter of 2022 and merely one quarter elapsed following the previous analysis, it would be redundant to reassess their leverage or debt serviceability in detail. Likewise, the same can also be said for their liquidity given their cash balance of $121m following the third quarter is not a big difference versus its previous balance of $298m, if viewed in context for the size of their partnership.
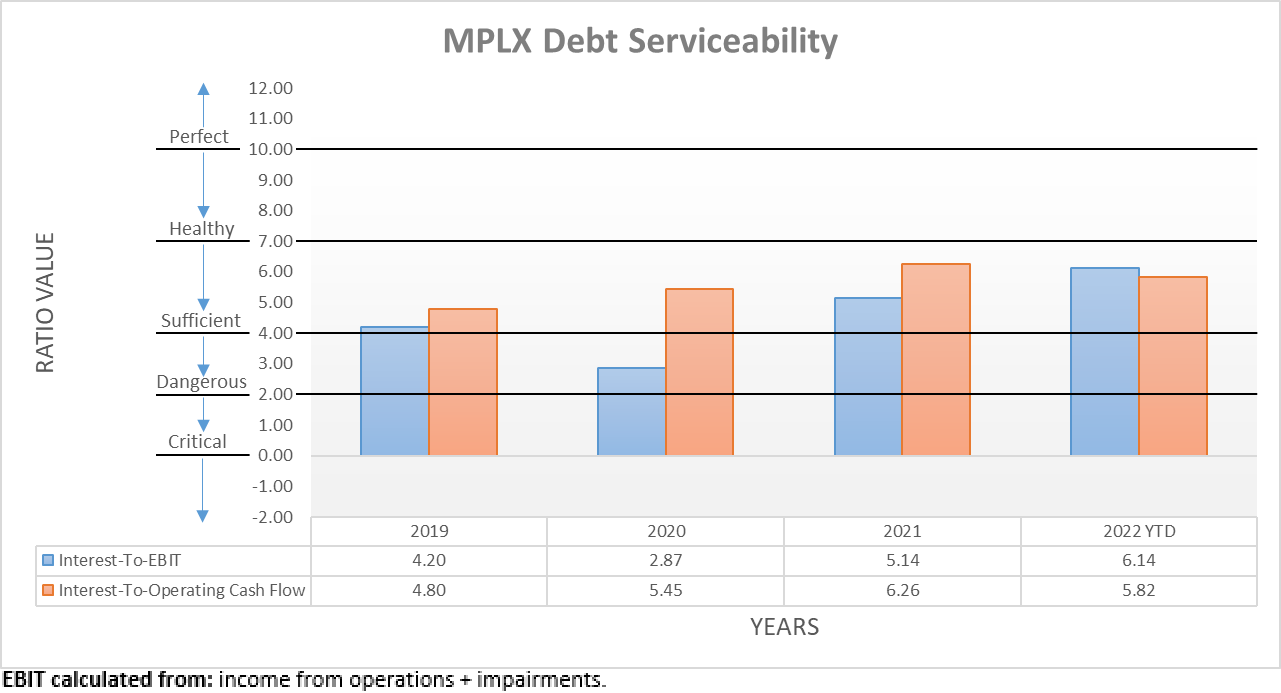
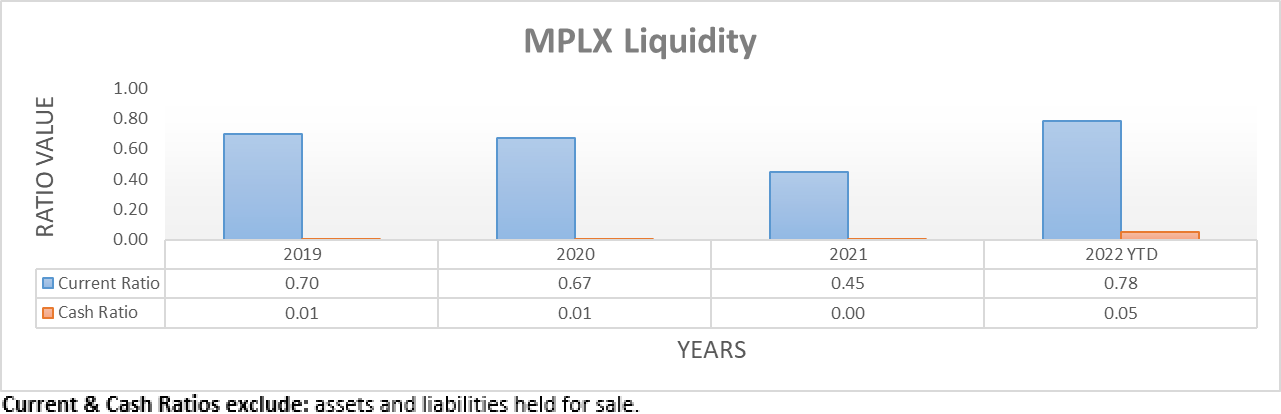
The three relevant graphs are still included below to provide context for any new readers, which shows their leverage continues its downward trajectory with their net debt-to-EBITDA falling to 3.14 and their net debt-to-operating cash flow following along at 4.04. Whilst the former is now easily within the moderate territory, the latter is still making its way through the high territory of between 3.51 and 5.00 but given their consistently strong cash flow performance, this is not concerning. Quite unsurprisingly, their debt serviceability is following suit with their interest coverage improving to 6.14 when utilizing their EBIT and 5.82 when utilizing their operating cash flow. Whilst their cash balance dropped, their liquidity stay adequate with a current ratio of 0.78 and a cash ratio of 0.05. If interested in further details regarding these topics, please refer to my previously linked article.
Author Author Author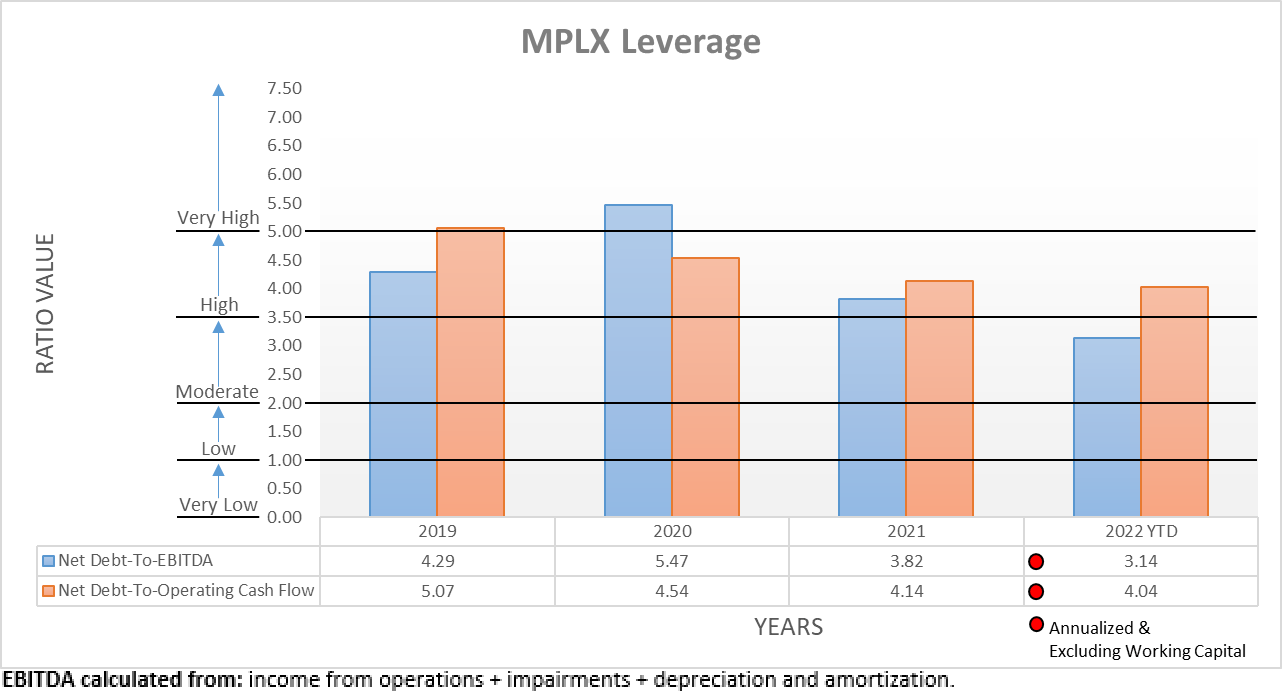
Conclusion
Their already solid financial position strengthening is the icing on the proverbial cake for higher distributions, which is primarily underpinned by their payments remaining a reasonable size and their accompanying consistently strong cash flow performance. Very importantly, once again management shows a willingness to reward their unitholders and not merely rest upon their laurels and thus, it should not be surprising that I still believe my strong buy rating is appropriate.
Notes: Unless specified otherwise, all figures in this article were taken from MPLX’s SEC filings, all calculated figures were performed by the author.
Be the first to comment