

Twomeows_IS
Investment thesis
Akamai Technologies, Inc. (NASDAQ:AKAM) has lost over 30% in less than 3 months and is now trying to form a base, while its trend is still negative. The recent price action is at some possible relative strength building up, and the stock could form the last leg of its corrective wave, projecting the stock likely at over $94. While this is my most likely scenario, a possible continuation of the short-term downtrend cannot be excluded and the stock could test again the lows set in July at $85.90, resulting in a risk/reward ratio of 2 from its last closing price. Investors should consider the downside risk if the stock fails in the described scenarios, with the next possible support seen 9% lower at $80.55. Akamai is a leader in its industry and its increasing exposure to the cybersecurity market is seen as favorable, as that industry seems to be less affected by the market downturn and reported substantially higher relative strength.
A quick look at the big picture
The technology sector in the US is among the winners in the last 3 months, led by a rebound in solar stocks, followed by companies in the consumer electronics and software application industries, while companies in the information technology services industry are still laggards in the group.
finviz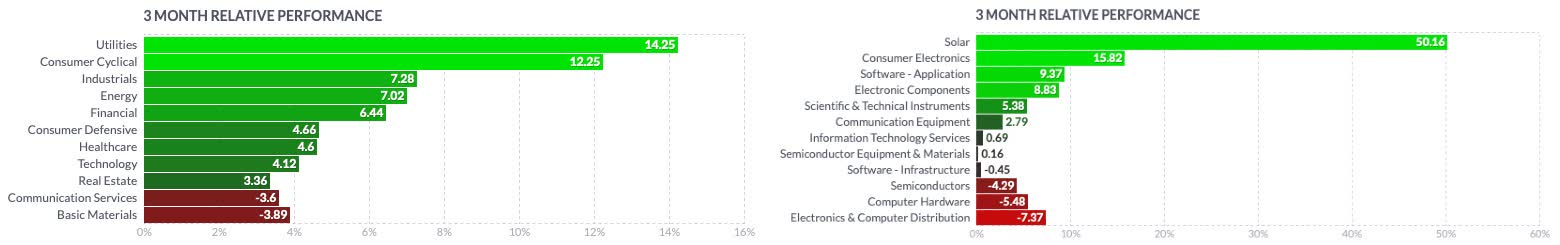
Looking at more specific groups of the industry, the First Trust Cloud Computing ETF (SKYY) topped on November 9, 2022, and has since severely corrected, losing almost 50% until June 16 when it bottomed and is since forming a sound base, from which it attempted to break out in August, but failed and got rejected under its EMA50. The industry group is still in a medium and long-term downtrend and is now approaching its low set in June as it again shows relative weakness when compared to the Vanguard Information Technology ETF (VGT).
Author, using TradingView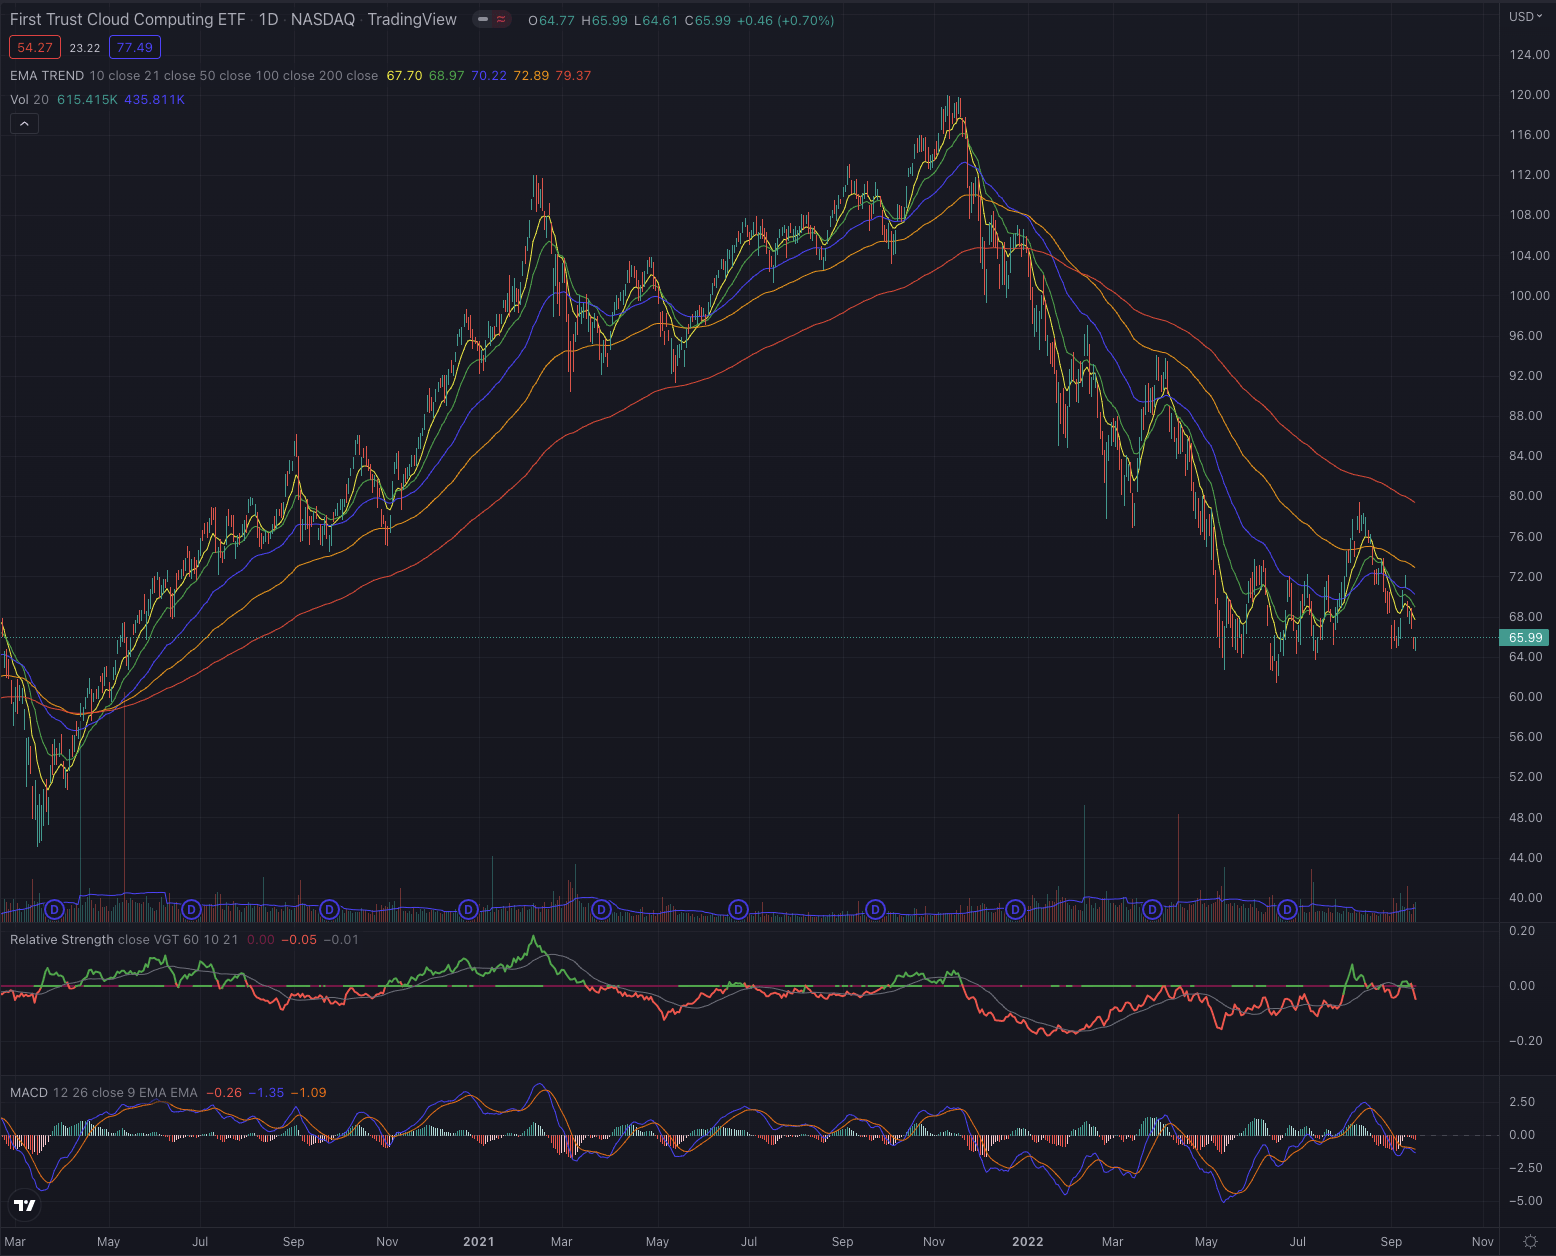
The First Trust Nasdaq CEA Cybersecurity ETF (CIBR), which is a good reference for the cybersecurity industry group, shows a similar pattern, topping on November 10, 2021, and bottoming on June 16, 2022, but with a less severe correction, leading the industry group down by 33%. Despite still being in a downtrend, the CIBR reports a more consistent relative strength in the broader technology market, hinting at a possible leadership of this industry group.
Author, using TradingView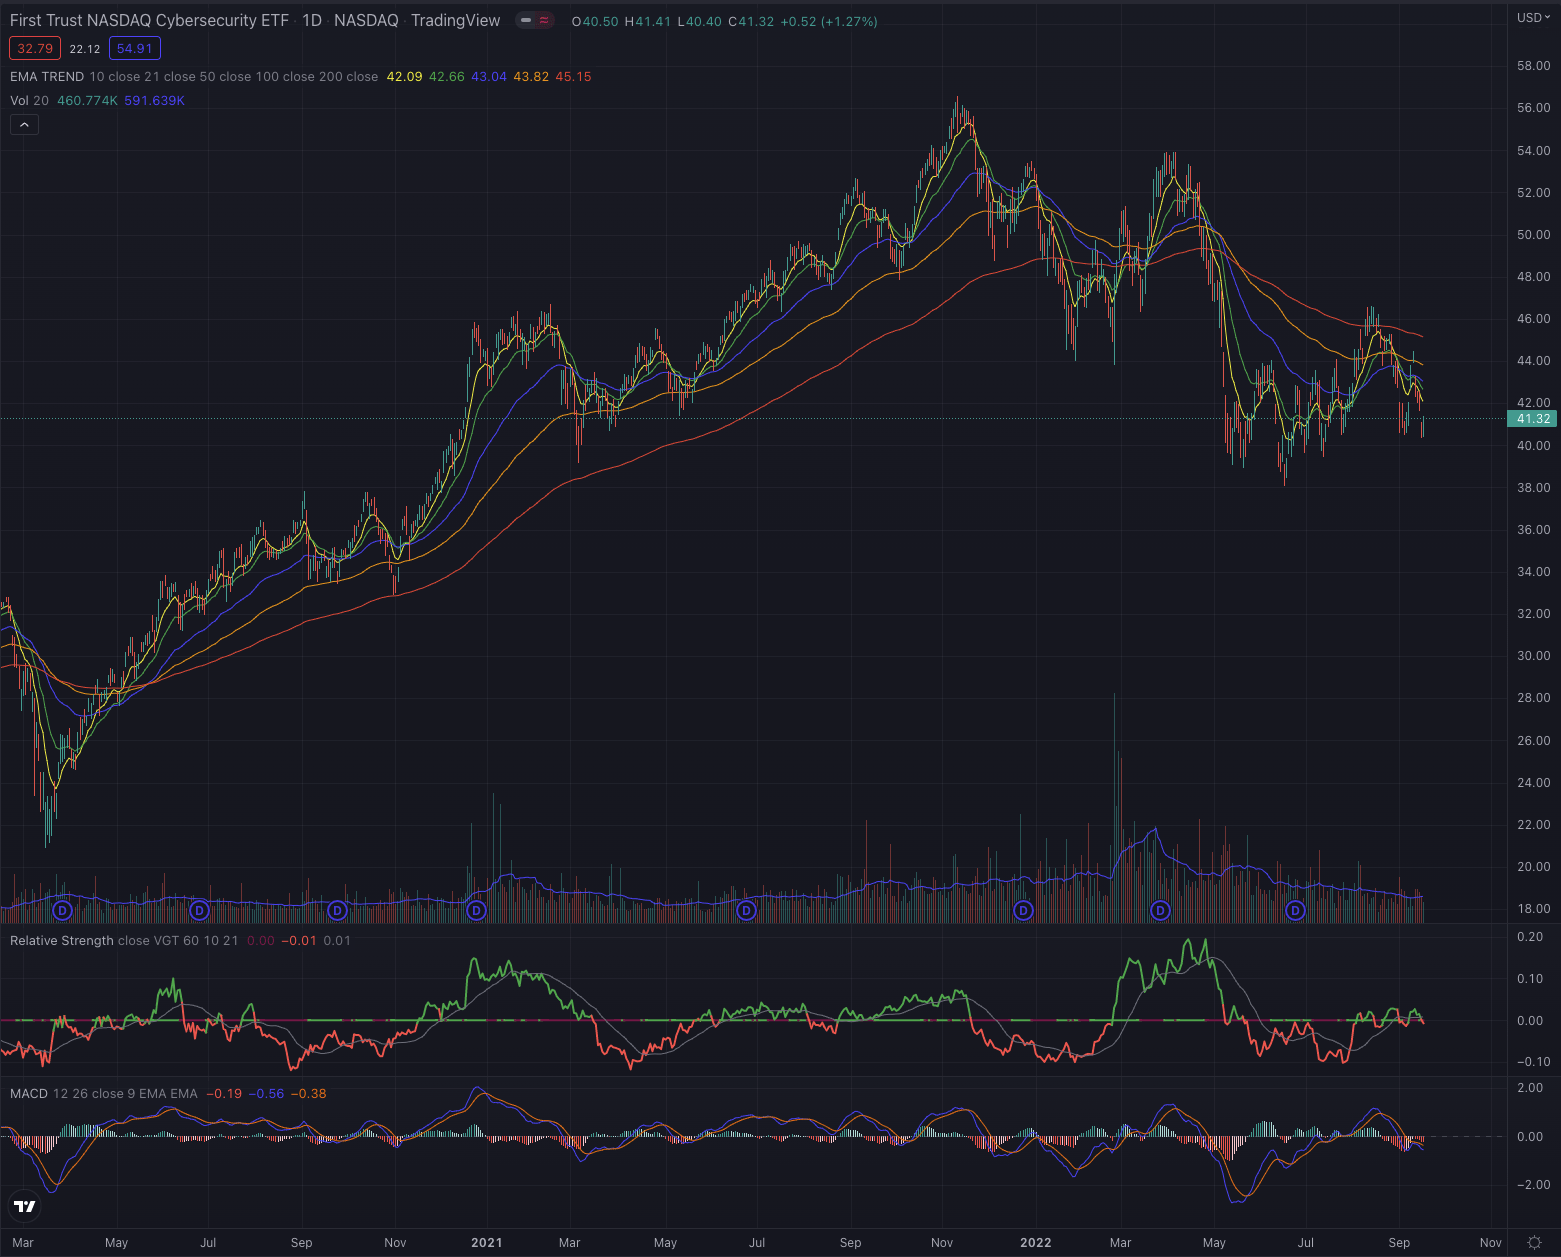
Looking back even further, Akamai has a mixed profile when compared to its main references, reporting 85.78% performance in the past 5 years, in line with the First Trust Nasdaq CEA Cybersecurity ETF CIBR, outperforming both the S&P500 and the First Trust Cloud Computing ETF SKYY but significantly underperforming the Vanguard Information Technology ETF VGT and the broader tech market. Nevertheless, it’s worth observing, that Akamai outperformed all its references during 3 years while only showing some relative weakness starting from 2021.
Author, using seekingalpha.com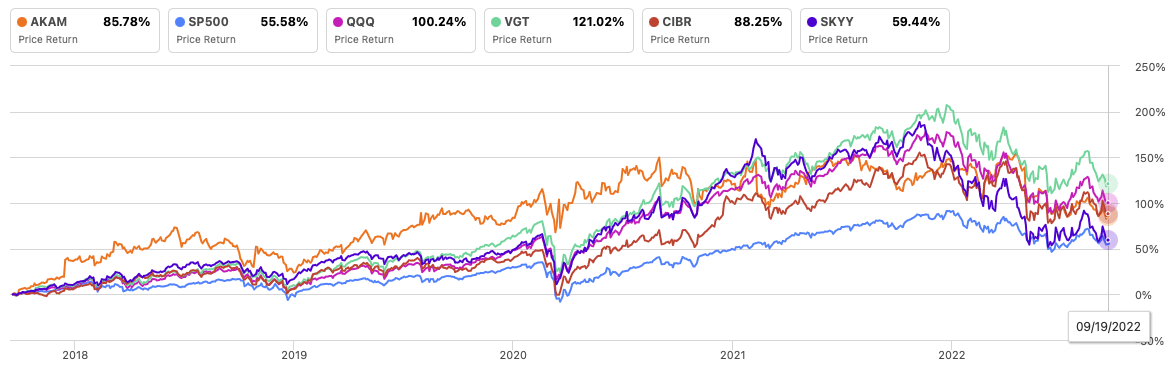
Where are we now?
Since my last article Akamai: Setting Up As A Long-Term Winner published on March 10, where I suggested the stock is a long-term winner but that it may fall under the price level of $100 in the near term, the stock reached $123.25 on April 21, before crashing under $100 shortly after and bottoming on July 14 at $85.90, losing over 30% in less than 3 months.
Author, using TradingView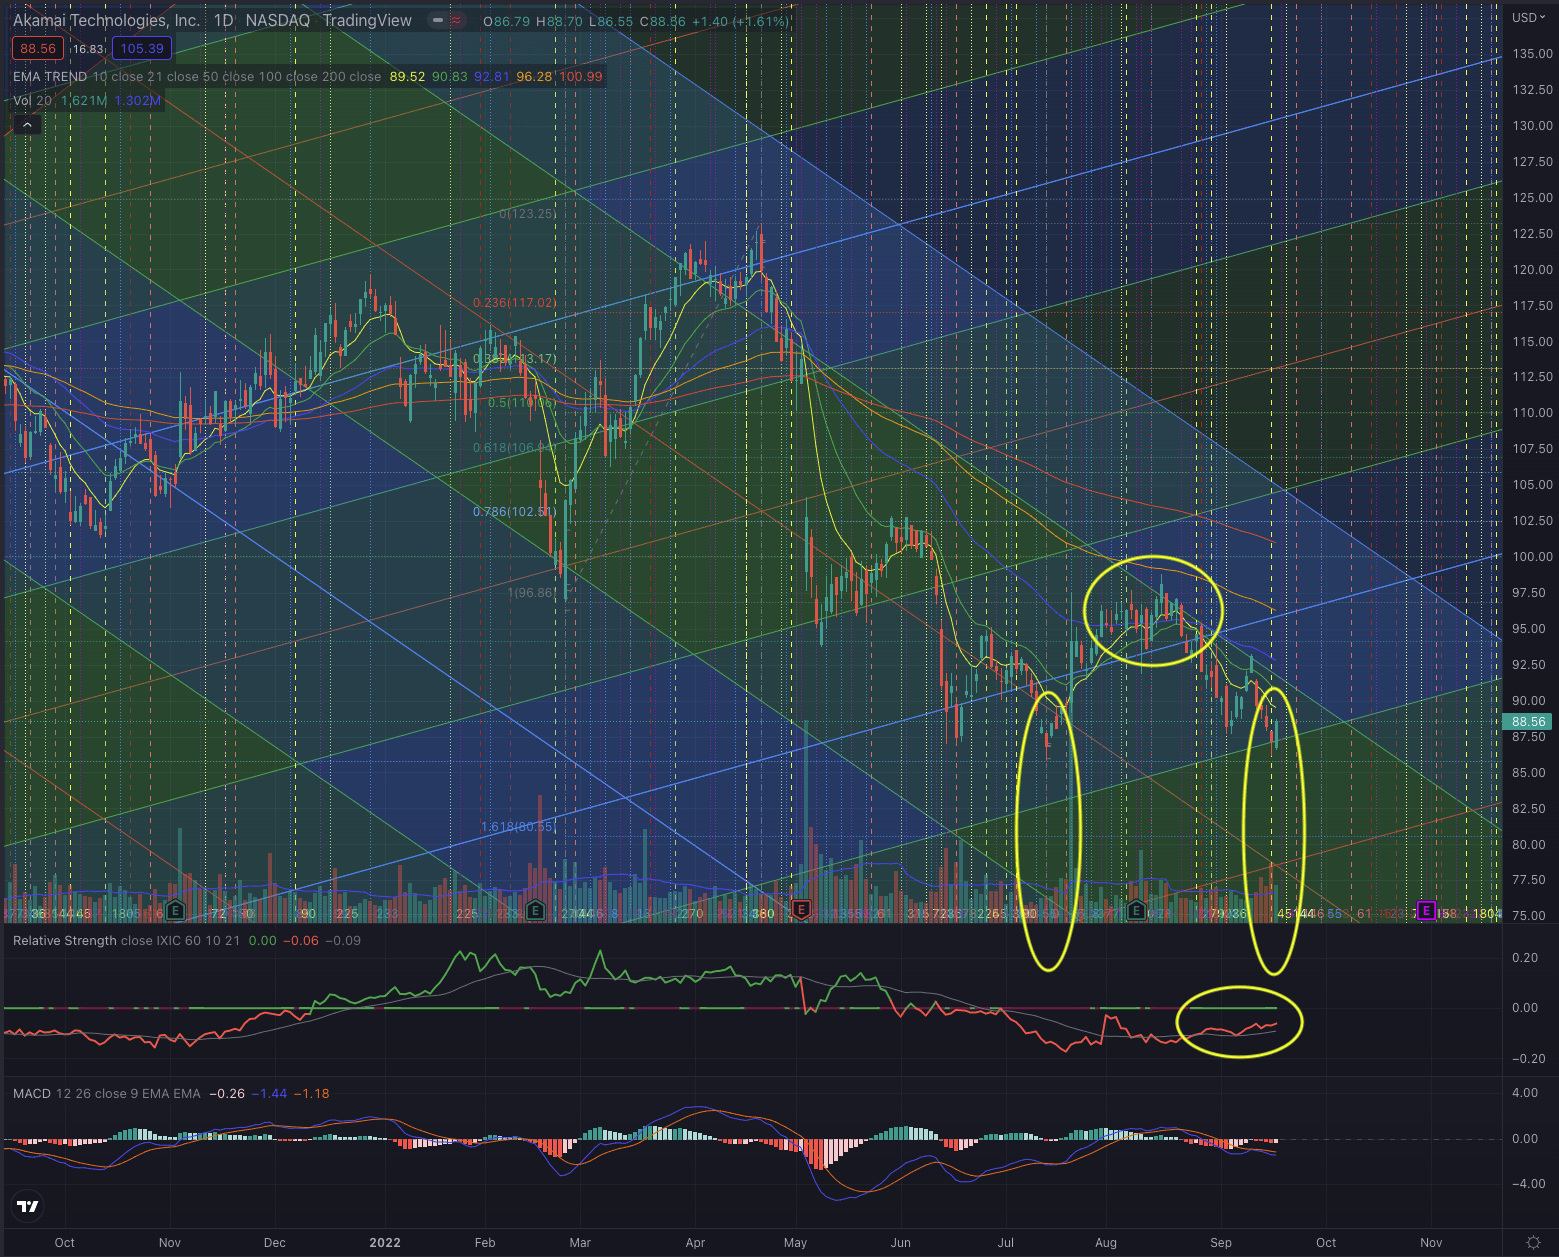
Recently the stock tested the lows of July, after failing to break out of its EMA50 on the daily chart and of its EMA200 on the weekly chart, a clear sign, that the bottoming process is still ongoing and the stock may be subject to higher volatility in the near term, as it still is in a downtrend, priced under all its most important moving averages.
Author, using TradingView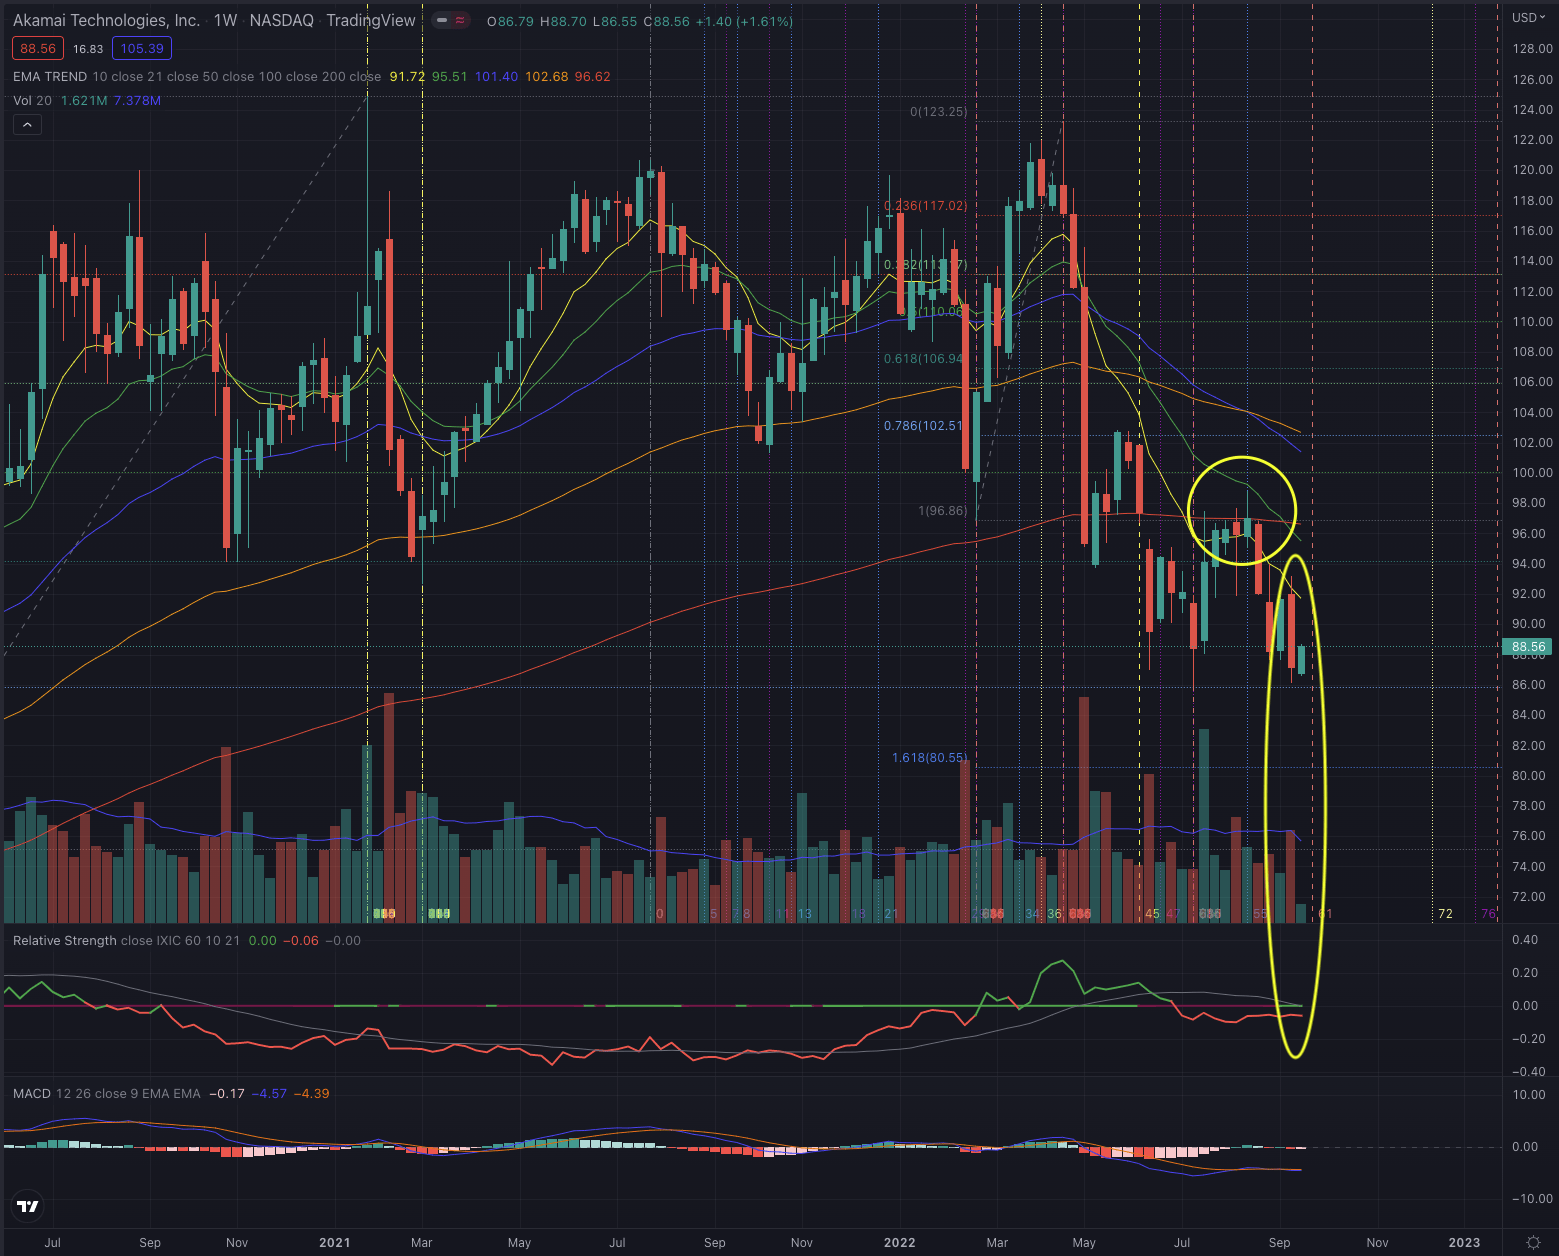
Although the stock seems slowly building up some relative strength, it still shows a negative momentum confirmed by its MACD and relatively stronger selling pressure at the end of last week. The stock has strong overhead resistance, and it will need substantial volume and conviction to overcome the EMA50 on the daily chart and respectively the EMA200 on the weekly chart, and the strong resistance set by an important Fibonacci retracement level at approximately $94.
What is coming next?
I expect the stock to continue building up relative strength, as it seems that the bottom could be hit and the stock is forming a sound base. Sporadic spikes in volatility are not uncommon at this stage, as the stock will likely be testing its closest support and resistance levels.
Author, using TradingView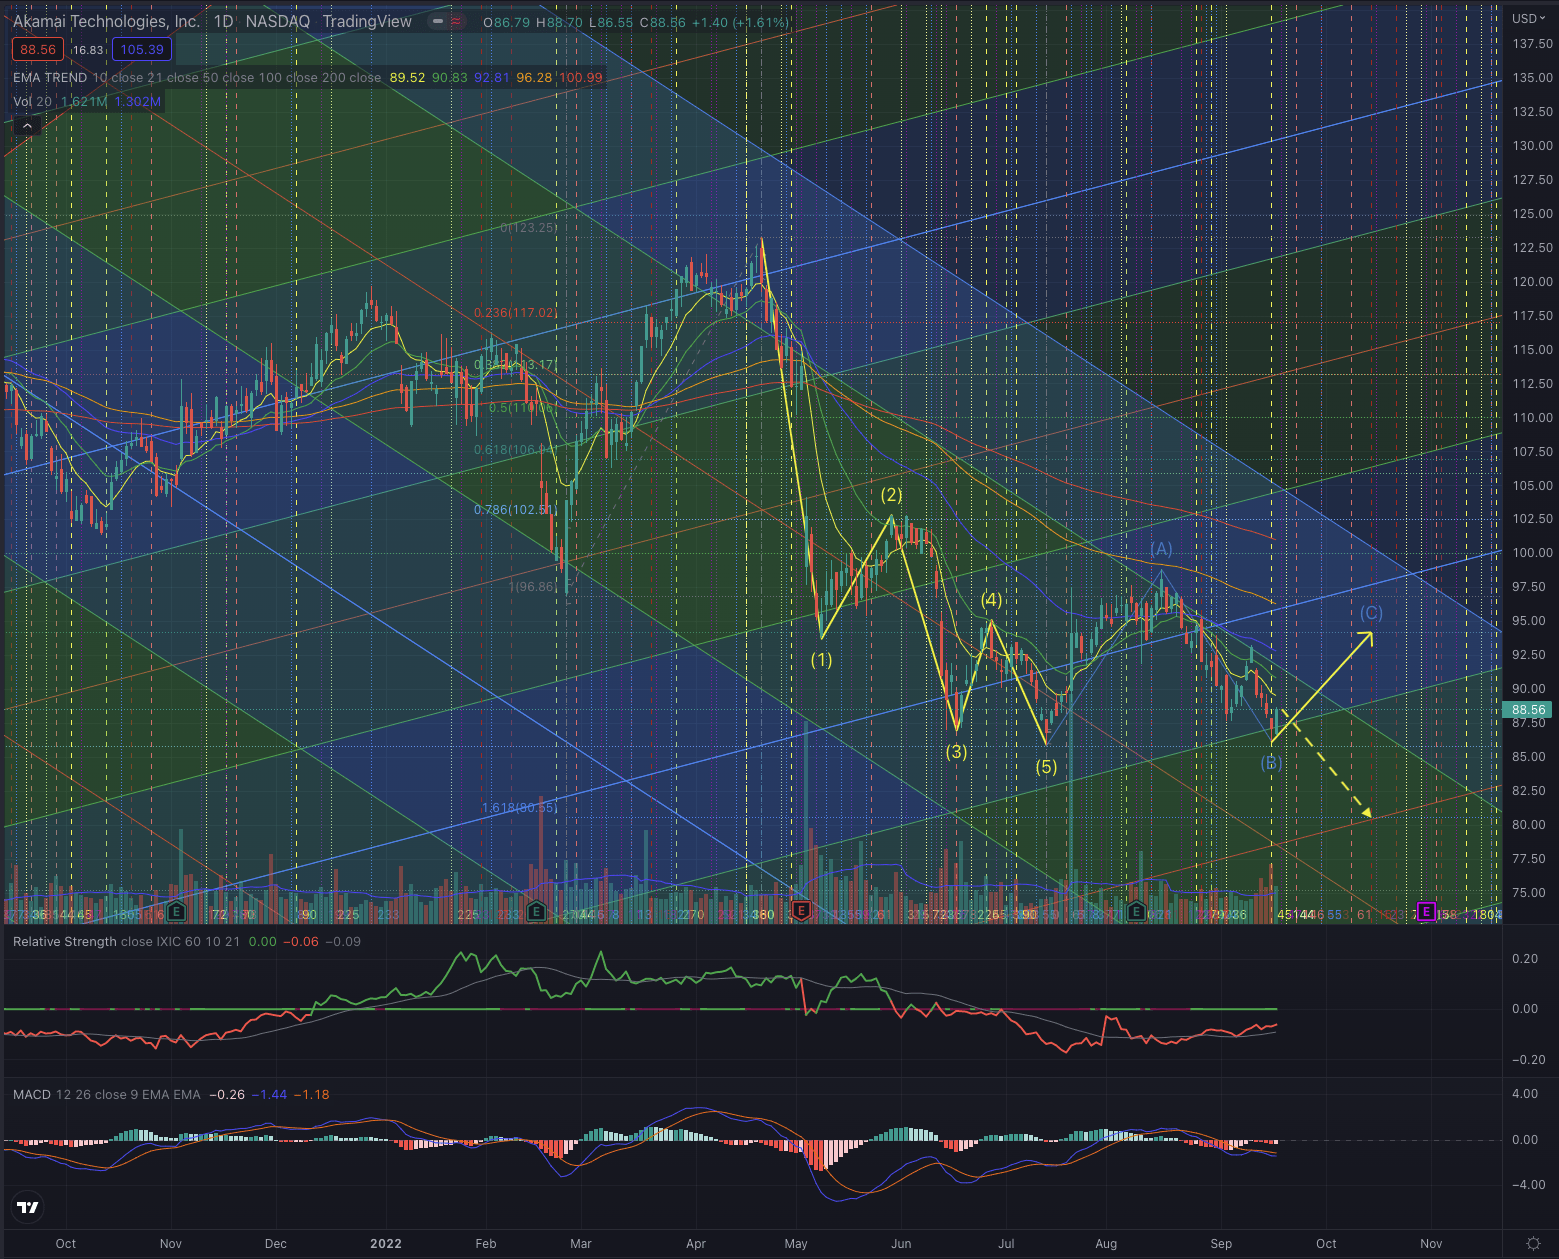
The stock completed its impulse sequence in July and has since formed its corrective wave sequence. As the fourth wave violated one of Elliott’s theory rules, I don’t see the last leg of the corrective wave achieving a significant rebound. My projection, based on Fibonacci’s theory, suggests the most likely price target to be set at $94.13 in the near term. If the stock fails to follow this modelization, the next possible target would be the lows seen in July at $85.90, with a rising risk of breaking under that important support level, with a first target estimated at $80.55.
Investors should closely observe the price action and how the stock behaves at the next support levels, and how an eventual attempt to overcome its resistances is confirmed or rejected, by particularly observing the trading volume in both directions. As the last session showed a substantial spike in buy-side volume, this could eventually be the start of the mentioned last corrective leg, but it’s too early to make any conclusive statement in this sense. If the stock gains in momentum and reaches the next resistance levels with stronger relative strength and increasing volume, I see a significant chance that it could attempt to overcome the previously set short-term top and try to break out towards its EMA200 on its daily chart. As this week will most likely be characterized by higher volatility, due to the Federal Reserve being expected to increase its interest rates, investors should be more cautious and set appropriate stop-loss orders by observing the mentioned support levels.
The bottom line
Technical analysis is not an absolute instrument, but a way to increase investors’ success probabilities and a tool allowing them to be oriented in whatever security. One would not drive towards an unknown destination without consulting a map or using a GPS. I believe the same should be true when making investment decisions. I consider techniques based on the Elliott Wave Theory, as well as likely outcomes based on Fibonacci’s principles, by confirming the likelihood of an outcome contingent on time-based probabilities. The purpose of my technical analysis is to confirm or reject an entry point in the stock, by observing its sector and industry, and most of all its price action. I then analyze the situation of that stock and calculate likely outcomes based on the mentioned theories.
Akamai has many elements that indicate the stock is a long-term leader in its industry, with great opportunities ahead, as I mentioned in my former article. Despite this, the stock is still in a long-term downtrend and the bottoming process seems to not be completed yet. I expect the stock to likely rise in the near term, by reaching my target price set at $94.13 from where it could start a new attempt to overcome its overhead resistance. Investors should be prepared for ongoing higher volatility for the stock, by considering the risk of falling toward new lows, as the general market and particularly stocks in the technology sector are still quite exposed to unfavorable market conditions.
Be the first to comment