

Marut Khobtakhob/iStock via Getty Images
Summary
CF Industries Holdings (NYSE:CF) is involved in the production and dispersal of nitrogen-based fertilizers. The company possesses nitrogen facilities that cater to both agricultural and industrial clients through its distribution network. High shipping and storage expenses for nitrogen fertilizer imports create a competitive advantage for CF Industries in North America, where it thrives on cost-efficient U.S. natural gas, positioning itself as a globally competitive, low-cost nitrogen producer. Around 80% of CF’s nitrogen products are sold as fertilizers. Consequently, CF Industries’ sales and earnings are closely linked to the amount of corn acreage planted in the United States. As planted corn acreage is poised to rise, coupled with anticipated reductions in natural gas prices, I anticipate a favorable growth in the stock price. Other economic factors also weigh favorably for CF Industries, in my opinion.
Increased Corn Acreage
The critical role of nitrogen-based fertilizers in boosting corn yields is pivotal to understanding how this benefits CF Industries’ stock price. As corn, unlike soybeans and wheat, cannot naturally generate its own nitrogen, it relies heavily on external nitrogen sources to thrive. Consequently, the demand for nitrogen fertilizers is intricately tied to the extent of corn cultivation in the United States.
This connection between nitrogen demand and corn acreage becomes even more significant when considering the latest World Agricultural Supply and Demand Estimates (WASDE) report from the United States Department of Agriculture (USDA). The report predicts an impressive surge in corn production for the forthcoming 2023/24 season of up to 55 million bushels, marking an a 58% uptick from the previous year. Whether you believe in global warming or not, the best temperature data available indicates that the weather is becoming more volatile and less predictable. Naturally, this may lead you to question if the WASDE or other figures from USDA can be trusted. Without digressing too far, a 2020 study by the University of Cambridge found that the data presented by USDA contained significantly smaller errors when compared to the data collected by those in the private sector. Another study conducted by the National Corn Growers Association (NCGA) noted that, historically, WASDE reports have reduced market uncertainty (as measured by option implied volatility).
USDA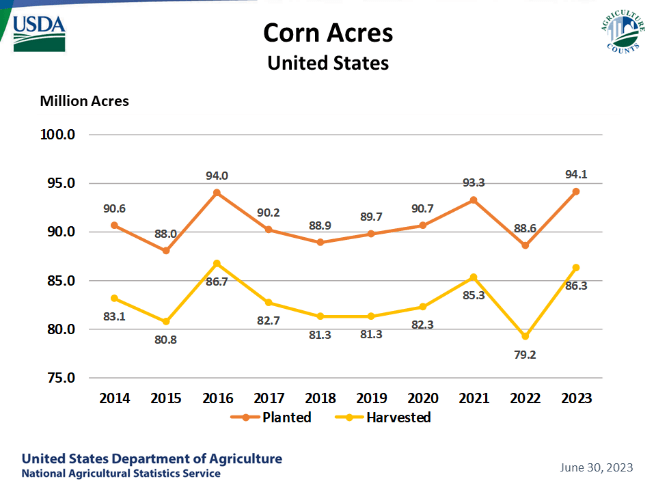
(credit: USDA – National Agricultural Statistics Service – Charts and Maps – Corn: Acreage by Year, US)
Based on this information, I believe that investors are in position to see a robust demand for nitrogen fertilizers, driven by expanding corn acreage, and that we can expect to see a substantial (positive) influence over investor sentiment.
Price of Natural Gas
Lower gas prices in North America relative to other parts of the world help to secure CF’s global competitive edge. As Russia substantially reduced its pipeline gas exports to the European Union, causing an 80% reduction over the year and sparking a global energy crisis in 2022, it created a profound supply disruption that had a far-reaching impact on both European and global gas markets. This abrupt shift in Russia’s gas production prompted extensive reconfiguration of worldwide liquefied natural gas (LNG) flows, leading to record-high natural gas prices in Asia and Europe and necessitating revisions in gas demand forecasts.
In contrast, U.S. production has managed to sustain relatively elevated levels throughout the year 2023, notwithstanding a decrease in U.S. natural gas prices. During the first half of 2023, the U.S. benchmark Henry Hub spot price averaged $2.41 per million British thermal units (MMBtu), marking a contrast to the annual average of $6.42/MMBtu observed in 2022.
Natural gas serves as the primary feedstock in nitrogen fertilizer production, constituting nearly half of production expenses. CF benefits from the cost advantage of lower natural gas prices relative to their overseas counterparts, who are currently relying on higher-cost natural gas or coal-based feedstocks. While I do not believe that cheap natural gas alone can insulate CF from other unfavorable conditions that may arise, this certainly tips the scale in favor of a growing share price over the next 52 weeks.
An Inherent Advantage to the U.S. Corn Belt?
While CF’s facilities enjoy affordable North American natural gas due to their proximity to their primary customer base in the U.S. Corn Belt, there is another interesting angle to this location. Sure, CF sells fertilizer, and since corn requires a lot of fertilizer, it is good to be located near your customers; but, I think there is more to this location than just being near customers. I suspect that the U.S. Corn Belt is potentially the best place in the world for any company with infrastructure needs. I believe that the corn belt contains a unique convergence of electrical lines, railways, pipelines, and barge access. Although some of the information I need to support this claim is not publicly available, for security reasons, we can still think this through. For one, the corn belt is a huge expanse of land, located in an ideal climate, and is predominantly flat. Can you think of another benefit to having flat land? Flat land means lowers construction costs to get pipelines installed, electric lines ran, and railway systems laid, since less dirt work and demolition are needed. In addition, the Ohio River and Mississippi River are well-known for their barge access and utilization. I just had to include this aside because I have always considered this possibility to be intriguing and deserving of further research.
Fundamental & Technical Analysis
No analysis of this nature would be complete without also taking into consideration the fundamental aspects of the company. A few things stand out from a basic review of the financial statements. While operating income stagnated from 2018 to 2020, these figures increased by roughly 50% in 2021 and again in 2022. At the same time, SG&A costs have remained fairly consistent. Stable SG&A coupled with a growth in operating income demonstrates that the company can scale up to match the demands of the economy without losing administrative efficiency.
|
CF Industries |
|||||
|
Date |
2018 |
2019 |
2020 |
2021 |
2022 |
|
Operating Income (in millions) |
$257 |
$1,862 |
$883 |
$4,639 |
$10,809 |
|
SG&A (in millions) |
$2,582 |
$2,653 |
$2,868 |
$3,131 |
$3,286 |
A review of CF’s comparative financial statements reinforces my bullish position and supports my belief that the stock price will continue trending upward. As you will see, the financial statements unveil a pattern of asset growth, augmented retained earnings, and enhanced shareholder equity during the period in question. However, diligent monitoring of current liabilities and a deeper exploration of the motives behind the shift in treasury stock are imperative. Looking at this data, I think this is the best time to buy the stock in 5 years, so let’s dive in!
Asset Growth
Looking at cash equivalents and short-term investments, we see that CF’s cash holdings cash have demonstrated a consistent upward trajectory, culminating in $1,902 million by the close of 2022. CF is also seeing significant growth in short-term investments. Compared to 2018, when these investments were valued at $682 million, CF’s positions grew by 70% over this 5-year period, arriving at a valuation of $2.3 billion by the end 2022. In my opinion, this underscores the potential for yield optimization on idle cash reserves, strong liquidity, as well as CF’s ability to meet short-term financial obligations.
CF’s receivables have also grown over this 5-year period, both gross and net, from $235 million in 2018 to $582 million in 2022. I believe that this signifies an expanding sales portfolio, but moving forward, investors should also watch for any significant changes in the allowance for doubtful accounts.
It is likely that CF is preparing for growth in production and sales, as inventory holdings have moderately increased from $309 million in 2018 to $474 million in 2022. On the other hand, the net value of property, plant, and equipment has declined from $8,623 million in 2018 to $6,691 million in 2022. This suggests depreciation or potential curtailment of investments in those specific assets, but I do not believe that this will have any long-term implications for the company. No substantial changes are noted in goodwill, intangibles, long-term investments, or other investments.
Liabilities & Shareholder Equity Suggests Increased Profitability
Short-term liabilities have increased by approximately $200 million from 2018 to 2022, while long-term liabilities have moderately decreased.
Both common stock and additional paid-in capital have exhibited a state of relative constancy throughout this same period. Retained earnings has seen a substantial upswing, progressing from $2.4 billion in 2018 to $3.8 billion in 2022. This underscores the company’s profitability and its retention of earnings for future growth. Overall, total equity has grown from $2.9 billion in 2018 to $5 billion in 2022, signifying an improved state of shareholder value.
Perhaps the most interesting change the company has gone through is that the treasury stock balance has transitioned from a negative balance of $504 million in 2018 to $0 in 2022. To me, this indicates that CF is serious about following through with its aggressive share repurchasing programs. The 2022 Annual Report for CF Industries indicates that the Board of Directors authorized the repurchase of $1.5 billion from November 3rd, 2021 to December 31st, 2024. Then again on November 2nd, 2022, the Board of Directors authorized the repurchase of an additional $3 billion in shares, upon the completion of the 2021 repurchase program, through December 31st, 2025. Could be Board of Directors consider another repurchase program in November, 2023? Only time will tell.
Comparing CF to the Competition
It is also important to compare how CF is performing relative to its main competitors. CF has a much higher current ratio and operating margin than ICL Group (ICL), Mosaic Company (MOS), and Nutrien Limited (NTR). This suggests that not only is CF in a much better position to pay its debts, but that CF also has better control over its variable costs. Examining the gross margin, ICL Group is a close rival to CF Industries, but Mosaic Company and Nutrien Limited are still far behind. The difference in operating margin is much more concerning for ICL, MOS, and NTR, as this will make it more difficult for them to remain viable when economic conditions become more challenging. As the old saying goes, when the tide rolls out, you can see who is skinny dipping!
|
Key Statistics Comparison |
||||
|
Company Name |
CF Industries (CF) |
ICL Group (ICL) |
Mosaic Company (MOS) |
Nutrien Limited (NTR) |
|
Current Ratio |
6.55 |
1.75 |
1.18 |
1.26 |
|
Operating Margin |
40.40% |
26.22% |
16.46% |
17.72% |
|
Gross Margin |
44.05% |
43.56 |
22.06% |
33.59% |
|
P/E Ratio |
6.93 |
5.37 |
5.95 |
8.84 |
When considering that CF maintains a superior operating margin, gross margin, and current ratio to its competitors, I feel that CF’s P/E ratio is only marginally higher. In my opinion, CF is trading at a discount relative to its intrinsic value. Before addressing the operations of the company itself, which will help to inform this opinion, I want to briefly comment on MACD and RSI, just to rule out any interference from trading conditions.
A 52-week chart of the MACD and RSI indicators are presented below, along with the stock price. The RSI indicator shows that the stock is not currently overbought or oversold. Over the past 52 weeks, RSI has seldom entered overbought or oversold territory. At the time of this writing, the MACD indicator shows that the stock is slightly oversold. Over the past 52 weeks, MACD has frequently changed between overbought and oversold. A review of these charts would lead one to conclude that the pricing action of CF stock has not been significantly influenced by any large amounts of buying or selling. No significant fluctuations in positions stemming from insider trading have been noted.
E*Trade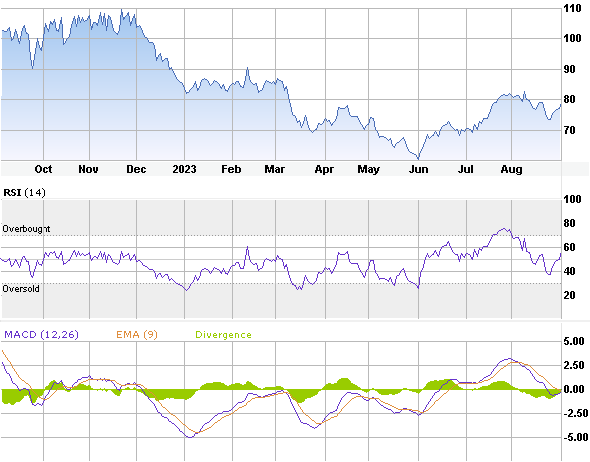
CF and its Recent Operations
CF Industries operates as a prominent ammonia producer, employing the Haber-Bosch process to manufacture ammonia-based products vital for food production. Haber-Bosch is currently the most efficient process in the industry for producing ammonia, but it comes at the cost of greater carbon-emissions. The company plans to continue using this process while making changes to completely eliminate its carbon footprint by 2050. Meeting this goal would be significant step toward de-carbonizing the agricultural industry, as 90% of the carbon footprint associated with corn originates from the necessary production of ammonia as a fertilizer.
CF has identified a growing interest in the use of ammonia as a source of hydrogen, which is an excellent renewable energy source. I feel that this is a likely area for CF to expand into and could one day serve as an additional revenue source for the company. In contrast, wind and solar energy have fallen out of favor because they are cost prohibitive.
The company notes in its 2022 Annual Report that it maintains a robust distribution network for nitrogen products, utilizing a setup that is unique to each of its plants. For example, the report notes the facilities in Donaldsonville, Verdigris, and Yazoo city rely extensively on barges to transport product. At other facilities they will opt to use a fleet of leased railcars instead. I believe this commentary supports my earlier position about the strategic location of the U.S. Corn Belt.
In describing the main characteristics of their product line, the report discusses the seasonality of their sales. Demand for CF’s products are strongest during the spring planting season and the fall harvest. While it would be preferable to have sales that are consistent throughout the year, one advantage to the routine downtime is something known as plant turnaround. Every plant in the manufacturing industry has to go through this at some point. Simply put, it is a period of time where the plant shuts down its operations to perform maintenance and inspections that would not otherwise be possible during operations. For CF, this time is often needed to upgrade its equipment to keep up with everchanging environmental regulations, as well as their goal of producing green ammonia by 2050.
Recent Quarterly Performance (2Q 2023)
CF Industries reported strong operational performance and solid financial results for the first half of 2023. They reported adjusted EBITDA of $1.72 billion for the first half of 2023, compared to $3.60 billion for the same period in 2022. Net earnings attributable to common stockholders were $1.09 billion for the first half of 2023, with a net earnings per diluted share of $5.55. The company also returned approximately $1.3 billion to shareholders over the last twelve months through June 30, 2023.
The company reports that the results were driven by robust nitrogen demand, favorable gas costs, and strong operational performance. CF Industries also reportedly made significant progress in its clean energy initiatives, including signing agreements for long-term clean ammonia offtake and supply, as well as advancing blue and green ammonia projects.
In my opinion, the company appears to be focused on increasing free cash flow generation capacity and growing shareholder participation in their free cash flow. The company’s strong free cash flow metrics indicate an undervalued equity, and they continue to emphasize opportunistic share repurchases and investments in high-quality clean energy projects. CF anticipates that the global nitrogen market will remain strong for the remainder of 2023 and into 2024, with favorable energy differentials supporting significant margin opportunities for low-cost North American producers.
Despite all of this, there were some aspects to the report that lead to a mixed reaction from investors. Earnings per share decreased from $5.58 per share to $2.70 per share from the corresponding period of the previous year, though it exceeded the Zacks Consensus Estimate of $2.15. The company’s net sales experienced a decline of approximately 47.6% year-over-year, reaching $1,775 million for the quarter. Within its segments, net sales decreased in the Ammonia, Granular Urea, Urea Ammonium Nitrate, and Ammonium Nitrate segments compared to the prior year. Overall, the 2Q 2023 report for CF did little to move the stock price in either direction.
The report was released on August 3rd, 2023. Presented below is a chart showing the stock price for CF from August 1st, 2023, to September 8th, 2023. The volume of shares is also presented.
August Quote (E*Trade)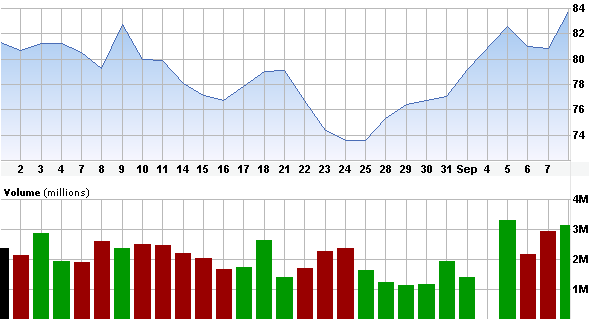
Valuation
My valuation of CF Industries is based on an analysis of discounted cash flows and leads me to value the stock at $97.90 per share. First, we examine the free cash flow from 2018 to 2022 as of December 31st of each year. The net changes in cash are presented in a chart below and a linear regression line. We see that from 2018 to 2022, the net change in cash flow increased by an average of $303.6 million.
Annual Net Changes in Cash (in millions) (E*Trade)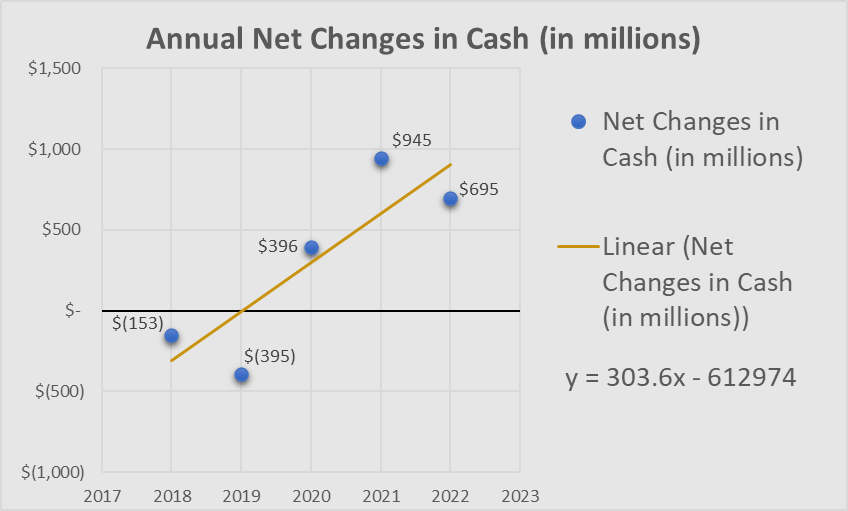
While looking at the net changes in cash at year end holds predictive value, we can gain more insight by examining the quarterly reports from Q2 2022 to Q2 2023. During this period, we see a significant decrease in the growth rate of net cash flows. The chart above has an average growth rate of $303 million per year while the chart below has an average growth rate of $0.26 million per year.
Net Changes in Cash (in millions) (E*Trade)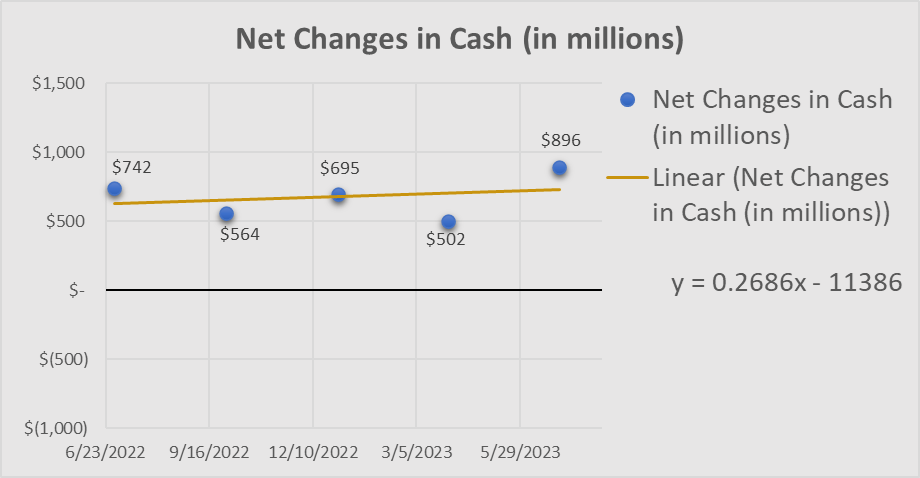
What could be the explanation for this stagnation in the growth rate of net cash flows? Looking at the table below, we see a steady increase in cash from operations. Cash from investments has remained consistent. Cash from investments experienced moderate downward momentum. Foreign exchange events have stayed relatively low compared to the other categories, with moderate downward momentum in 2022. It seems that the two biggest influences were increases in cash from operations and decreases in cash from financing.
Annual Net Changes in Cash (E*Trade)
Changing our focus to the quarterly reports, total cash from operations remained consistent from 06/30/2022 to 12/31/2022. Q1 and Q2 of 2023 saw some decreases in cash flow from operations. From 06/30/2022 to 06/30/2023, cash from investments remained consistent. Cash from financing saw an increase in the first half of 2023. Cash from foreign exchange increases saw a moderate increase from 06/30/2022 to 12/31/2022. Moving into 2023, cash from foreign exchanges returned to typical levels over the past five years. In my opinion, it appears that the primary reason for stagnation of the moving average for net changes in cash flow decreased compared to the last three quarters of 2022.
Quarterly Net Changes in Cash (E*Trade)
Additionally, the projection assumes that the number of outstanding shares will remain constant at 192.9 million, although there is reason to believe that this figure is likely to decrease. To summarize the table below, first we look back at the end of 2022, when net changes in cash was $695 million and there were 195.6 million shares outstanding. The figure for 2023 is the most recent data that is available, on 06/30/2023, when net changes in cash were $896 million and there are 192.6 million shares outstanding. Then, 2024 and 2025 each see an increase to net changes in cash of $300 million. From 2026 to 2033, the net change in cash is left constant at $4 billion and the outstanding shares are left constant at 192.9 million for the same reasons that are stated above. Next, the net change in cash is divided by the number of outstanding shares, resulting in the figures for net changes in cash per share. Lastly, the discount rate assumes that investors can go elsewhere (such as CD’s or sweep accounts) to receive a 3% interest rate. The average net changes in cash per share from the end of 2023 to the end of 2023 come out to an average of $15.90.
Projected Cash Flow (Author)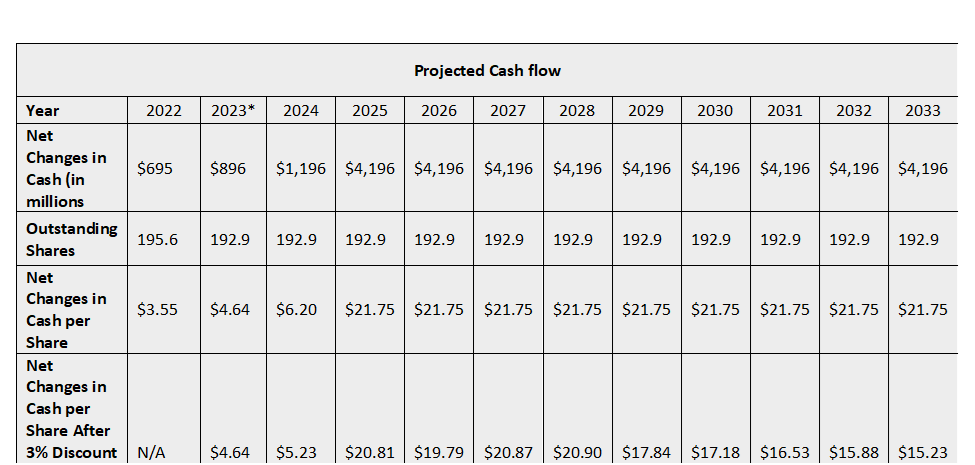
* Net changes in cash is from Q2 2023
The current stock price is approximately $82. Adding $15.90 to $82 is $97.90, which is where I see the stock price going to over the next 2 years. Further growth beyond this amount would lead me to re-evaluate market conditions to determine if there is a favorable outlook for continued growth.
Risks
My opinion that CF is poised for growth is heavily predicated upon the belief that corn acreage will increase while natural gas prices will remain competitive in North America relative to other parts of the world. While a decrease in corn acreage and an increase in natural gas prices are the most obvious risks to this thesis, there are other factors that should also be taken into consideration.
While the cost of natural gas is the single largest influence on the price of nitrogen fertilizer production, the pricing can also be influenced by other factors such as weather conditions, geopolitical events, and supply-demand imbalances. Any significant fluctuations in these prices could impact CF Industries’ profitability and stock price.
Macroeconomic factors such as inflation, interest rates, and overall economic health can also influence investor sentiment and stock prices. Changes in these macroeconomic factors can affect CF Industries’ cost structure and access to capital. However, such conditions would likely affect CF’s competitors as well.
Although Russia’s invasion of Ukraine, and the subsequent on natural gas prices in Europe has had favorable results for CF industries, this can act as a double-edged sword. Fluctuations in currency exchange rates can impact its competitiveness and profitability in international markets. Currency devaluations or appreciations can affect the company’s revenue and earnings. The global economic landscape can change rapidly. Economic downturns or recessions can reduce demand for fertilizers and impact CF Industries’ financial performance. Likewise, disruptions in the supply chain, such as transportation or logistics issues as the result of war or other events, can affect the company’s ability to distribute its products efficiently. This can lead to delays, increased costs, and potential revenue loss.
Lastly, the fertilizer industry is highly competitive, and CF Industries faces competition from both domestic and international producers. Shifts in market share, aggressive pricing strategies, or technological advancements by competitors could affect CF’s market position and profitability. For now, this concern is mostly kept at bay by CF’s superior operating margin and current ratio.
Investors should conduct thorough research, consider these risks, and diversify their portfolios to manage potential volatility and uncertainties associated with investing in CF Industries or any other stock. Additionally, consulting with a financial advisor can provide valuable guidance tailored to individual investment goals and risk tolerance.
Closing Remarks
In conclusion, CF Industries presents a compelling investment opportunity driven by the synergy between increased corn acreage, favorable natural gas prices, and “green” ammonia. The company’s strategic positioning, efficient distribution network, and sound financial fundamentals make it a strong contender in the market. However, wise investors should always be mindful of potential risks, from unpredictable weather patterns to global economic fluctuations. Diversification and expert guidance are the compasses that will help navigate the ever-changing waters of the financial world. So, as you consider your investment choices, may your decisions be as fruitful as a bountiful harvest, and your portfolio, well-fertilized with nitrogen.
|
Quarterly Net Changes in Cash |
|||||
|
Year |
6/30/2022 (Q2) |
9/30/2022 (Q3) |
12/31/2022 (Q4) |
3/31/2023 (Q1) |
6/30/2023 (Q2) |
|
Total Cash from Operations (in millions) |
$2,280 |
$3,270 |
$3,855 |
$947 |
$1,659 |
|
Total Cash from Investments |
$(121) |
$(308) |
$(440) |
$(34) |
$(127) |
|
Total Cash from Financing |
$(1,404) |
$(2,370) |
$(2,700) |
$(410) |
$(639) |
|
Foreign Exchange Events |
$(13) |
$(28) |
$(20) |
$(1) |
$3 |
|
Net Changes in Cash |
$742 |
$564 |
$695 |
$502 |
$896 |
|
Quarterly Net Changes in Cash |
|||||
|
Year |
6/30/2022 (Q2) |
9/30/2022 (Q3) |
12/31/2022 (Q4) |
3/31/2023 (Q1) |
6/30/2023 (Q2) |
|
Total Cash from Operations (in millions) |
$2,280 |
$3,270 |
$3,855 |
$947 |
$1,659 |
|
Total Cash from Investments |
$(121) |
$(308) |
$(440) |
$(34) |
$(127) |
|
Total Cash from Financing |
$(1,404) |
$(2,370) |
$(2,700) |
$(410) |
$(639) |
|
Foreign Exchange Events |
$(13) |
$(28) |
$(20) |
$(1) |
$3 |
|
Net Changes in Cash |
$742 |
$564 |
$695 |
$502 |
$896 |
Be the first to comment