

shapecharge/iStock via Getty Images
This article was first released to Systematic Income subscribers and free trials on Mar. 29
The current CEF market drawdown has made it clear that those income investors who carefully build up their reserves of dry powder during periods of expensive valuations are the ones who are able to fully take advantage of periods of dislocation.
This counter-cyclical investment strategy is able to not only sustainably increase portfolio income levels over time but also provide investors with greater conviction in their allocations, preventing some of the damaging behavioral dynamics we often see in the income space. In this article we discuss this CEF strategy and show how we are putting it to work today.
Strategy Snapshot
At its most basic, the strategy is designed to sustainably increase the income level of the portfolio. The point of the word sustainably is that there are many ways to increase the income level of a portfolio. Investors can simply allocate to riskier assets, they can borrow on margin, they can allocate to securities that have a deceptively high distribution rate (which bears little resemblance to the underlying earning power). We would argue that all these are unsustainable ways to increase the income level of the portfolio.
The way the strategy increases the income level of the portfolio over time is by acting counter-cyclically. It allocates drier-powder assets to CEFs during drawdowns and vice-versa.
To some investors this may feel like “trading”. However, it is just value investing. When CEFs are attractively valued, it makes more sense to allocate more of the income portfolio capital to them and when they are less attractively valued, it makes sense to allocate less.
This strategy has two important benefits. First, it allows an income portfolio to sustainably increase its level of income over time. The shorthand for this, as we often like to say, is “if everything you own is down 20%, it’s hard to take advantage of attractive opportunities”. Portfolios that are always “pedal to the metal” at 100% CEF allocations will struggle to make this strategy work because CEFs are not particularly resilient during periods of market weakness due to the tendency of their discounts to open up.
The second benefit of the strategy is that, by virtue of having a portfolio set up to take advantage of market dislocations, it helps keep some of the damaging behavioral tendencies at bay such as going to cash at the lows. The shorthand for this benefit is – “plan beats no plan”, to borrow from Tim Geithner.
The key market dynamic that underpins this strategy is composed of two market characteristics. First, credit markets are fundamentally mean-reverting. A good way to picture this is by looking at the history of high-yield bond credit spreads which tend to range from a low of around 3% to about 10% outside of exceptional periods.
FRED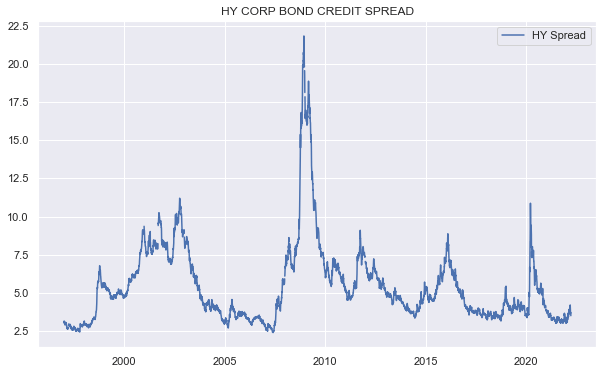
The second market characteristic that makes the strategy work is that different investment vehicles have a different beta and drawdown potential. CEFs will have larger drawdowns than open-end funds such as ETFs and mutual funds. This is due to both the additional leverage of CEFs as well as the fact that discounts tend to widen when NAVs fall, or said another way, CEF prices tend to underperform CEF NAVs during risk-off periods.
We can see this clearly in the historic drawdowns of CEFs versus open-end funds across different sectors such as tax-exempt Munis below. Other fixed-income sectors looks very similar. Every serious market drawdown has seen CEFs underperform their open-end fund counterparts by around 7-15%.
Systematic Income Funds Tool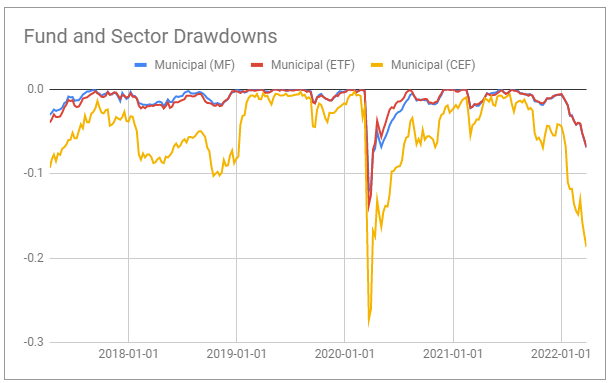
In short we have a market dynamic where 1) credit markets suffer periods of extreme dislocation, 2) are predictably mean-reverting and 3) CEFs suffer significantly larger drawdowns. Does this create an opportunity for income investors. In our view the answer is clearly yes.
This raises the question of how do investors go about rotating from their drier-powder / open-end fund allocations to CEFs and vice-versa. There is no hard-and-fast rule but there are some clear guidelines, some of which we covered in an earlier article.
Our favorite metric for this is what we call excess yield which is how much additional yield a CEF is able to generate over and above an open-end fund. This excess yield is a function of two key things – CEF discounts and underlying asset yields. The wider the discounts and the higher the underlying asset yields the more attractive CEFs are relative to open-end funds.
We track this metric across the broader credit market by using High Yield corporate bond credit spreads as a valuation proxy. The chart below shows that this excess yield has tended to trade around 1-3% outside of exceptional periods, meaning a typical High Yield corporate bond CEFs has offered a yield that was 1-3% above a sector ETF. In 2021 we discussed repeatedly how the excess yield in credit markets was exceptionally low, making CEFs not very attractive at all.
Systematic Income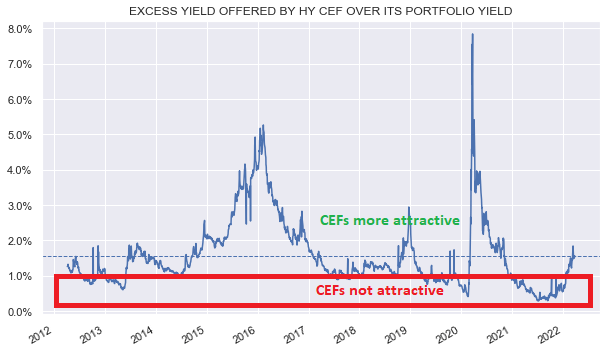
Investors can also track excess yield on a sector basis – the chart below shows the trailing-twelve month yield of preferred CEFs less that of preferred ETFs. In 2021 preferred CEFs offered only a bit more than 1.5% above the yield of ETFs – a historically unattractive level.
Systematic Income Funds Tool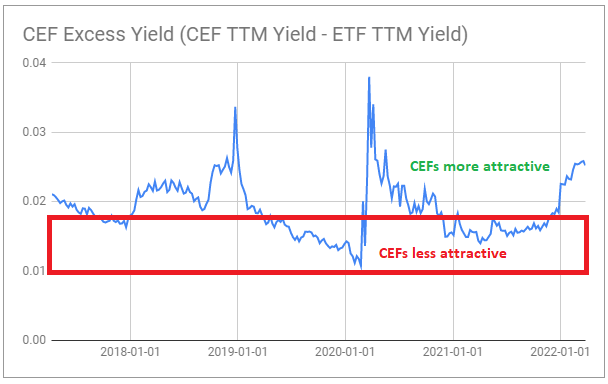
In short, when excess yield moves lower, CEFs become less attractive and when it moves higher, CEFs become more attractive.
An even quicker way to gauge the overall attractiveness of the CEF market is a chart we follow daily in our CEF Tool which shows the median trailing-twelve month yield of the CEF market. It’s a chart we have highlighted a number of times before and it shows (clearly marked by our deeply analytical annotations) how unattractive the broader CEF market was in Q4 of last year and how much more attractive it is today.
Systematic Income CEF Tool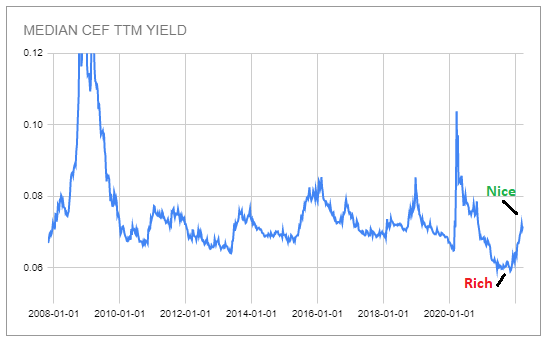
What We Are Doing Now
In response to what was a clearly expensive valuation environment for CEFs in the second half of 2021, we reduced our CEF allocation across our Portfolios – the CEF allocation (orange bars) is highlighted below.
Systematic Income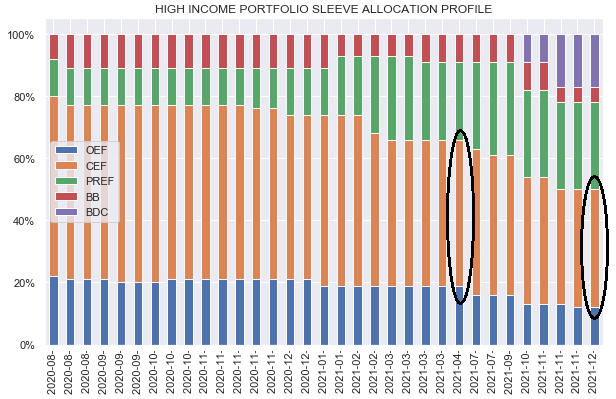
Over the past few weeks we have been moving some of our drier-powder capital back into CEFs.
For example, in our Municipal Income Portfolio we have used some of our drier-powder open-end fund allocation in (FLMB) and (MMIN) to allocate to 3 very attractively valued muni CEFs as shown in the chart below. Although our open-end fund allocations have not escaped unscathed they have outperformed most of the CEFs in the sector by 7-12%. The presence of these drier-powder assets has allowed the portfolio to conserve capital which can now be put to work in CEFs at unusually attractive yields and valuations. If and when the tax-exempt market valuation recovers back to an expensive level, some of the CEF holdings will be recycled back into more resilient holdings. Rinse repeat.
Systematic Income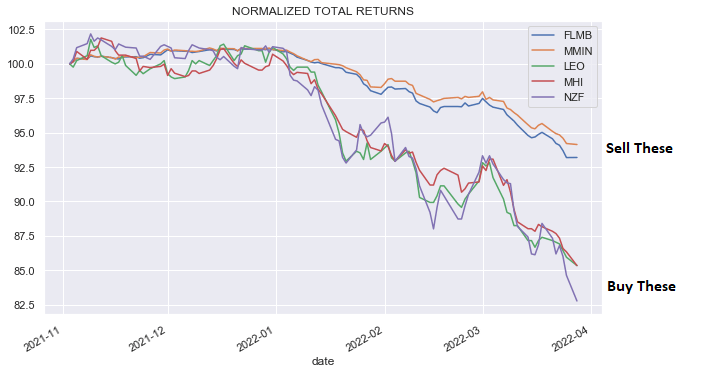
As the chart above suggests, in the tax-exempt sector we like the Nuveen Municipal Credit Fund (NZF), trading at a 8.7% discount and a 5.74% current yield.
Systematic Income CEF Tool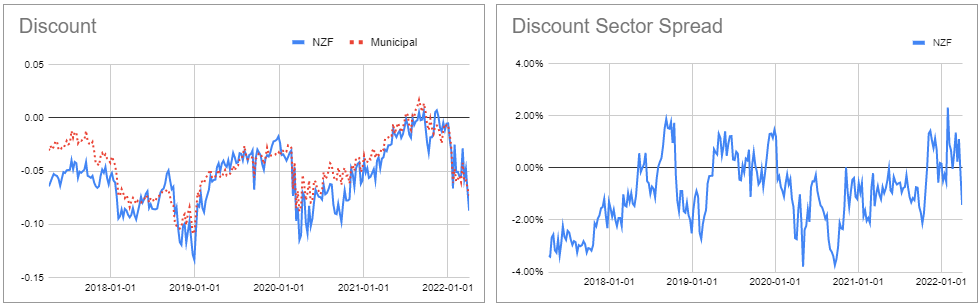
NZF has also bested the sector in total NAV terms over various periods.
Systematic Income CEF Tool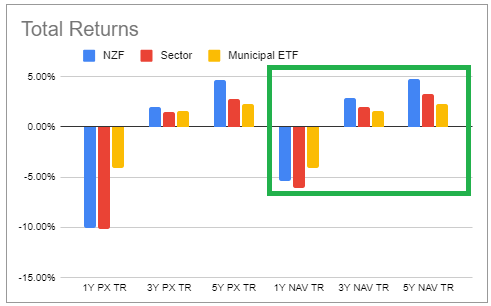
In the broader CEF space, we continue to nibble on funds in other sectors. We currently like the Western Asset Diversified Income Fund (WDI), a multi-sector credit fund, trading at a 13.5% discount and a 8.9% current yield and the Ares Dynamic Credit Allocation Fund (ARDC), a loan and high-yield bond fund, trading at a 11.9% discount and a 8.5% current yield.
Takeaways
The credit market features a number of characteristics that can allow patient investors to sustainably grow the income level of their portfolios. These features are its varying valuation, occasional volatility and mean-reversion. Investors can do this by building up a set of more resilient assets such as open-end funds and then “spending” these assets on the higher-beta CEFs.
The last three months have been a very good example of how this strategy can be put to work as many open-end funds have outperformed their sector CEF counterparts by 5-15%. The capital held in these more resilient assets can now be put to work at very attractive yield levels available in CEFs. And although this approach can feel like market timing or trading, it is just an extension of value investing across the CEF space.
This is the strategy that informs our own Income Portfolios and it is one that investors can easily carry out themselves, allowing them to generate rising portfolio income levels while maintaining high conviction in their allocation strategy during periods of market stress.
Be the first to comment