

Moussa81
Introduction
Vancouver-based gold miner B2Gold Corp. (NYSE: NYSE:BTG) released its second-quarter of 2022 gold production results on July 13, 2021.
Note: I am regularly covering B2Gold on Seeking Alpha since 2019. This article is an update of my preceding article published on May 5, 2022.
1 – 2Q22 Gold Production Snapshot
B2Gold posted a solid gold production of 223,623 Au ounces (including 14,765 Au ounces for its 30.8% Calibre Mine) in the second quarter of 2022. The company indicated that it was on track to meet annual guidance for 2022 with a total of 990K-1,050K.
BTG Quarterly production and guidance 2022 (B2Gold Press release) BTG Quarterly gold production 2Q21 vs 2Q22 (Fun Trading) Note: B2Gold holds 93.332 million shares in Calibre Mining (OTCQX: CXBMF), representing a 30.08% stake approximately. The company received 12,892 Au Oz from the Calibre Mine in the first quarter of 2022.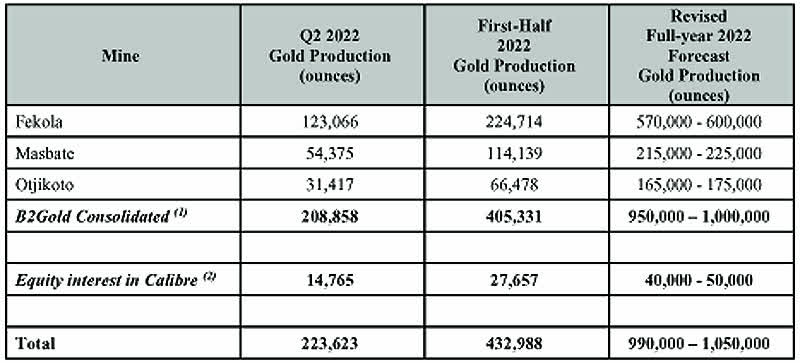
2 – Stock Performance
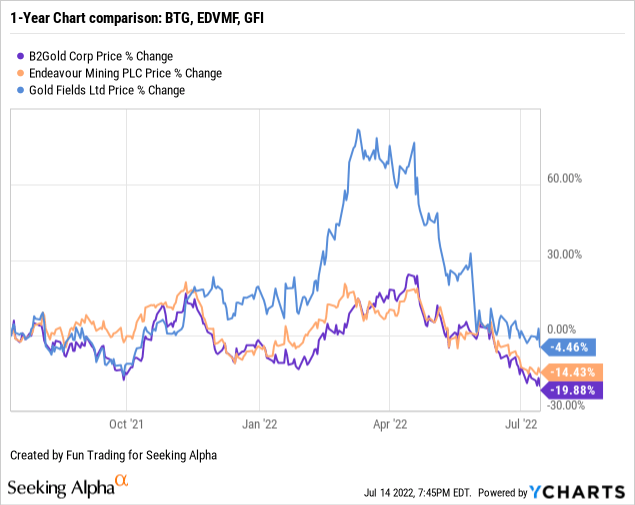
B2Gold is underperforming Endeavour Mining (OTCQX:EDVMF) and Gold Fields (GFI), which can be considered similar and is now down 20% on a one-year basis.
3 – Investment Thesis
I like BTG even though its flagship mine is located in Mali. The risk of doing business in West Africa is always present and should be factored into your investment. However, the situation in Mali is getting normalized again, the company said in the press release:
The Company welcomes the recent announcement by ECOWAS of the removal on July 3, 2022 of the economic, financial and diplomatic sanctions imposed on Mali in January 2022. The sanctions were removed by ECOWAS after the interim Malian Government announced a two-year transition to presidential elections and promulgated a new electoral law. Mali’s borders with its neighbouring countries have now re-opened to normal commercial traffic and ordinary supply routes are available
One working strategy that I often recommend for this sector in my marketplace, “The gold and oil corner,” is trading LIFO about 50%-60% of your total position and keeping a core long-term position for a much higher payday.
The gold market is highly volatile and weakening due to the FED’s hawkish action in response to very high inflation. In less than two weeks, the FED will probably hike interest by 75-point again after the CPI number came in at a multi-decade record of 9.1%.
Trading LIFO allows you to take advantage of the short-term volatility while positioning for a possible future uptrend.
B2Gold – 2Q22 Balance Sheet And Production Trend (Preliminary) – The Raw Numbers
| B2Gold | 2Q21 | 3Q21 | 4Q21 | 1Q22 | 2Q22 |
| Total Revenues in $ Million | 362.99 | 510.86 | 526.11 | 365.58 | 382.0 |
| Net Income in $ Million | 68.46 | 123.11 | 136.94 | 80.72 | – |
| EBITDA $ Million | 118.53 | 335.77 | 360.19 | 222.42 | – |
| EPS diluted in $/share | 0.06 | 0.12 | 0.13 | 0.09 | – |
| Cash from Operations in $ Million- | -8.32 | 320.28 | 266.29 | 107.31 | – |
| Capital Expenditure in $ Million | 40.59 | 63.56 | 112.50 | 67.97 | – |
| Free Cash Flow in $ Million | -48.91 | 256.73 | 153.79 | 39.39 | – |
| Total cash $ Million | 382.14 | 546.51 | 673.00 | 648.76 | – |
| Total Long-term Debt in $ Million | 35.25 | 29.58 | 75.10 | 72.7 | – |
| Dividend $/share | 0.04 | 0.04 | 0.04 | 0.04 | 0.04 |
| Shares outstanding (diluted) in Billion | 1.064 | 1.061 | 1.061 | 1.061 | – |
| Production | 2Q21 | 3Q21 | 4Q21 | 1Q22 | 2Q22 |
| Total Production gold | 211,612 | 310,261 | 304,897 | 209,365 | 223,623 |
| AISC from continuing operations/consolidated | 1,016 | 795 | 888 | 1,036 | – |
| Gold Price | 1,814 | 1,782 | 1,800 | 1,874 | 1,861 |
Data Source: Company press release
Analysis: Revenues, And Gold Production
1 – Quarterly Revenues were $382 Million For 2Q22
BTG Quarterly Revenues history (Fun Trading) The company announced consolidated gold revenues of $382 million in the second quarter of 2022, up 5.2% from the year-ago period and up 4.5% sequentially (see table above for details and history).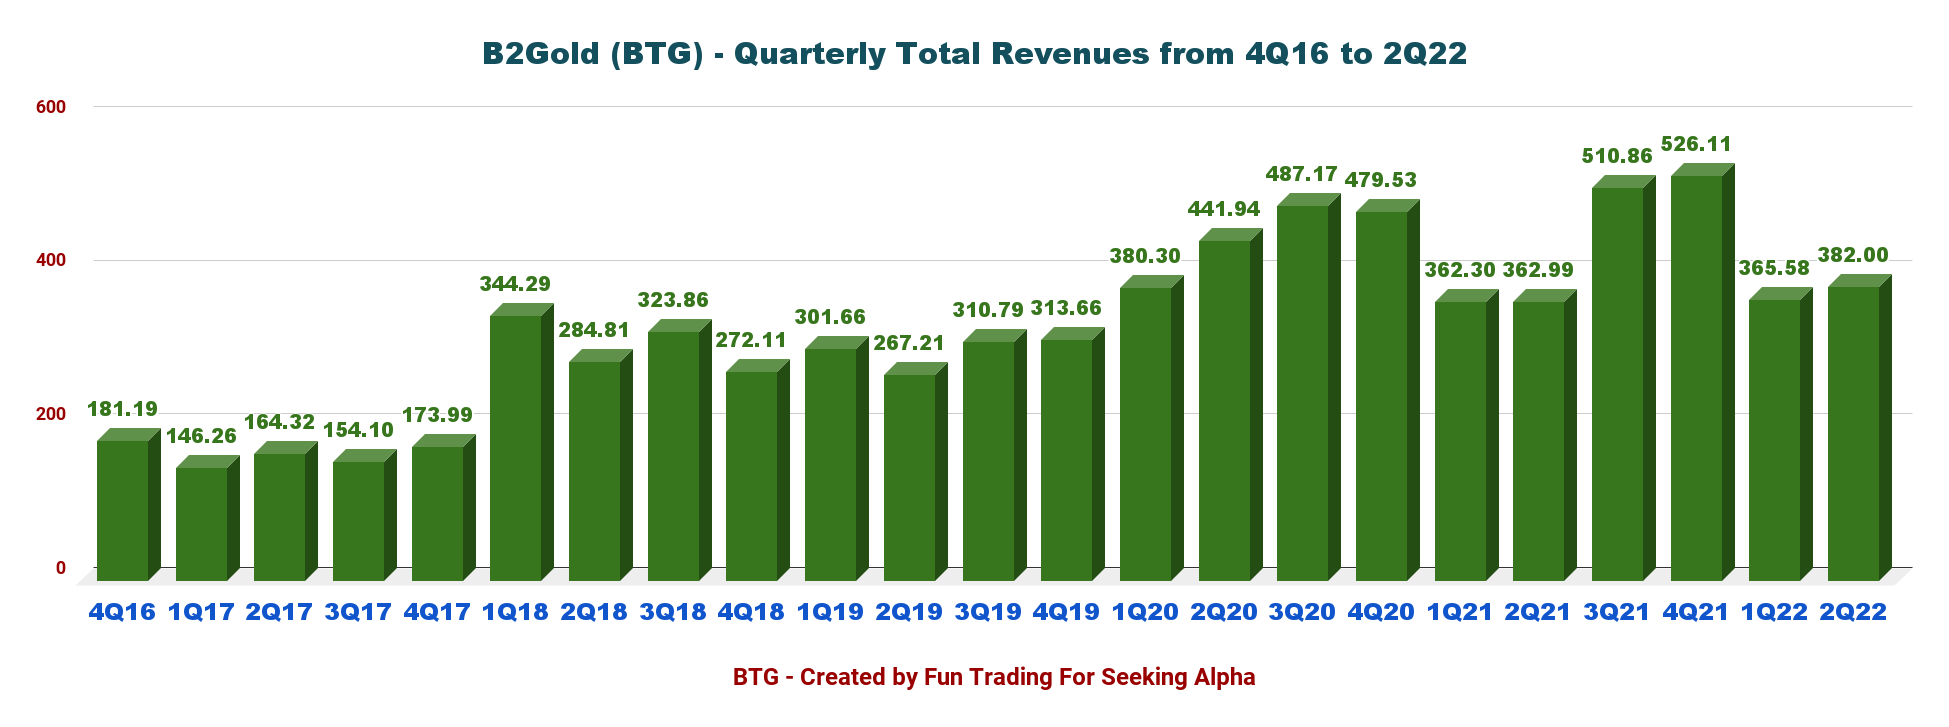
The gold price for 2Q22 averaged $1,861 per ounce, slightly below the $1,874 per ounce realized the previous quarter.
BTG Quarterly Gold price history (Fun Trading)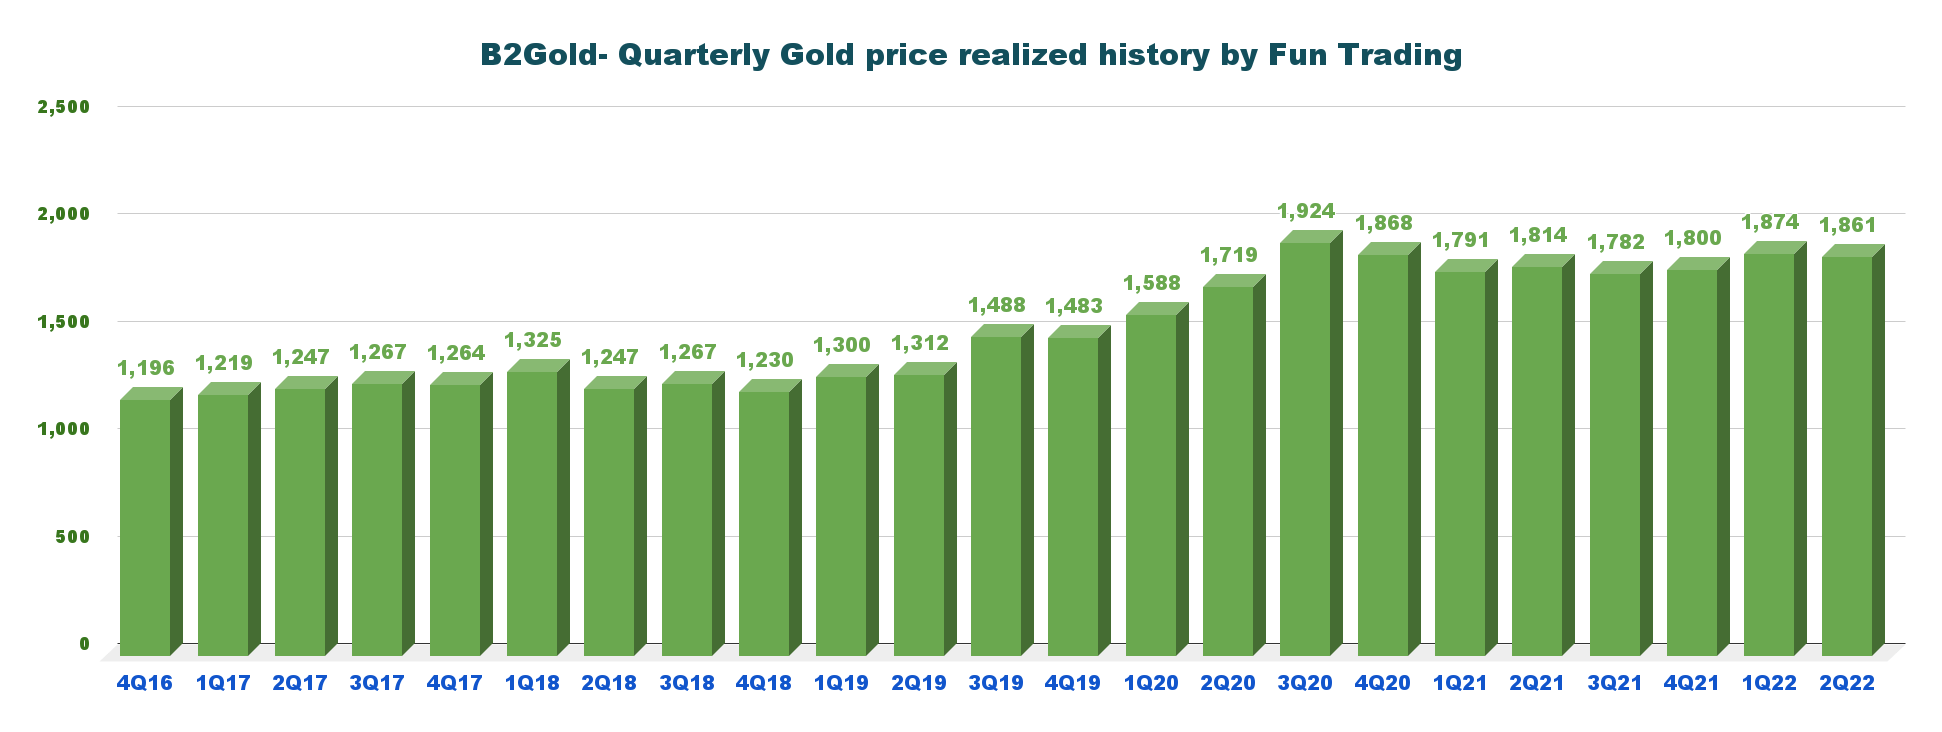
2 –Quarterly Production Analysis
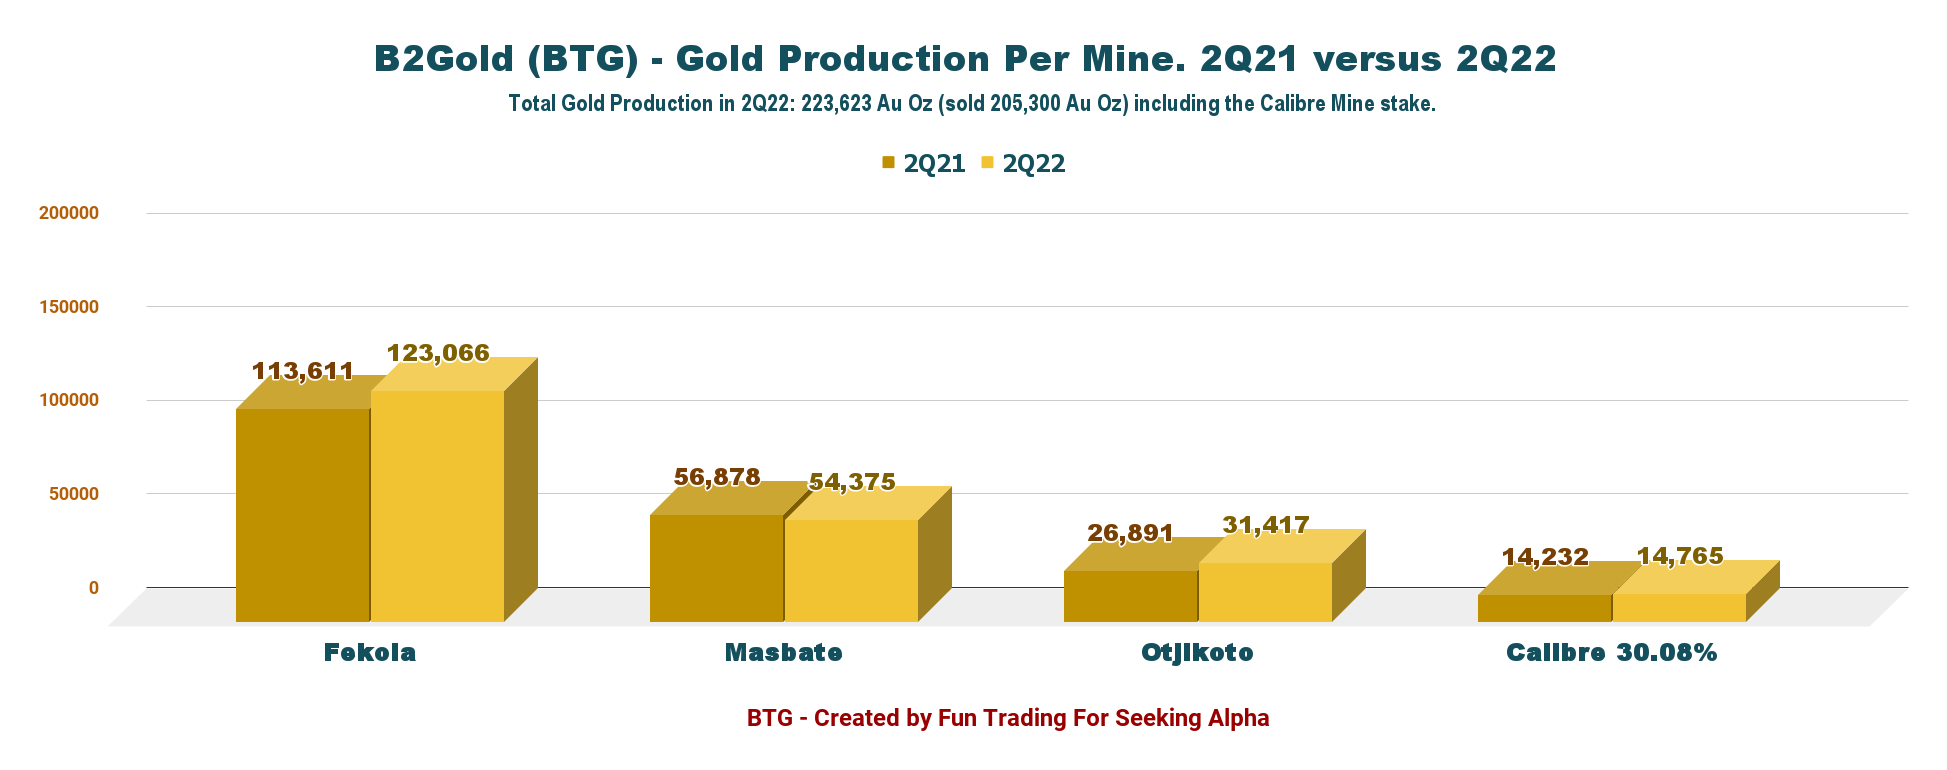
Gold production for the second quarter of 2022 was 223,623 Au Oz (including 14,765 Au Oz at the Calibre Mine). The company sold 205,300 Au Oz in 2Q22.
BTG Quarterly gold production history (Fun Trading) 2.1 – Production detail: Production comparison 1Q22 versus 2Q22 per mine. BTG Quarterly gold production per mine (Fun Trading)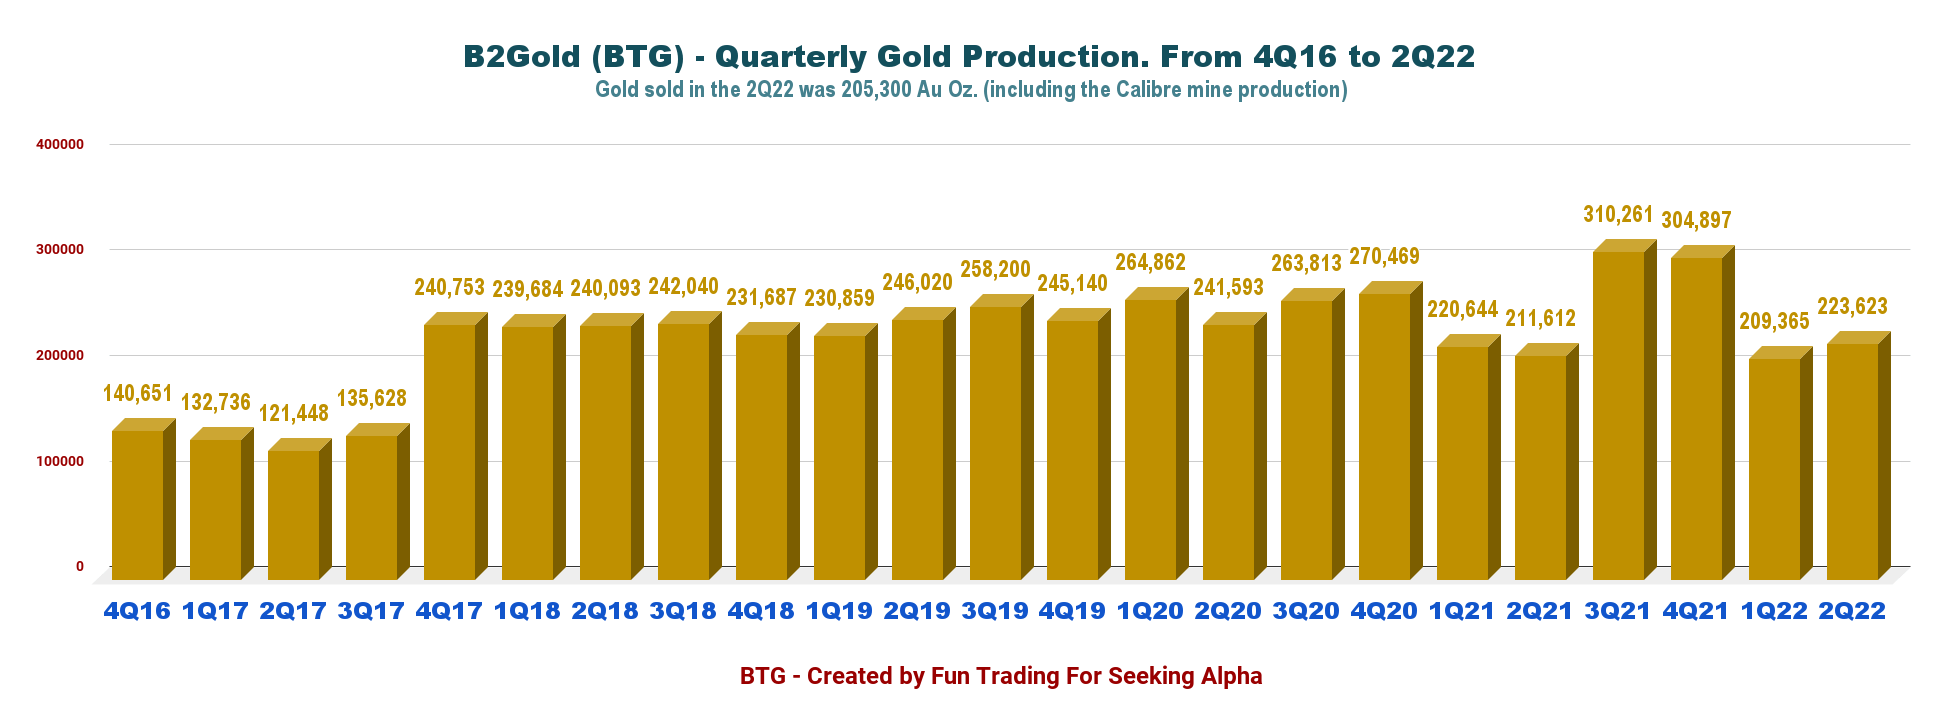
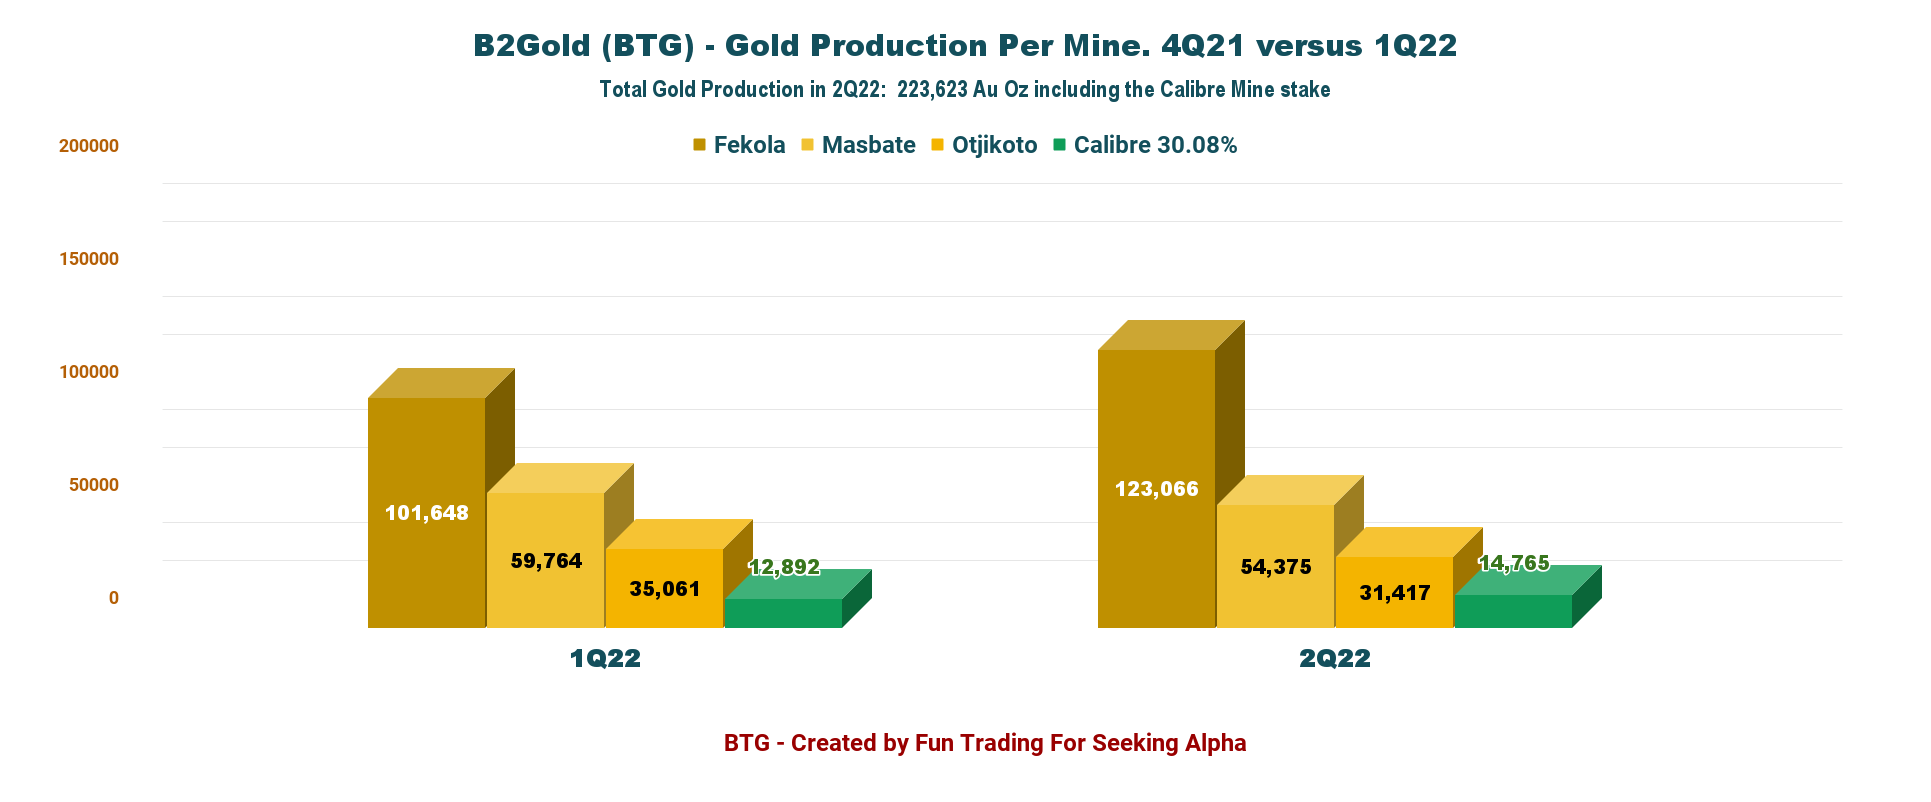
- The Fekola Mine In Mali: Produced 123,066 Au Oz. Compared to 113,611 ounces in the first quarter of 2021. The Fekola Mine continued its strong operational performance through the second quarter of 2022. Fekola’s processing facilities achieved a record quarterly throughput of 2.42 million tonnes, 8% above expectations and 6% higher than the second quarter of 2021, due to better ore characteristics and continuous grinding circuit optimization. The company also indicated that Fekola’s gold production is expected to be “significantly weighted to the second half of 2022 when mining reaches the higher-grade portion of Phase 6 of the Fekola Pit.” Fekola Mine is expected to produce between 570K and 600K Au ounces of gold in 2022 at cash operating costs of between $510 and $550 per ounce and AISC of between $840 and $880 per ounce.
- The Masbate Mine In The Philippines: The Masbate Mine had a strong start in 2022, with the second quarter of 2022 gold production of 54,375 ounces, above guidance by 2% higher than the second quarter of 2021, mainly due to higher processed grade and recoveries this quarter. Masbate Mine’s positive production performance to date is now expected to produce between 215K and 225K ounces of gold in 2022 (the original guidance range was between 205K and 215K ounces of gold), with cash operating costs of between $740 and $780 per ounce and AISC of between $1,070 and $1,110 per ounce.
- The Otjikoto Mine In Namibia: The Mine performed well during the first quarter of 2022, producing 31,417 ounces of gold, 6% below guidance. The company said that the lower than budgeted gold production in the second quarter of 2022 was due to a slower than planned ramp-up in development of the Wolfshag Underground mine, resulting in lower than budgeted mined grade. The company has changed its underground mining contractor. With this change in ore production timing, the 2022 annual production guidance range has been revised to between 165K and 175K ounces of gold (the original guidance range was between 175K and 185K ounces of gold) and AISC of between $1,120 and $1,160 per ounce.
2022 Guidance Unchanged
For full-year 2022, the company’s total gold production is expected to be between 990K-1,050K ounces (including 40K-50K attributable ounces projected from Calibre).
Total consolidated cash operating costs are between $620 and $660 per ounce, and AISC is forecast to be between $1,010 and $1,050 per ounce.
Technical Analysis And Commentary
BTG TA Chart Short-term (Fun Trading)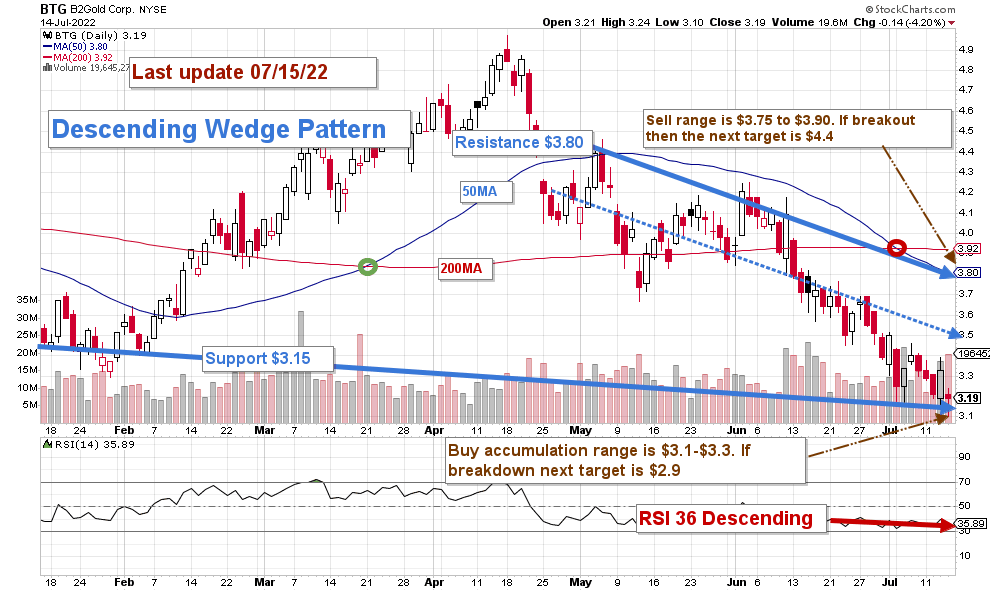
BTG forms a Descending Wedge pattern, with resistance at $3.80 and support at $3.15.
The short-term trading strategy is to trade LIFO about 50%-60% of your position. I suggest selling between $3.75 and $3.80 and waiting for a retracement between $3.10 and $3.30.
The gold price has significantly dropped in the past few weeks due to an elevated risk of a recession triggered by rampant inflation. This situation forces the FED to hike the interest rate between 75-point and 100-point, affecting the gold price and gold miners, which has already corrected from $1,850 per ounce to $1,710 per ounce.
Conversely, if the gold price can turn bullish, which is not likely, BTG could quickly break out and retest $4.40-$5.
Note: The LIFO method is prohibited under International Financial Reporting Standards (IFRS), though it is permitted in the United States by Generally Accepted Accounting Principles (GAAP). Therefore, only US traders can apply this method. Those who cannot trade LIFO can use an alternative by setting two different accounts for the same stock, one for the long term and one for short-term trading.
Warning: The TA chart must be updated frequently to be relevant. It is what I am doing in my stock tracker. The chart above has a possible validity of about a week. Remember, the TA chart is a tool only to help you adopt the right strategy. It is not a way to foresee the future. No one and nothing can.
Author’s note: If you find value in this article and would like to encourage such continued efforts, please click the “Like” button below as a vote of support. Thanks.
Be the first to comment