

CreativaImages
Thesis
Two of the most “unloved” sector ETFs of the S&P 500 (SPX) (SP500) in 2022, Consumer Discretionary ETF (XLY) and Tech ETF (NYSEARCA:XLK), could be on the cusp of their long-term bullish reversal against their relative underperformance.
In this article, we discuss why the XLK has demonstrated remarkable resilience since its recent bottoms in October, even though its leading constituents have yet to regain significant upward momentum. We will discuss the XLY in a separate article subsequently.
However, a hawkish Fed and increasingly loud recessionary calls have continued to hamper any sustained upward momentum, which could lead to an extended consolidation zone.
That’s not all that bad. A consolidation zone allows buyers to assess the opportunities to add more exposure without running the price up too quickly.
Despite that, investors should be prepared for volatility if the Fed disappoints the market significantly next week.
Notwithstanding, we discuss why significant pessimism has been priced into the XLK. Hence, buyers who can withstand downside volatility may find the current entry levels attractive, as Wall Street analysts have also turned pessimistic over the tech sector’s earnings projections.
With the Fed bringing the tech sector’s valuations back to reality, we believe the opportunity to strike looks constructive for long-term buyers.
Maintain Buy.
XLK: Investors Remain Tentative Given Its Relative Valuation
Despite the pummeling the XLK received over the past year, its forward P/E is still on the relatively high side compared to the SPX’s.
Accordingly, the XLK last traded at a forward P/E of 21.8x, well ahead of the SPX’s 17.2x forward multiple.
Therefore, despite its long-term growth potential, the market is less patient with highly-valued stocks, given the bear market. Hence, more defensive sectors and other value-based ETFs have performed much better in 2022.
Moreover, investors could be assessing the likely impact of the Fed’s terminal rate decision at next week’s FOMC meeting. Investors remain concerned over the medium-term consequences of a longer-than-expected hawkish Fed that could send the market into a deeper downturn than what has been priced in.
But, the question is whether this period of relative underperformance is set to reverse moving ahead.
XLK: Continues To Pull Down NASDAQ’s Performance
For the XLK, its performance has dragged down the tech-heavy Invesco QQQ ETF’s (QQQ) recent performance against the SPX. We discussed the bifurcation in a recent article. Hence, the critical question that investors need to ask is whether the relative underperformance could be on the cusp of a reversal moving ahead.
XLK/XLE price chart (monthly) (TradingView)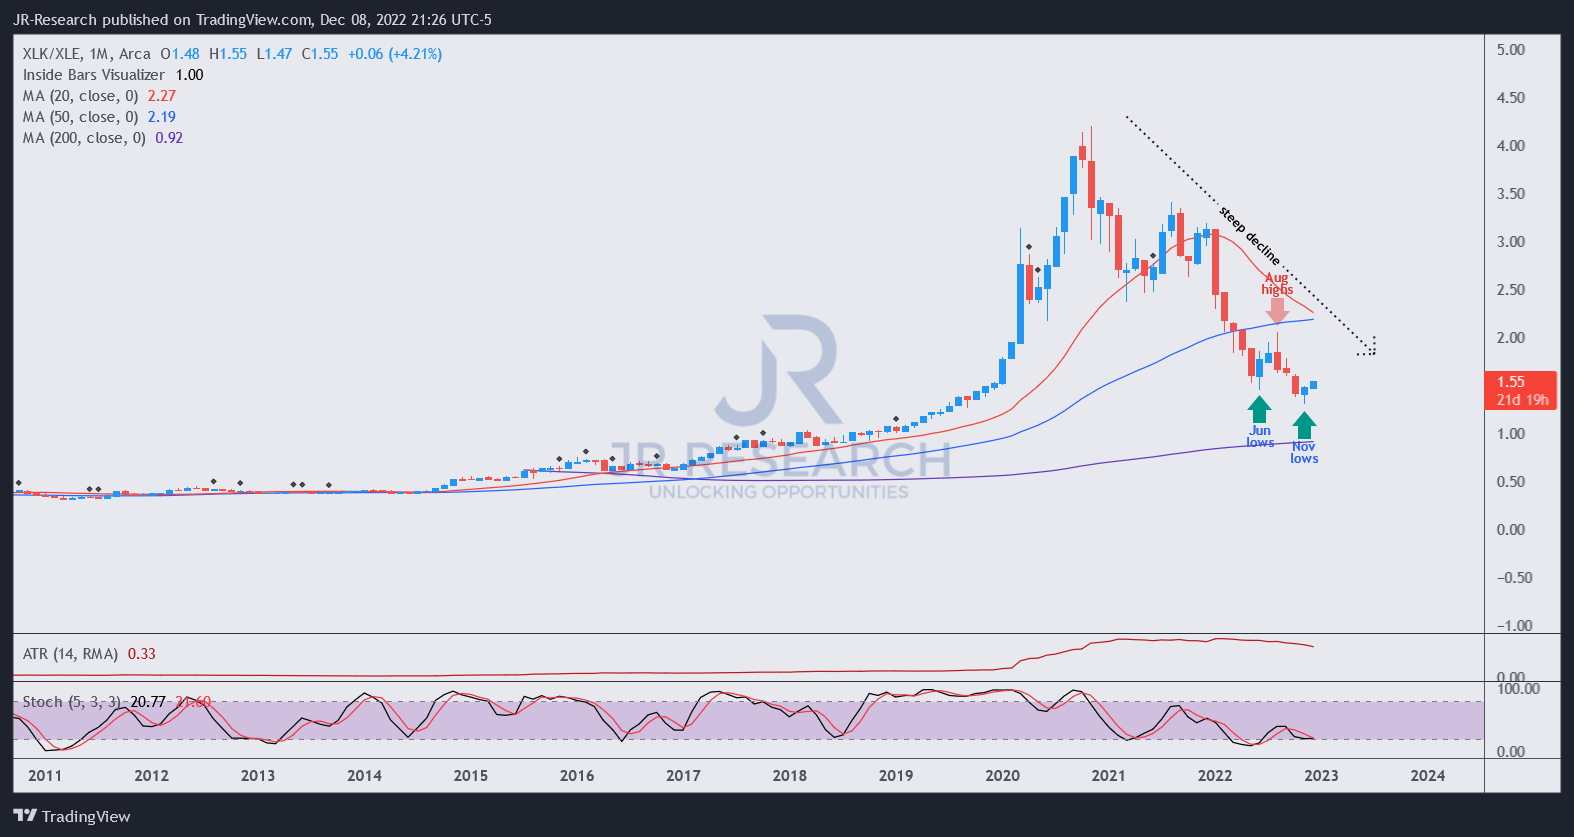
We used the long-term chart of the XLK/XLE as a basis to evaluate the potential for a reversal. The Energy Select ETF (XLE) is the S&P 500’s most impressive sector YTD, nothing a YTD total return of 58%.
With such impressive gains, we want to know whether sector rotation could occur as investors rotate their gains from XLE into relatively underperforming sectors, as they anticipate a turnaround, given this year’s bear market.
For tech, which has significantly underperformed the XLE with a -25% YTD total return, it’s critical to observe buyers coming into stanch further decline. With tech stocks having a weighting of nearly 24% in the S&P 500, a reversal could significantly lift the market from its doldrums moving forward.
And we observed the possibility as the XLK/XLE attempted to bottom out on its November lows, as seen above. However, there’s no doubt that the XLK/XLE’s long-term uptrend has weakened considerably, with the relative outperformance of the XLE.
Hence, it’s still too early to call for a “definite” reversal in the market’s bias on the XLK/XLE, but it’s looking constructive. Buyers with a strong long-term conviction of the XLK should consider capitalizing on the current dislocation to add/rotate into tech. If you wait until it potentially regains its 50-month moving average (blue line), the reward/risk profile will no longer be as attractive.
Is XLK ETF A Buy, Sell Or Hold?
Maintain Buy.
As discussed, we believe the XLK is on the cusp of reversing its relative underperformance to the market and its outperforming peers.
It’s difficult to envision such a reversal for now, as the media feeds us positive news of sectors that have outperformed significantly in 2022 and “doomsday” stories of unloved sectors like XLK.
However, if you have high conviction over the long-term performance of the tech sector, we believe the opportunity to strike with a highly attractive reward/risk looks impressive.
We will return with our analysis of the XLY subsequently.
Be the first to comment