

This time interest rates aren’t falling off a cliff. Today share prices are plunging as interest rates rip higher. DNY59/E+ via Getty Images
Get ready for charts, images, and tables because they are better than words. The ratings and outlooks we highlight here come after Scott Kennedy’s weekly updates in the REIT Forum. Your continued feedback is greatly appreciated, so please leave a comment with suggestions.
It was a wild day in the stock market on Monday. Sure, the S&P (SPY) was down almost 4%. That seems big, until you consider the mortgage REIT index declines:
- VanEck Vectors Mortgage REIT Income ETF (MORT) down 9.33%
- iShares Mortgage Real Estate Capped ETF (REM) down 9.32%
You might wonder if two ETFs are identical when their declines are that similar. No. They have an absolutely massive overlap though. Regardless, investors are better off picking individual mortgage REITs where they can get a better valuation by carefully selecting positions rather than buying blindly. Let’s get started with what caused the fall:
- Yields on MBS and Treasuries increased as investors overreacted to inflation data.
- MBS underperformed Treasuries, leading to loss of book value.
- Tons of fear created opportunities as investors freaked out about increasing rates and the recession the Federal Reserve is working to create.
We’ll run through those quickly:
Yields on MBS and Treasuries Increase
We’ll start with the 3-year Treasury:
MBSLive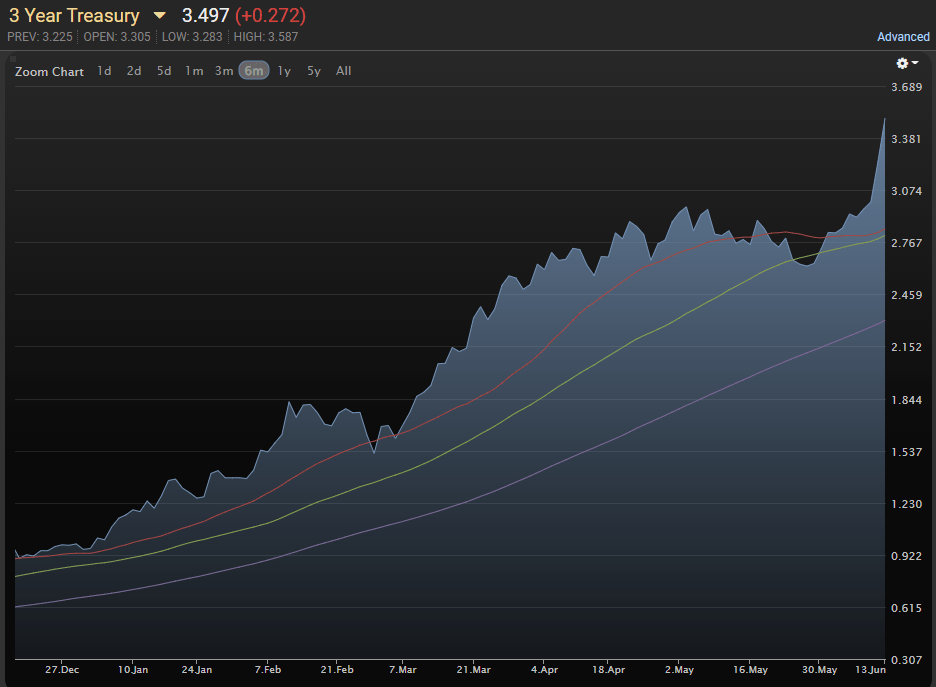
See how the rate surged higher? The recent section is the steepest part of the entire picture. Rates were soaring yesterday.
Now we can switch to an MBS. We’re going to use the 30-year fixed-rate MBS with a coupon rate of 4.5%:
MBSLive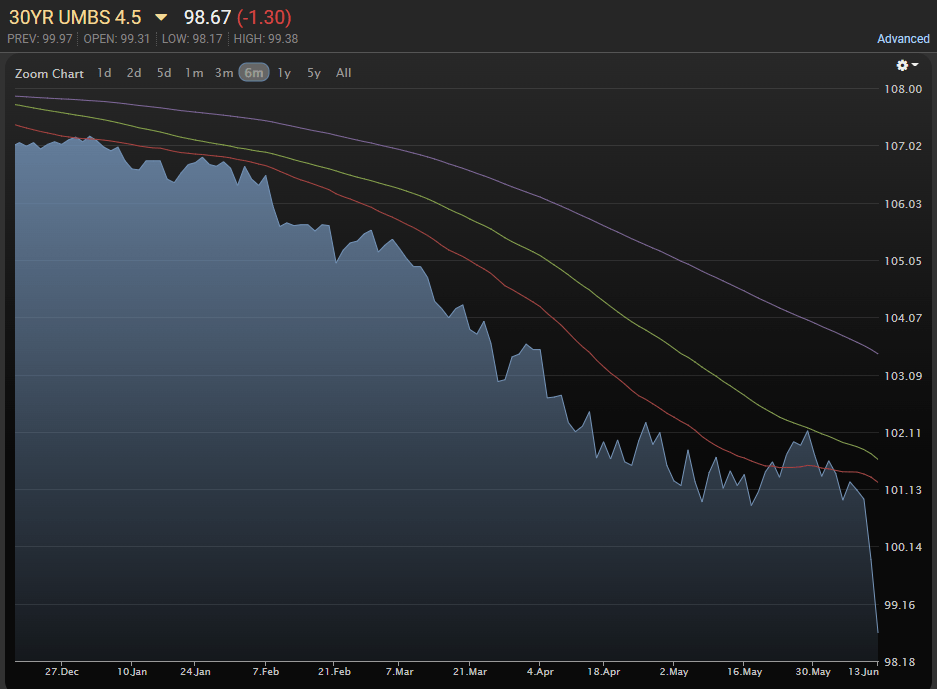
You may notice that the value trended down over the last 6 months as higher interest rates resulted in lower prices. However, it fell off a cliff over the last two days. It dropped from nearly $100.95 on Thursday to $98.67 yesterday. That’s a massive swing.
MBS Underperformed Treasuries
Notice how the 30-year MBS with a 4.5 coupon rate fell by $1.30 yesterday. That’s for $100 of face value. By contrast, the value of a 5-year Treasury dropped by about 0.97%. Normally, you wouldn’t expect a 30-year fixed-rate MBS that was trading around $101 to fall significantly more than a 5-year Treasury. Mortgage REITs hedge against movements in interest rates. Often those hedges taken the form of LIBOR swaps or Treasury Futures. However, the effectiveness of those hedges depends on how far each investment moves in value. In periods like this, we sometimes see one side swing more than the other. In early 2020, the spread between MBS and Treasuries widened. That means MBS underperformed Treasuries. In late 2020 and into 2021, the MBS outperformed Treasuries. We refer to that as tightening.
On Monday we saw rates moving higher with spreads widening. That combination drags book value lower for many mortgage REITs. Why does it drag values lower? Many mortgage REITs (not all, this is a simplification) saw asset values falling between 1.6% and 0.9% yesterday. Let’s just use 1.3% as a simple number. Then they earned some of that back on their hedges. Let’s say 0.8%. Keep in mind that these are not the numbers for one mortgage REIT. It’s just an example. If the mortgage REIT was running with 7 turns of leverage ($800 invested on $100 of equity), they would’ve lost 10.4% of equity (before hedges) from the decrease in asset prices. On the other hand, their hedges would’ve generated a gain worth 6.4% of their equity.
In that scenario, the net impact would’ve reduced book value by 4%.
Was every mortgage REIT hit that hard? No. Were some hit that hard? Probably. When will we have a better idea? We get updated estimates through Scott Kennedy each week. The losses in book value from Friday of last week are already included in our models. This next weekend we’ll have the moves for this week worked in as well.
So Much Fear
Are recessions scary? Sure, a bit. They aren’t all the Great Financial Crisis. They aren’t even the pandemic. This recession looks particularly bland. Compared to the prior events, this is one is about as exciting as waiting in line at the post office. If they made a film about this recession, it would get about as many views as a Facebook video of the fourth best elementary school musical in a small city.
Yes, we have high inflation. Yes, the Federal Reserve is hiking into a recession. No, the world is not ending. We still have relatively low unemployment, which is nice. Even if unemployment increased by 100 basis points, it wouldn’t be high. That’s important because it means goods and services are still being produced. The market is continuing to function.
Contrast today’s recession to the GFC. In the GFC, unemployment was high and 1 in 4 homes was underwater. Earnings were slaughtered because so many companies were invested in mortgages that were in default, requiring huge write-downs. People with no job and negative home equity had no money to spend. That hammered demand. It was nasty.
Contrast today’s recession to the pandemic. Lockdowns drove unemployment up. Either negligence or malice (I won’t claim to know which and don’t think it can be proven) at some levels of government contributed to a liquidity crisis. To prevent widespread homelessness, evictions were banned. Remember that? How many people claimed apartments were completely uninvestable? Turns out the ban on evictions was a giant nothingburger for apartment REITs (as we predicted). The vast majority of residents still paid rent as agreed and the actual challenge was a drop in occupancy and rental rates, though both roared back by late 2021.
Can Anyone Survive Higher Rates
Remember what happened to interest rates in Q1 2022?
I’ll give you a hint: They went up.
Remember what New Residential (NRZ) reported?
NRZ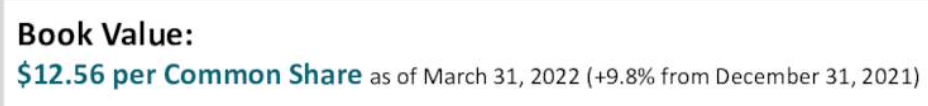
But what about April? Interest rates increased even more in April 2022. Did NRZ die in April 2022?
Let’s review what Michael Nierenberg (the CEO) said on the earnings call:
During the quarter, our book value increased to $12.56. Currently, our book value sits at approximately $13.50. We have interest rate hedges in place, which protect our long duration assets, along with our MSR portfolio, which should only help to increase our book value as we go forward based on expected Fed actions. We have increased our cash and liquidity levels to $1.7 billion. We will be patient as we look for opportunistic investments across the financial services sector. We believe patience will be rewarded in these markets and the first quarter was a great example of our diversified business.
Do my eyes deceive me? I believe that $13.50 is actually an even bigger number than $12.56! NRZ delivered an outstanding report followed by even better news on the earnings call.
I’m highlighting NRZ because it gets a fresh bullish rating. Shares got absolutely pummeled Monday. They fell 16.74%. They are down 22.9% from their 52-week high and most that decline was yesterday. That 52-week high was set on May 4th, 2022, just one day after the market saw NRZ’s Q1 2022 results and heard from NRZ about their gains in April.
Monday’s decline looks like a massive overreaction.
Added Shares
We had a small position in NRZ prior to the plunge. We more than doubled that position yesterday. I believe NRZ will rally back. They closed at $9.05 yesterday and that simply looks far too low for a REIT that was intentionally carrying extra liquidity and succeeded as interest rates increased.
Higher rates are bad for their origination business, but they are excellent for the MSRs (mortgage-servicing rights). That’s why NRZ was able to perform so well during the last few quarters. Q1 2022 was an outlier for the size of the gain, but NRZ reported small increases in book value during Q4 2021 and Q3 2021. Higher rates have not been able to sink them.
Are they the only mortgage REIT trading at an attractive valuation today? Absolutely not. However, they are the one we added to on Monday.
When we place trades, we send a real-time alert to members of the REIT Forum. We are explicit about our outlook and what we’re looking to buy, so our moves rarely surprise members. You could track if we added or closed a position in our public article by seeing the list in our disclosures. However, the disclosures don’t indicate the size of the position. Given the magnitude of the drop in NRZ and our status covering the shares, I felt it was appropriate to let all our readers know that we more than doubled our position yesterday.
Since shares bottomed out right at the end of the day (after our purchase), we’ve got a modest unrealized loss on the position. That’s fine. We bought shares at $9.40 (rounded up) and I expect we will turn a healthy profit on that choice. At $9.05, shares are even better.
The REIT Forum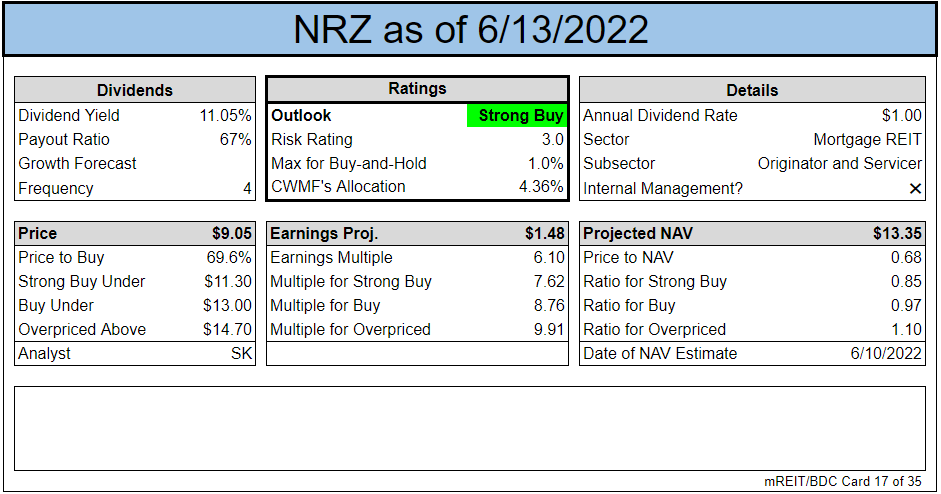
In Monday’s trade alert, we also expanded some other positions and closed a few more. Overall, we were buying more than selling and the sales were just to free up capital for the buying. When volatility picks up, we want to make a few decisive moves to take advantage of the shift in the risk/reward profiles. Looking at NRZ, we believe the market got it wrong. They’ve got it wrong before. My open positions still include 737 shares of New Residential bought on 4/6/2020 at only $3.49.
Counting the dividends, that position is up over 200% even after yesterday’s fall. I don’t think we will see that kind of weakness again. This recession just isn’t nearly as scary as the GFC or the pandemic.
For that one person who gets confused about which REIT position we more than doubled, it was NRZ. That’s the ticker for New Residential. Clear enough?
Will the Federal Reserve Save Us?
No. Who would they save us from? They are pushing for a recession in the interest of reducing inflation. Can they tame inflation? No. They might have a modest impact (by creating a recession), but the major factors are still on the supply side of the equation. They have minimal impact on supply.
When supply improves, inflation should drop significantly. When that happens, expect the Federal Reserve to take credit with the confidence and accuracy of a child who thinks they drove the car from the back seat.
The rest of the charts in this article may be self-explanatory to some investors. However, if you’d like to know more about them, you’re encouraged to see our notes for the series.
Stock Table
We will close out the rest of the article with the tables and charts we provide for readers to help them track the sector for both common shares and preferred shares.
We’re including a quick table for the common shares that will be shown in our tables:
Let the images begin!
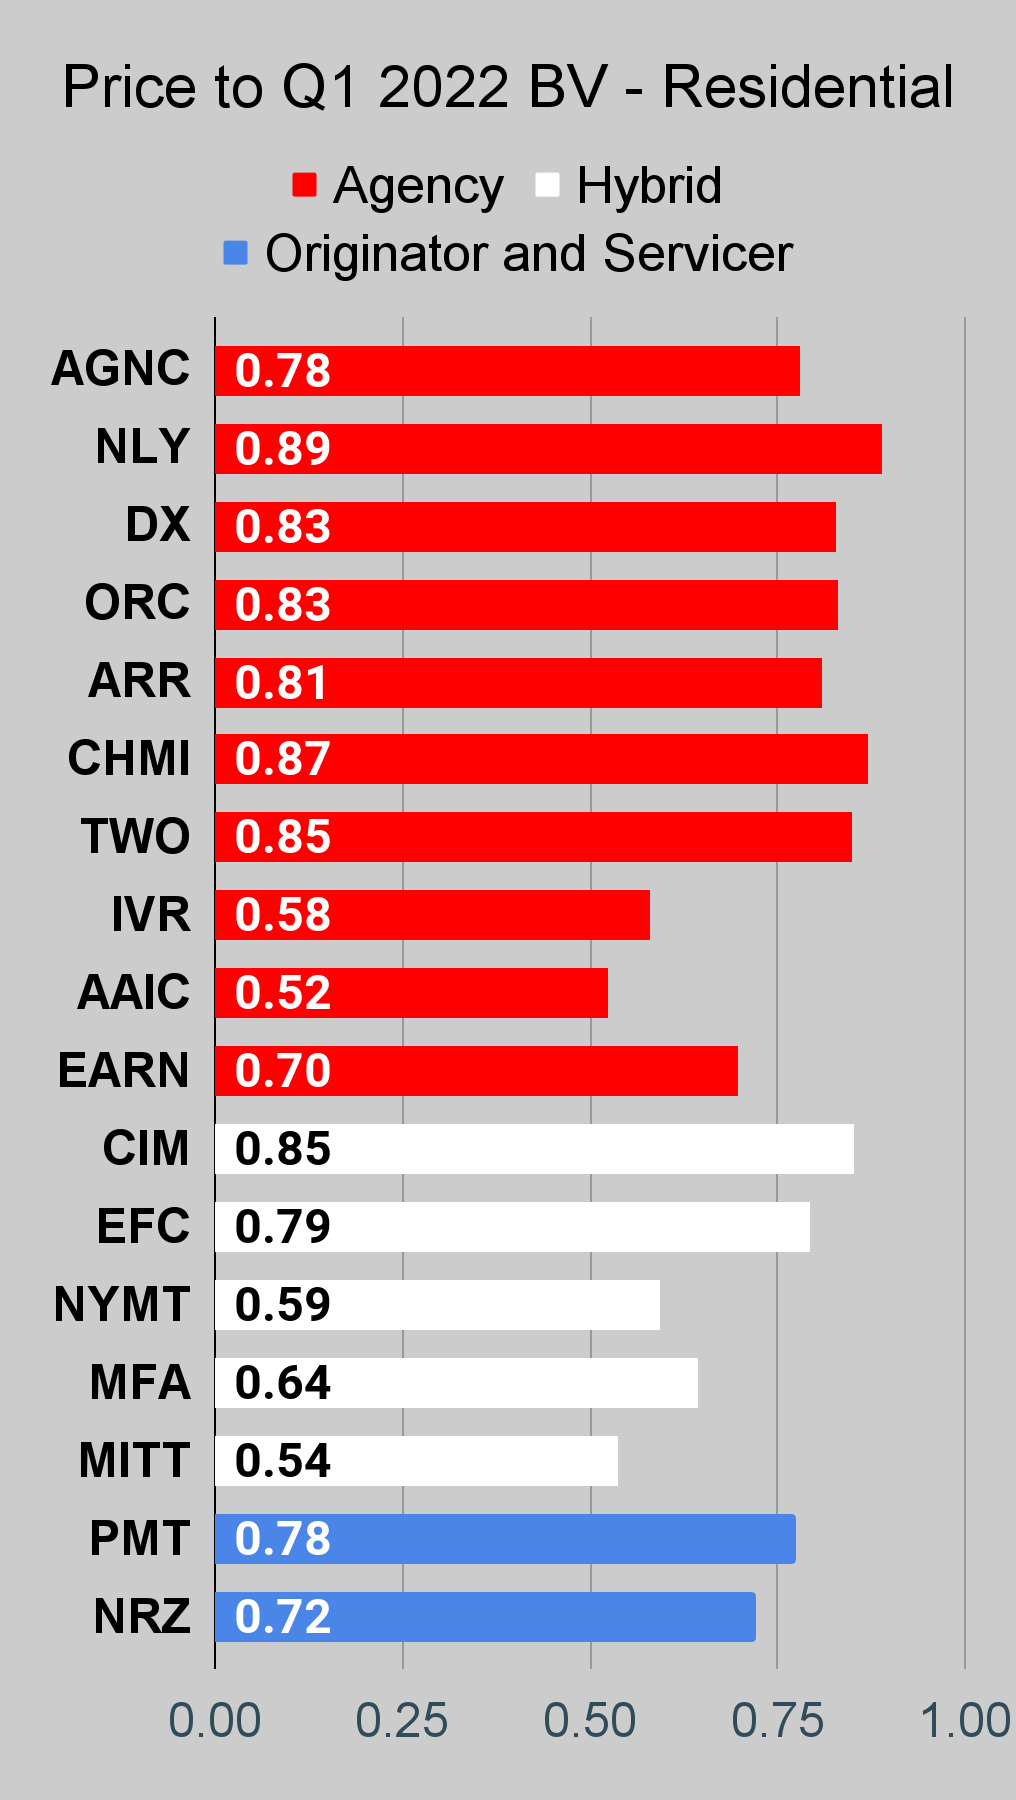
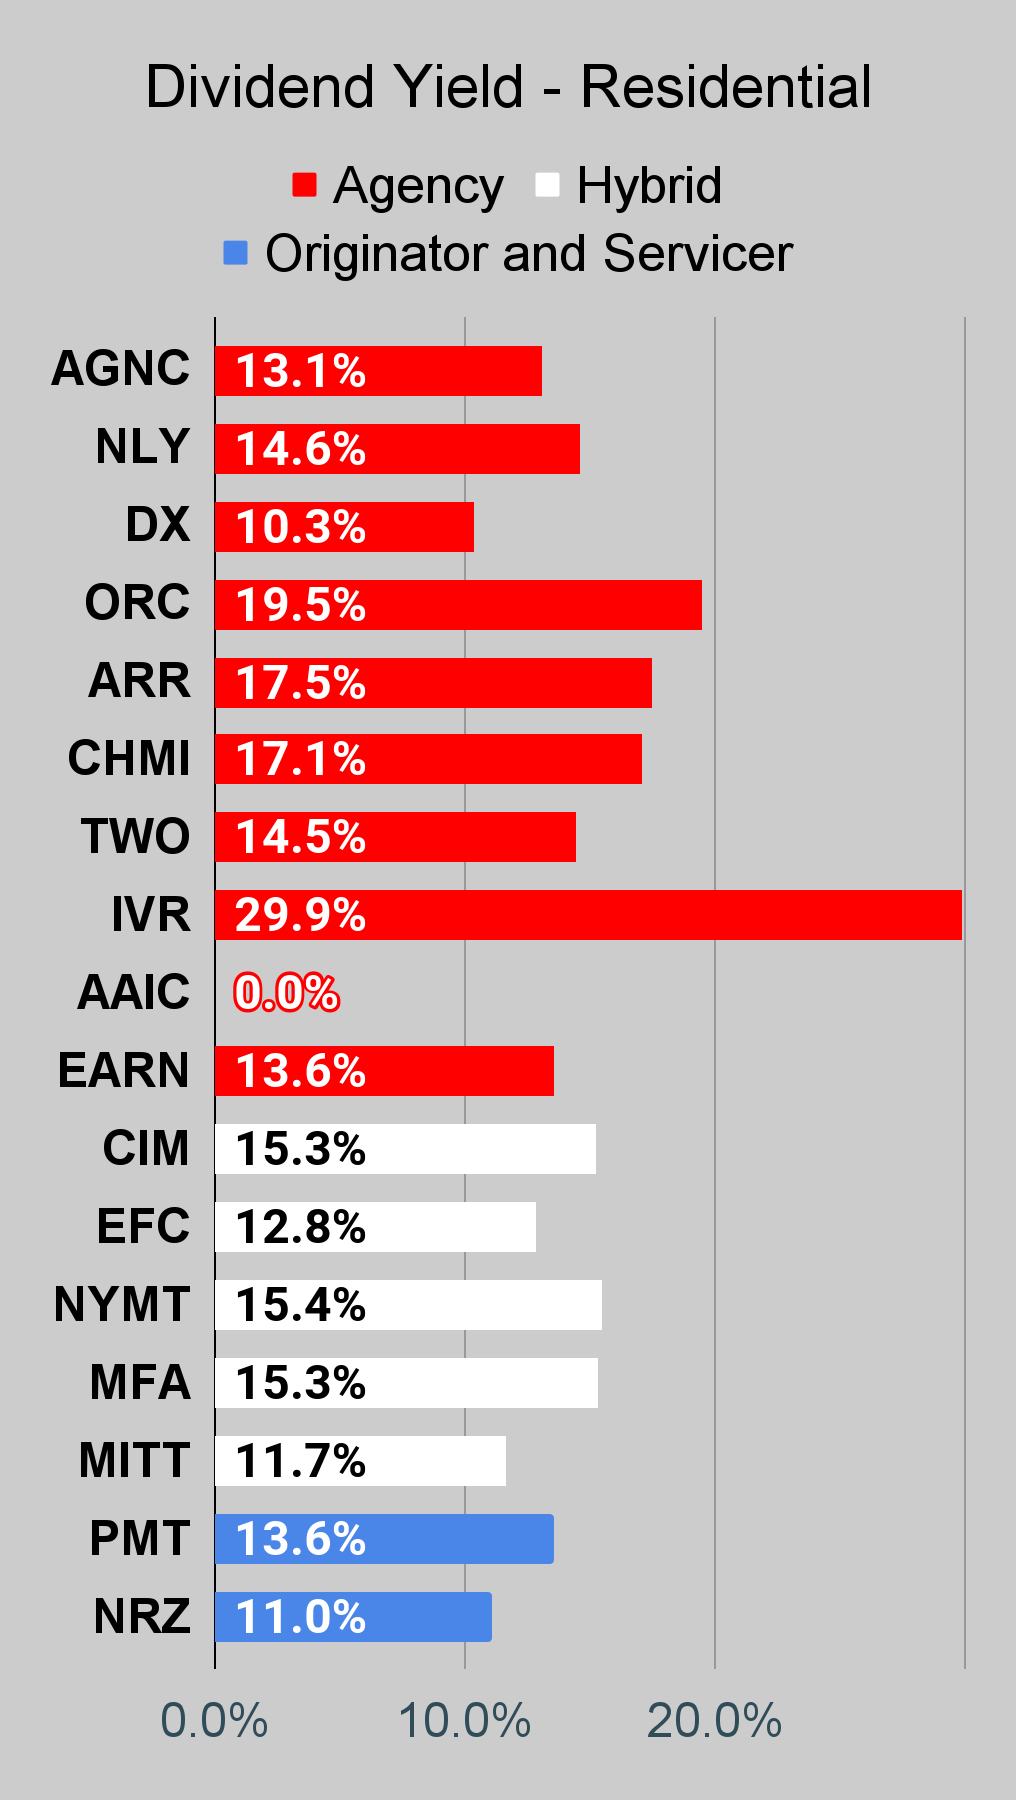
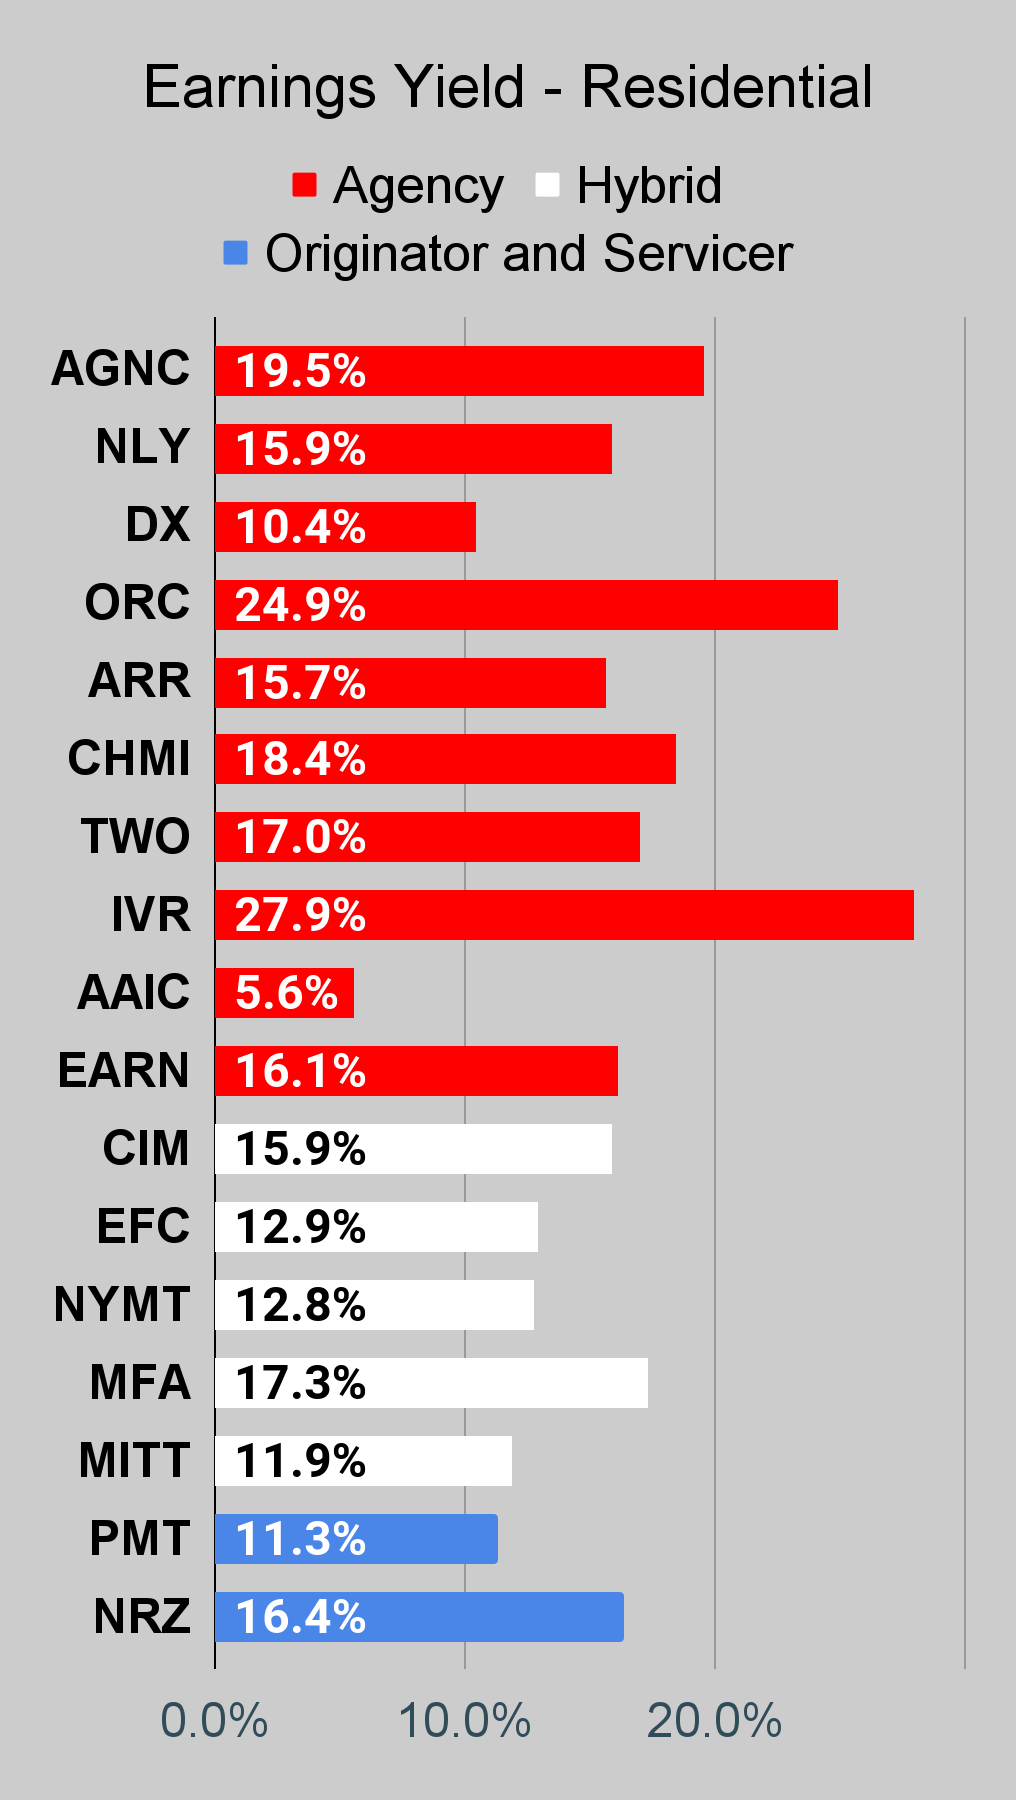
Residential Mortgage REIT Charts
Note: The chart for our public articles uses the book value per share from the latest earnings release. Current estimated book value per share is used in reaching our targets and trading decisions. It is available in our service, but those estimates are not included in the charts below.
 The REIT Forum |
 The REIT Forum |
 The REIT Forum |
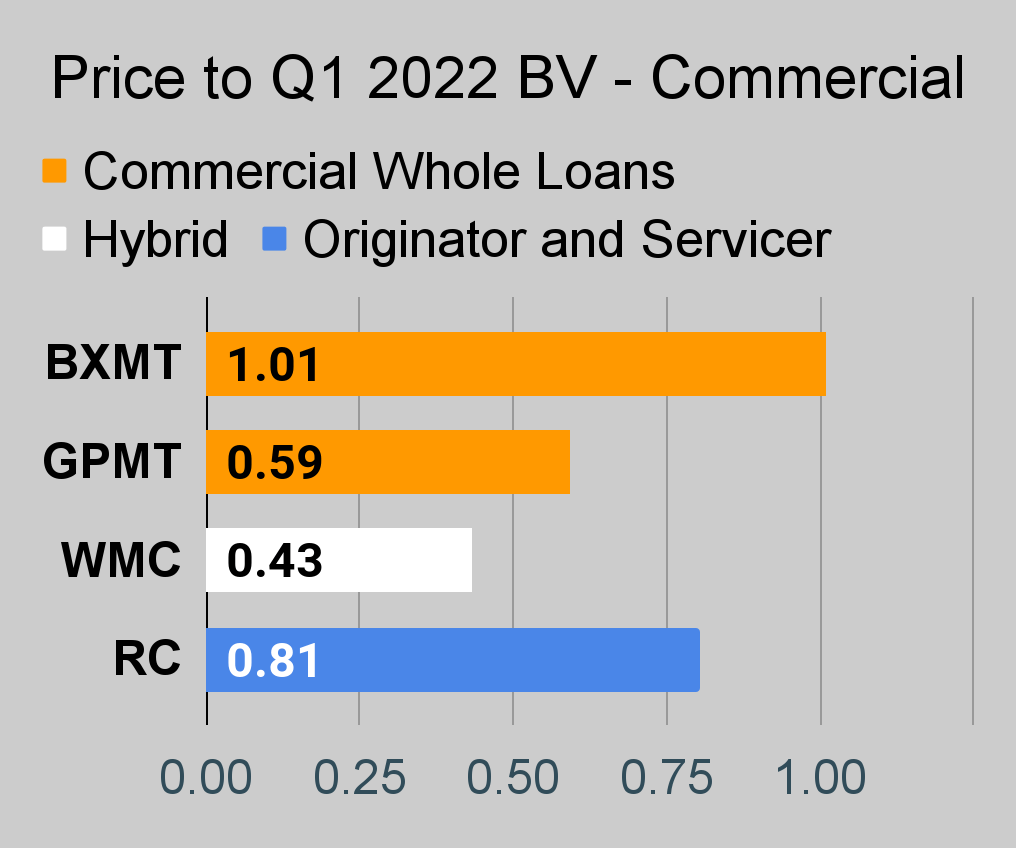
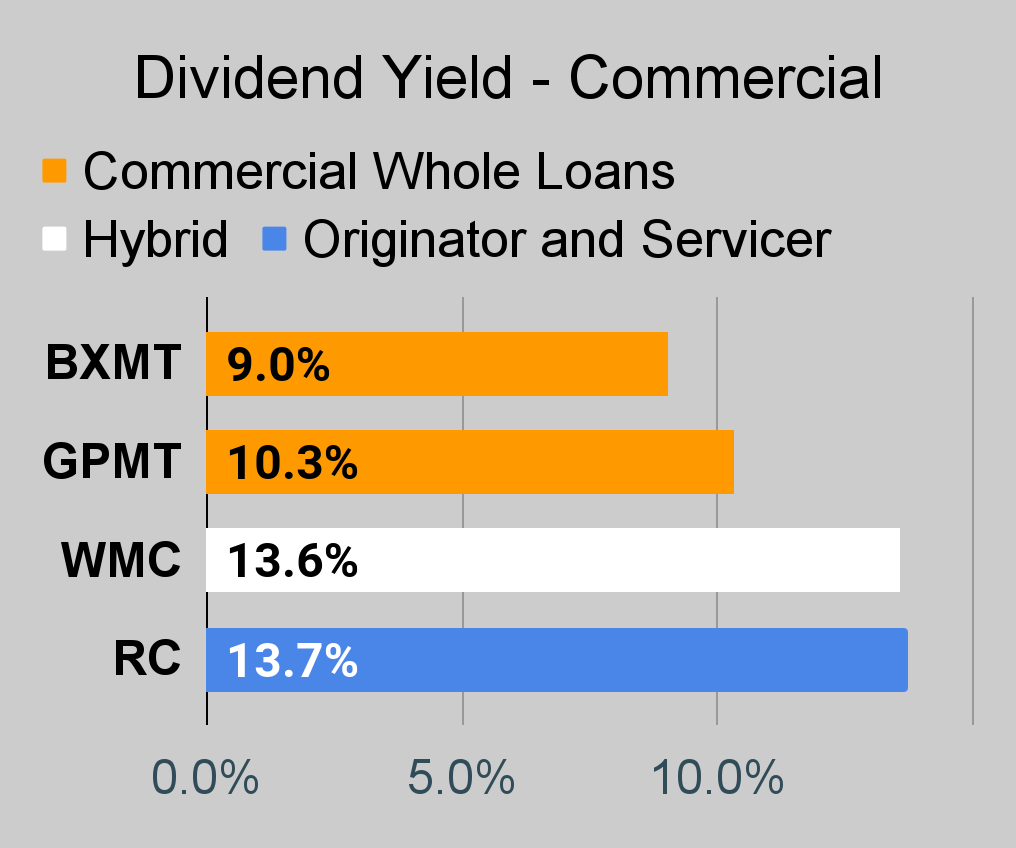
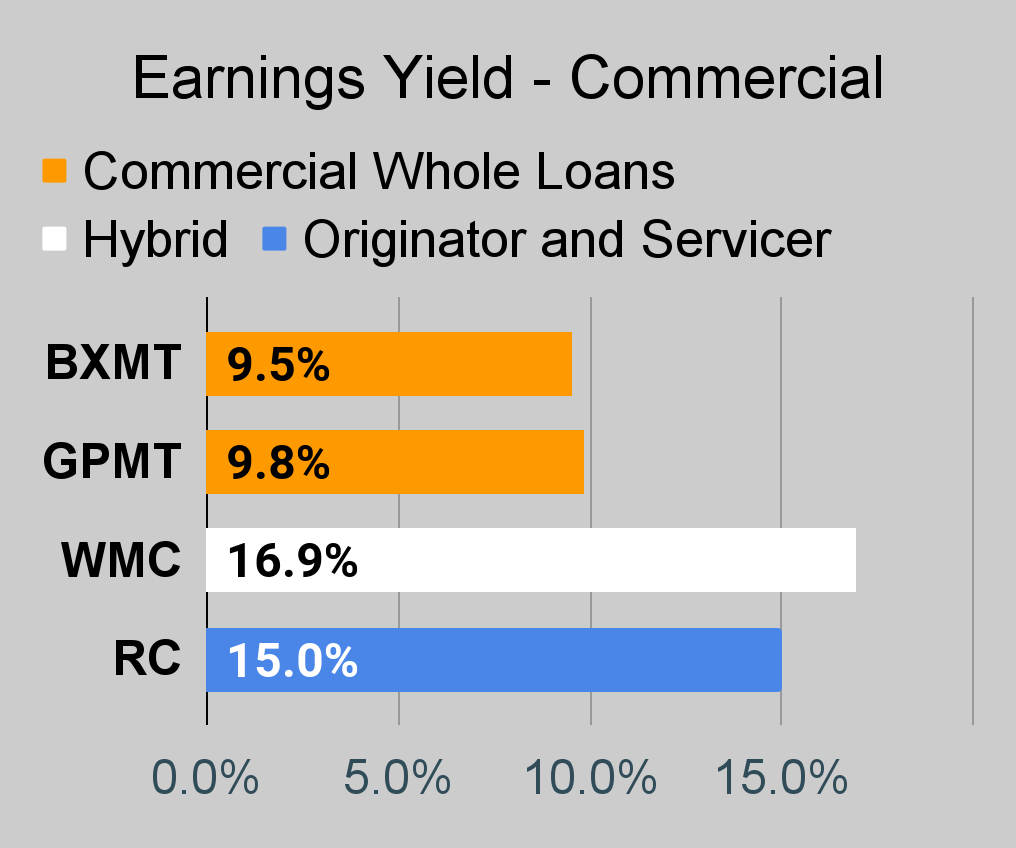
Commercial Mortgage REIT Charts
 The REIT Forum |
 The REIT Forum |
 The REIT Forum |
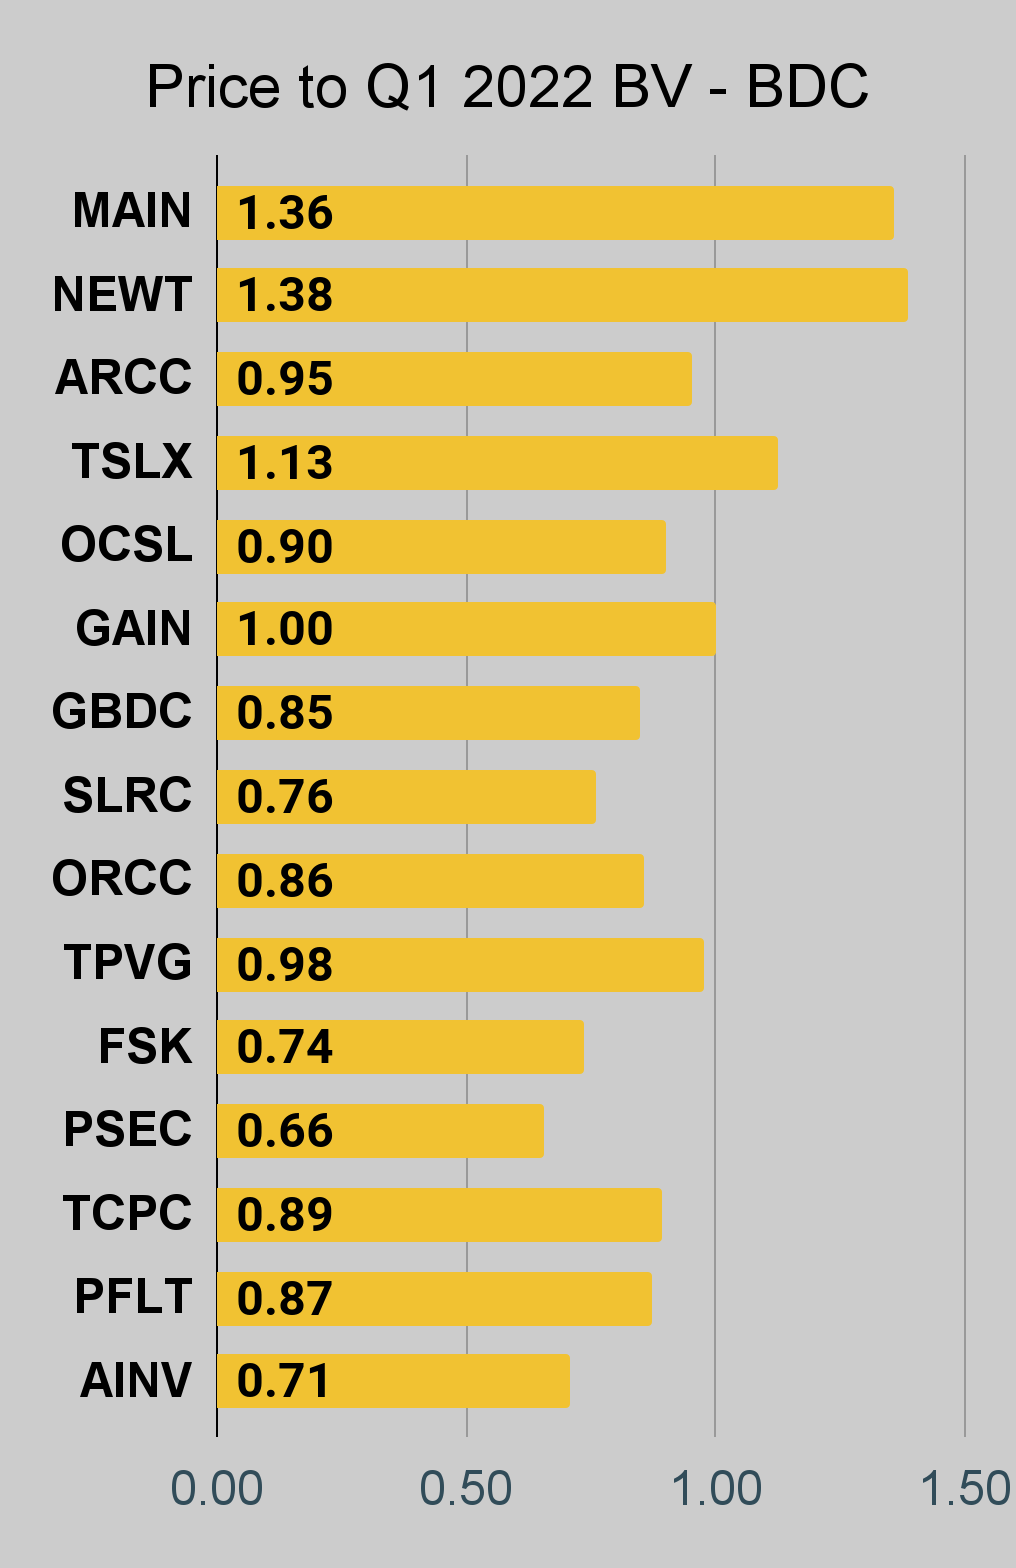
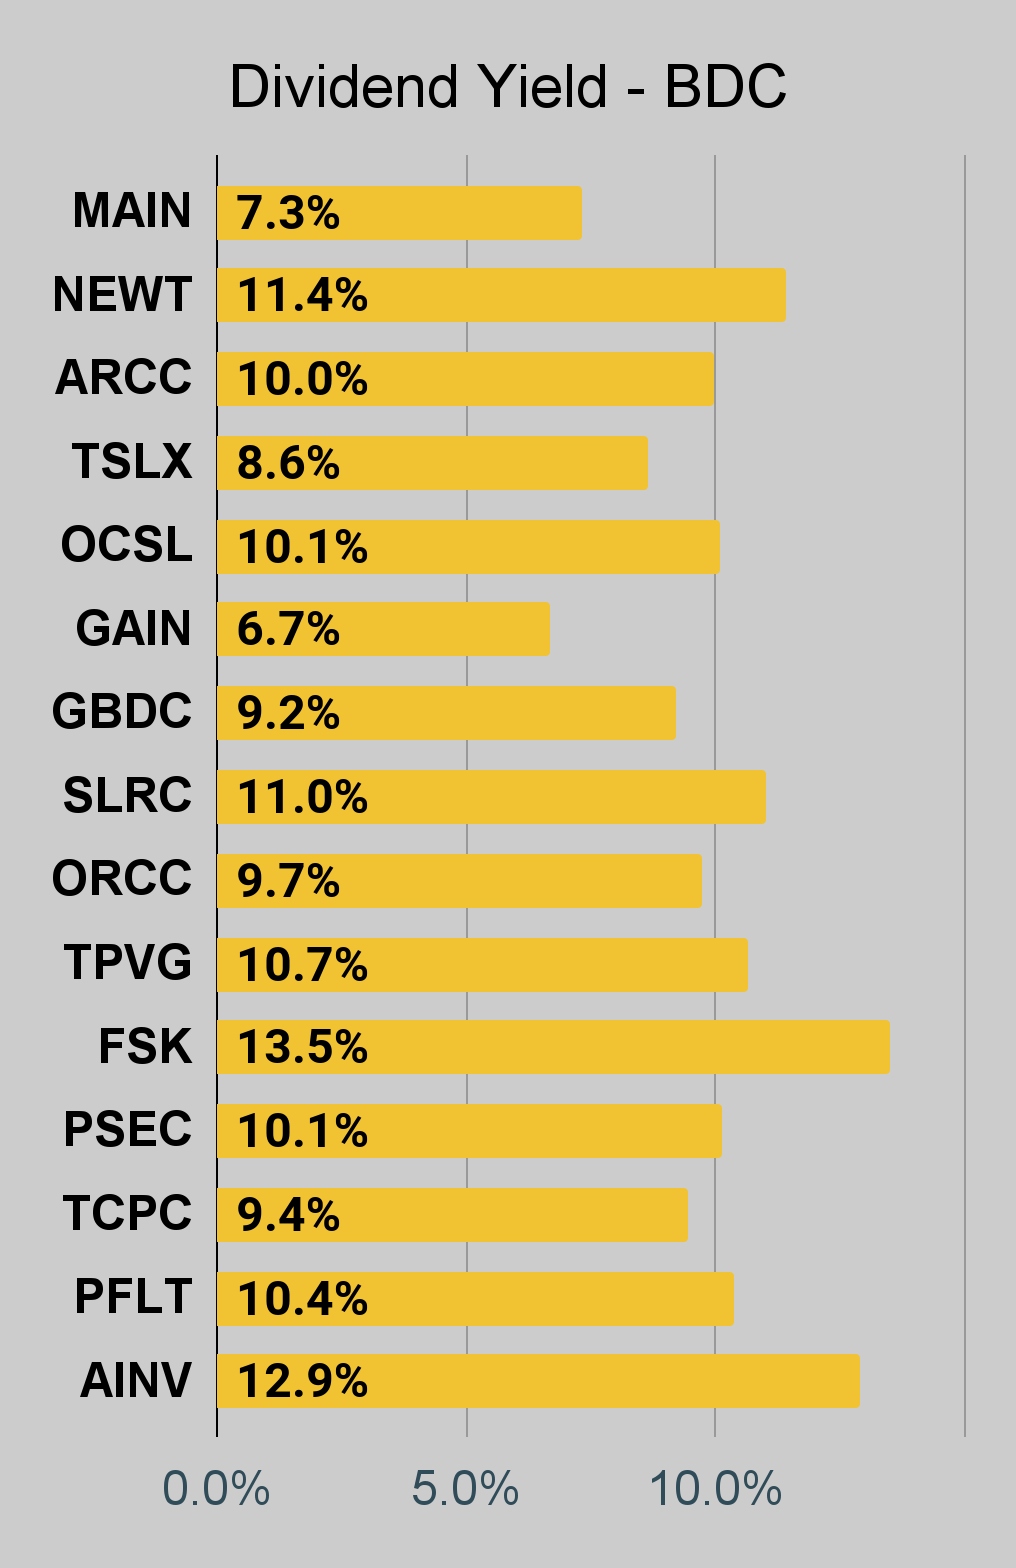
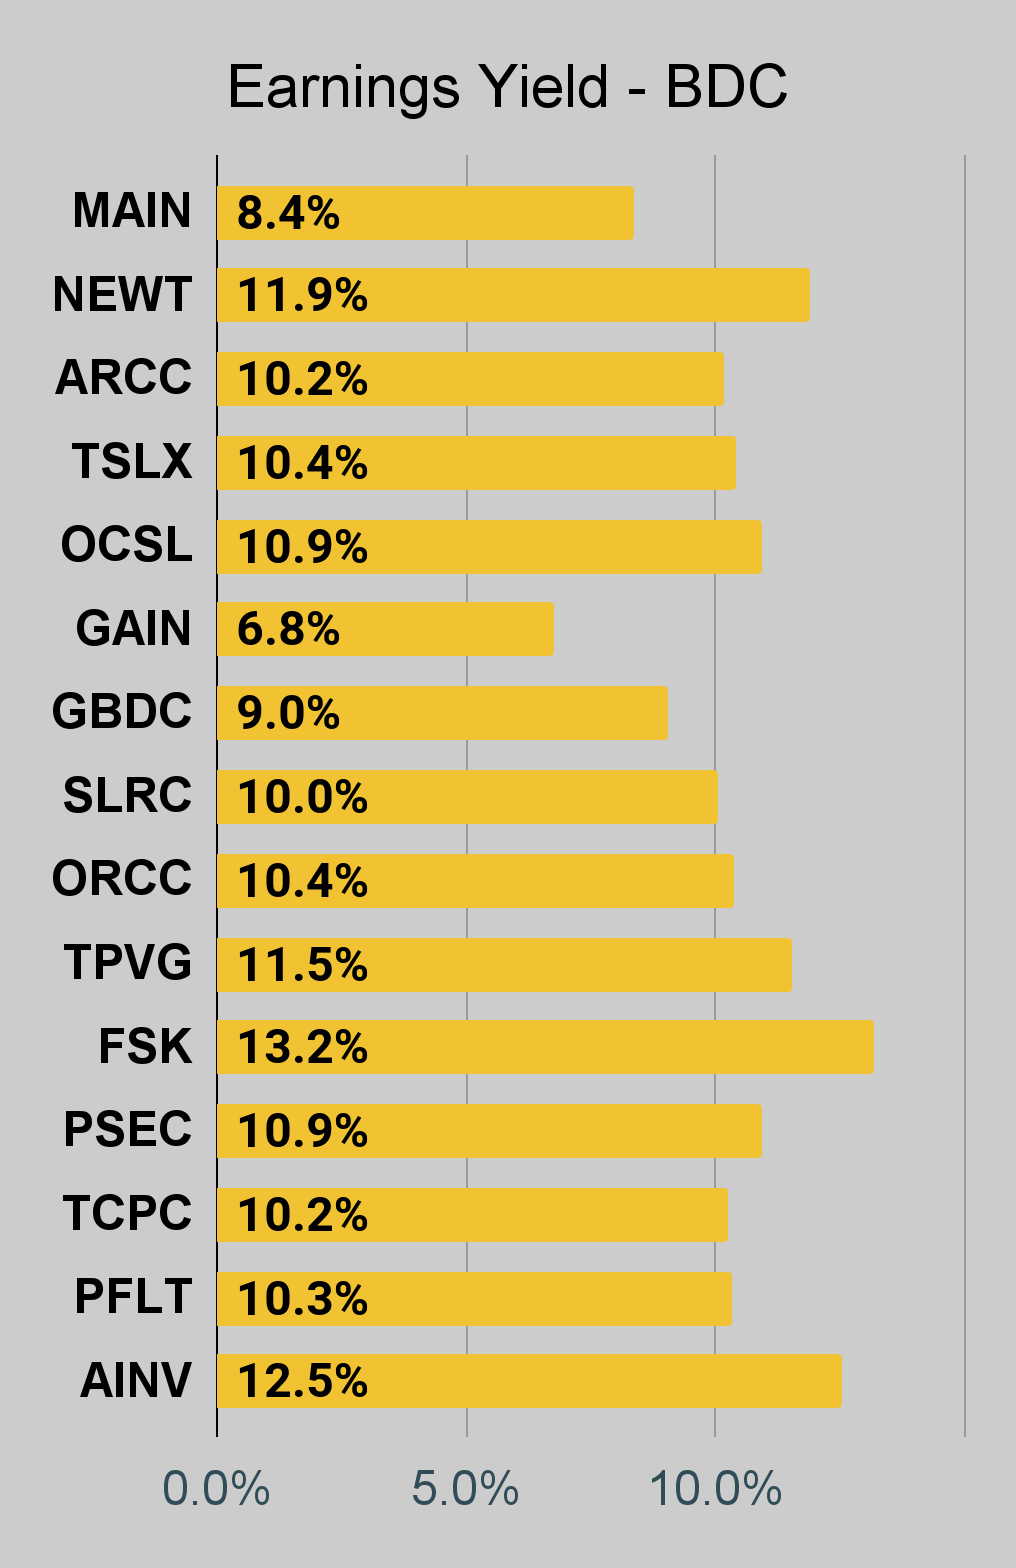
BDC Charts
 The REIT Forum |
 The REIT Forum |
 The REIT Forum |
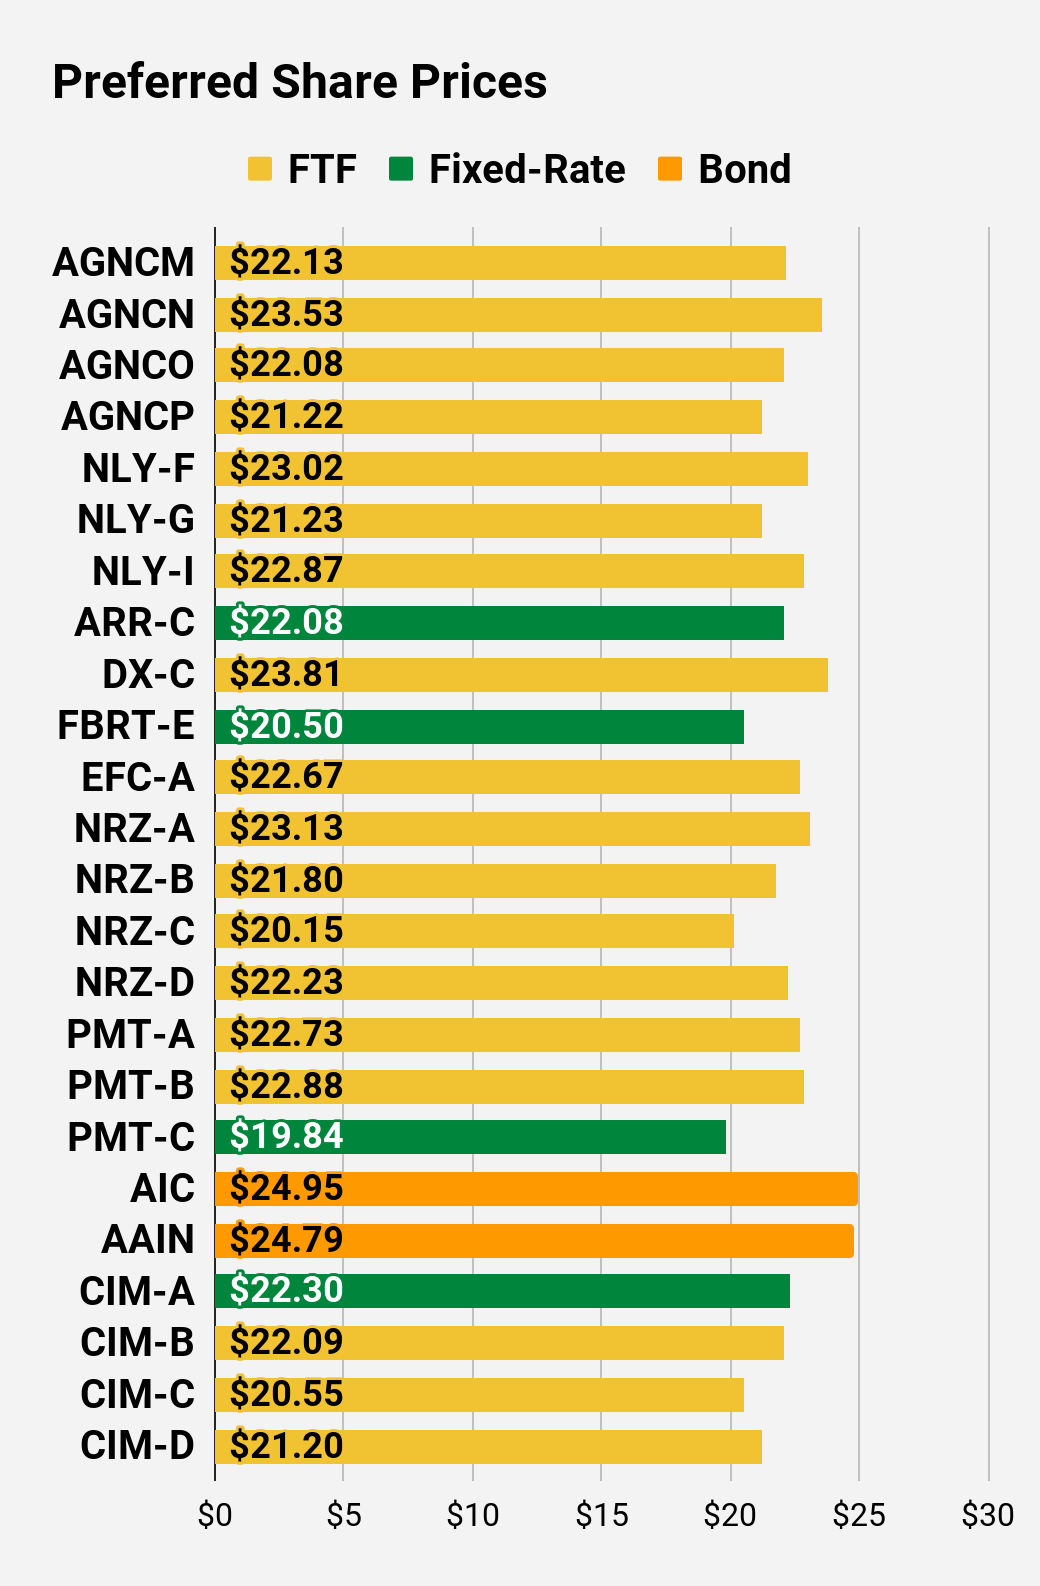
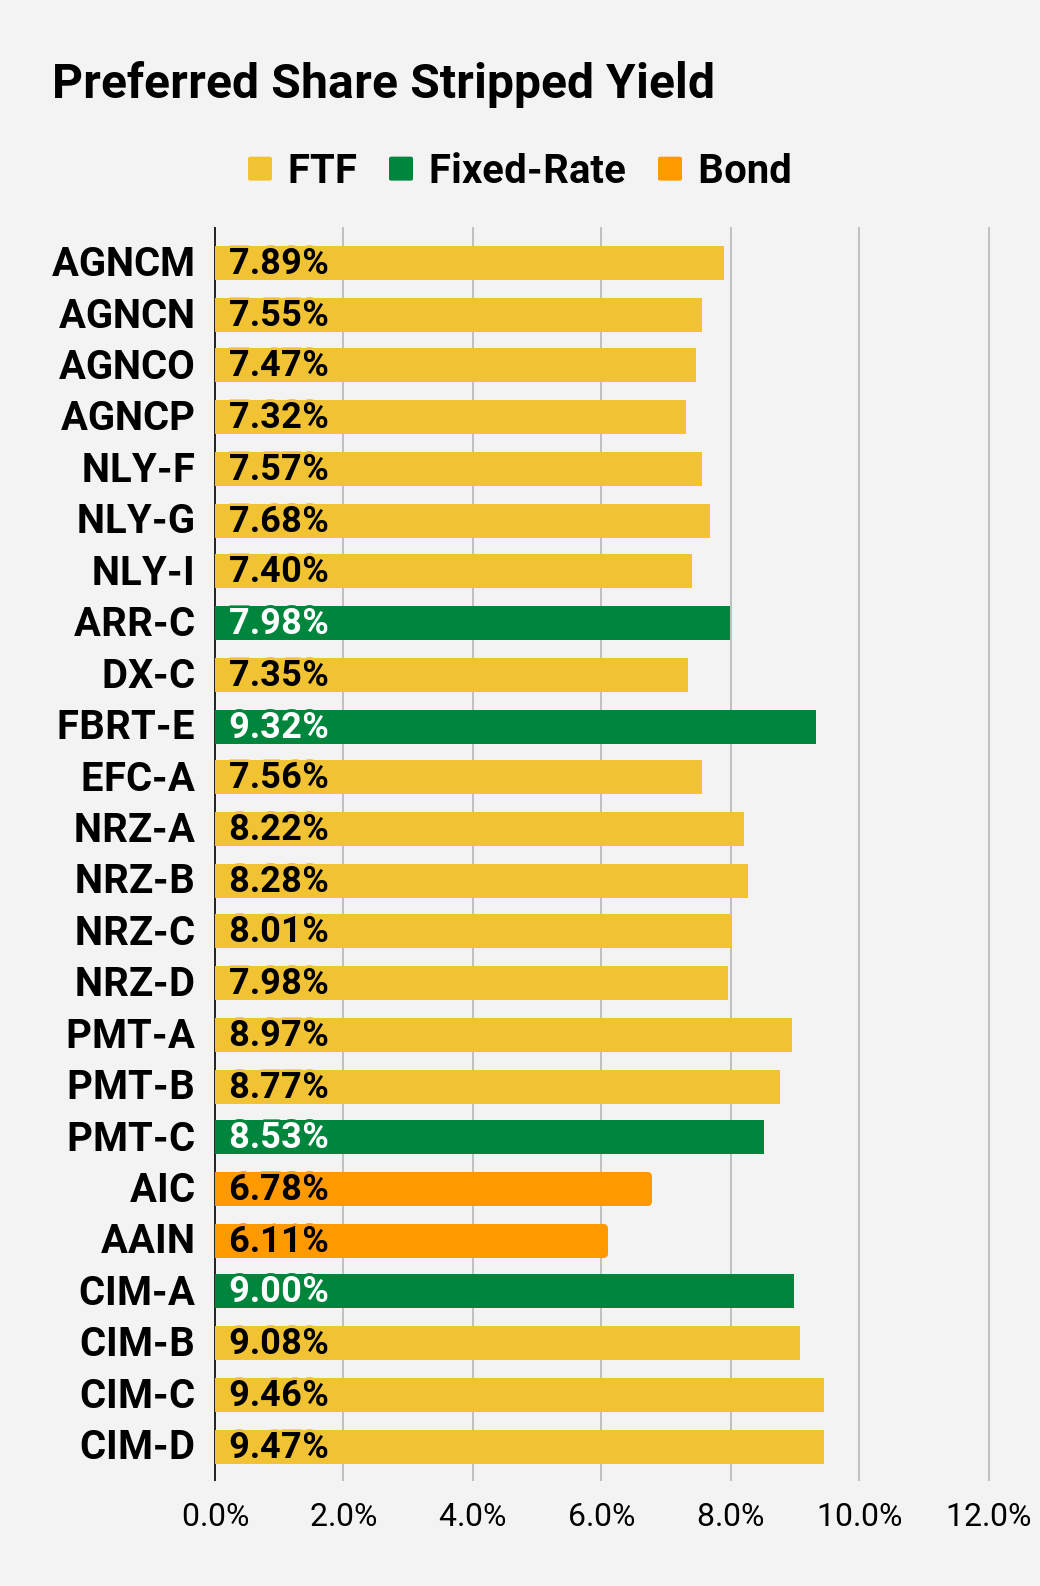
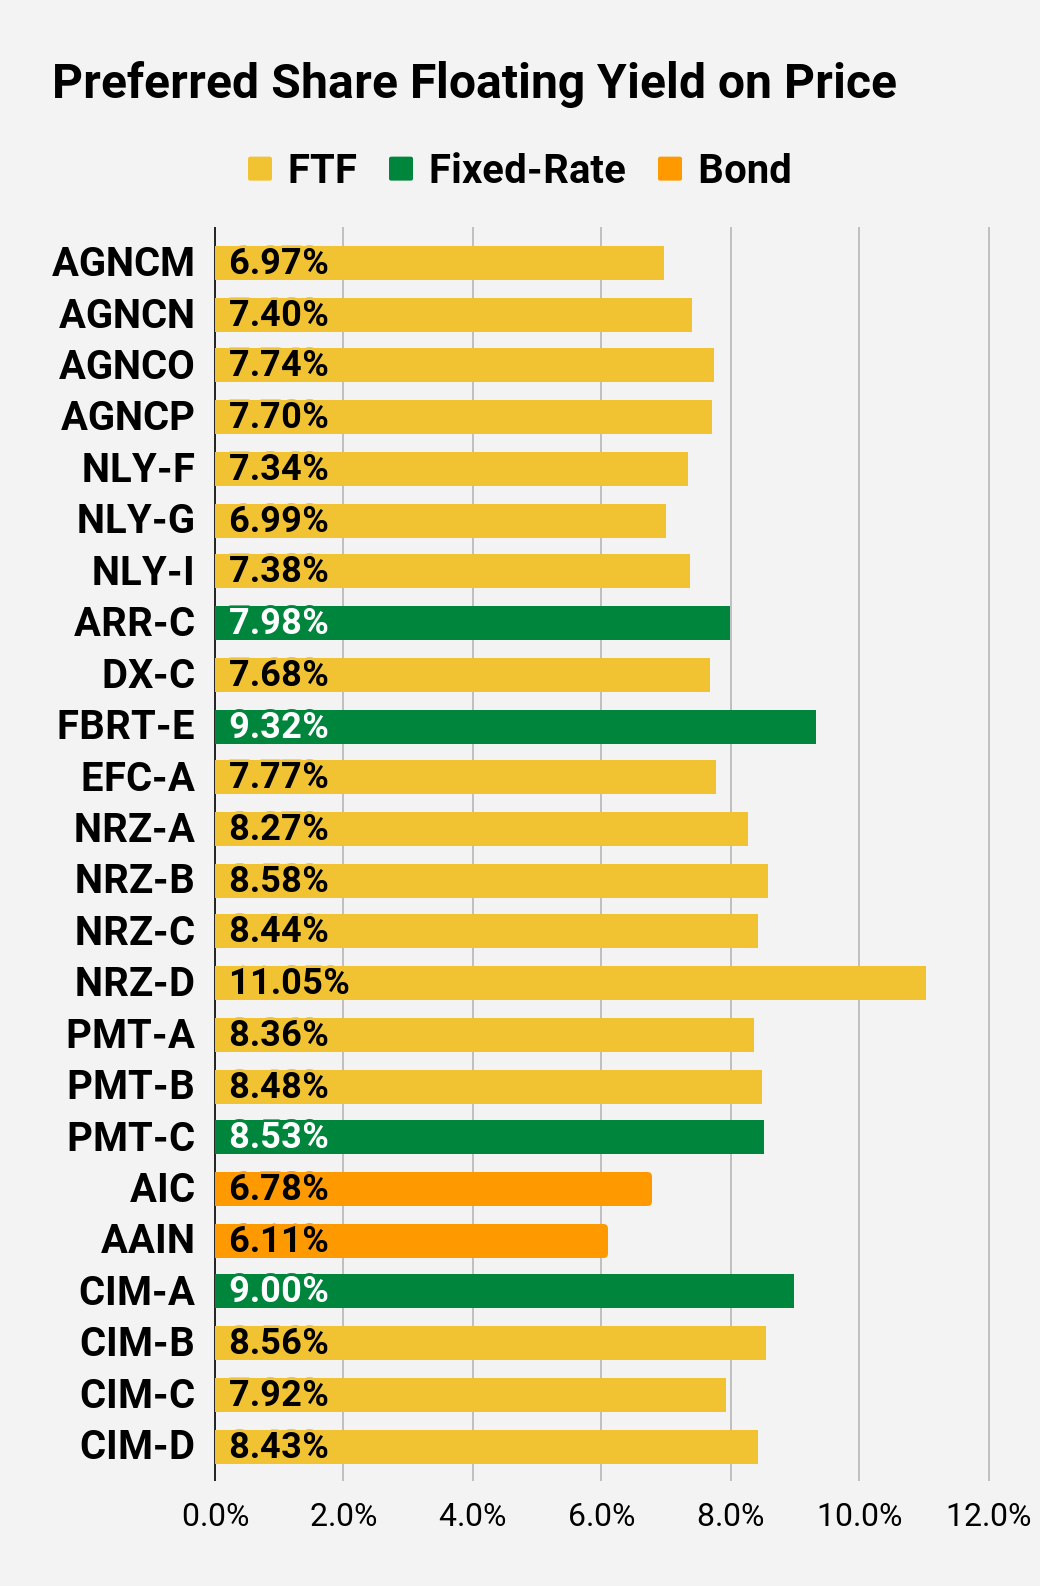
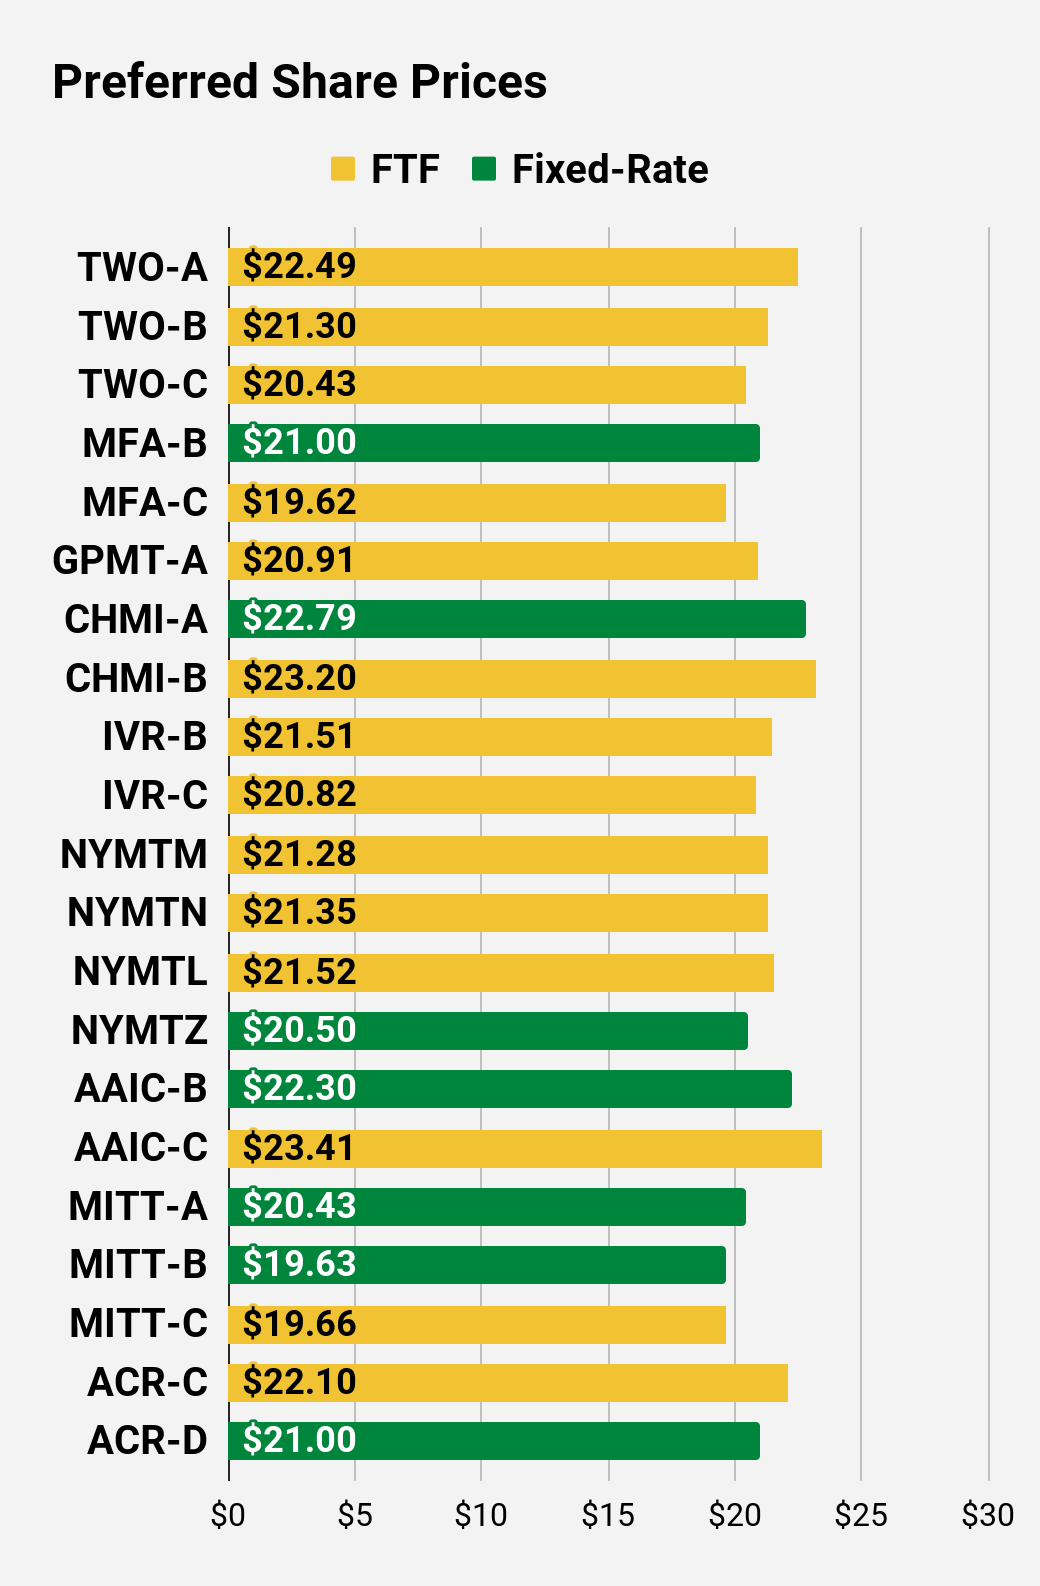
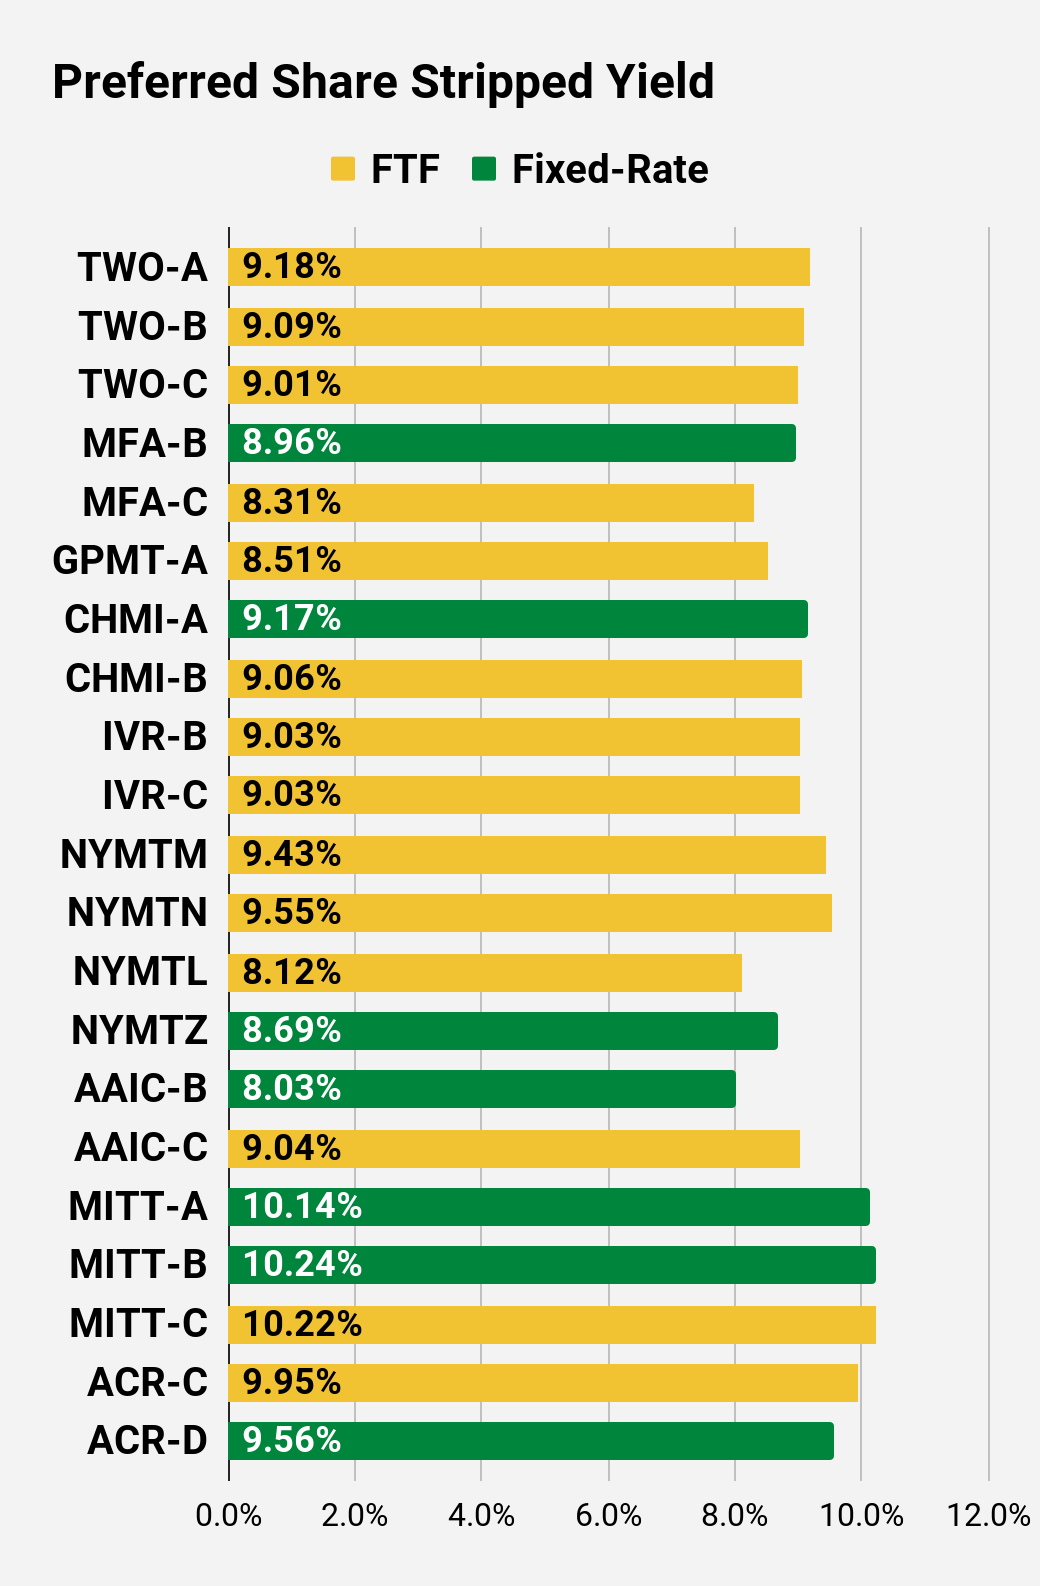
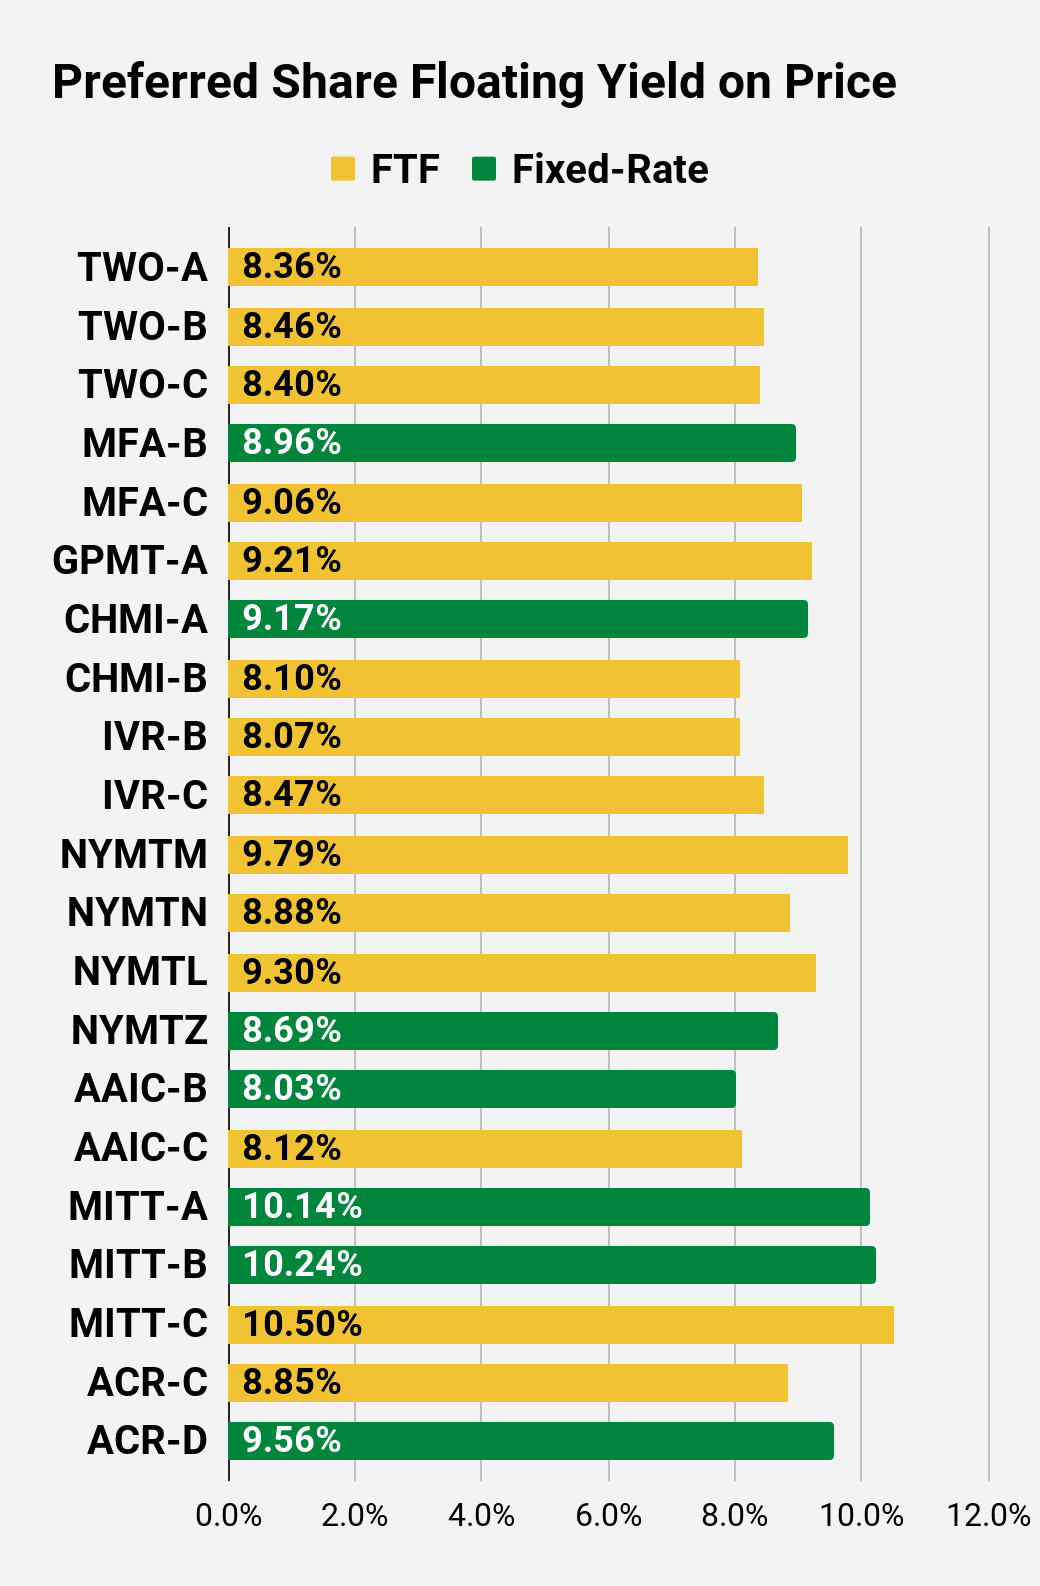
Preferred Share Charts
 The REIT Forum |
 The REIT Forum |
 The REIT Forum |
 The REIT Forum |
 The REIT Forum |
 The REIT Forum |
Preferred Share Data
Beyond the charts, we’re also providing our readers with access to several other metrics for the preferred shares.
After testing out a series on preferred shares, we decided to try merging it into the series on common shares. After all, we are still talking about positions in mortgage REITs. We don’t have any desire to cover preferred shares without cumulative dividends, so any preferred shares you see in our column will have cumulative dividends. You can verify that by using Quantum Online. We’ve included the links in the table below.
To better organize the table, we needed to abbreviate column names as follows:
- Price = Recent Share Price – Shown in Charts
- BoF = Bond or FTF (Fixed-to-Floating)
- S-Yield = Stripped Yield – Shown in Charts
- Coupon = Initial Fixed-Rate Coupon
- FYoP = Floating Yield on Price – Shown in Charts
- NCD = Next Call Date (the soonest shares could be called)
- Note: For all FTF issues, the floating rate would start on NCD.
- WCC = Worst Cash to Call (lowest net cash return possible from a call)
- QO Link = Link to Quantum Online Page
Second Batch:
Strategy
Our goal is to maximize total returns. We achieve those most effectively by including “trading” strategies. We regularly trade positions in the mortgage REIT common shares and BDCs because:
- Prices are inefficient.
- Long-term, share prices generally revolve around book value.
- Short-term, price-to-book ratios can deviate materially.
- Book value isn’t the only step in analysis, but it is the cornerstone.
We also allocate to preferred shares and equity REITs. We encourage buy-and-hold investors to consider using more preferred shares and equity REITs.
Performance
We compare our performance against 4 ETFs that investors might use for exposure to our sectors:
The REIT Forum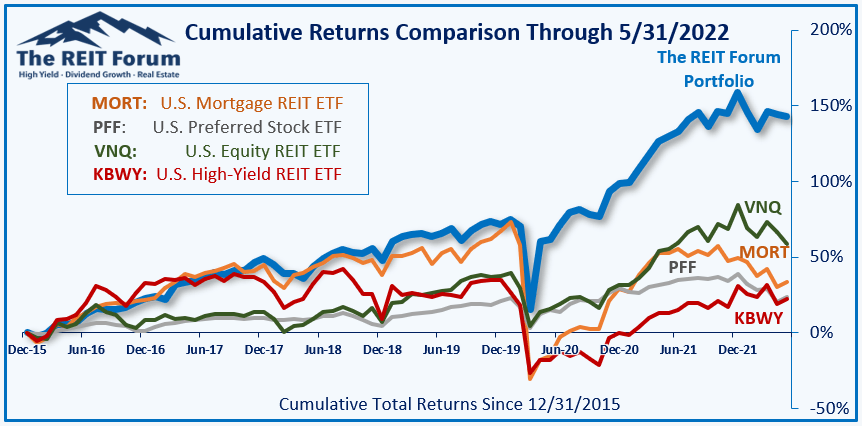
The 4 ETFs we use for comparison are:
|
Ticker |
Exposure |
|
One of the largest mortgage REIT ETFs |
|
|
One of the largest preferred share ETFs |
|
|
Largest equity REIT ETF |
|
|
The high-yield equity REIT ETF. Yes, it has been dreadful. |
When investors think it isn’t possible to earn solid returns in preferred shares or mortgage REITs, we politely disagree. The sector has plenty of opportunities, but investors still need to be wary of the risks. We can’t simply reach for yield and hope for the best. When it comes to common shares, we need to be even more vigilant to protect our principal by regularly watching prices and updating estimates for book value and price targets.
Ratings:
Be the first to comment