

ImagineGolf/E+ via Getty Images
Introduction
It’s time to talk about one of the most important subjects of 2022: natural gas. In a recent article covering natural gas giant EQT Corp. (EQT), I discussed the importance of liquid natural gas (“LNG”) in light of the ongoing energy crisis. In this article, I am going to elaborate on that based on new developments and explain why I believe that this uptrend isn’t exhausted.
In the second half of the article, I’m going to highlight a way for investors to benefit from higher natural gas prices without having to buy a rather expensive natural gas (commodity) ETF, or expose themselves to single stock picking: the First Trust Natural Gas ETF (NYSEARCA:FCG)
Additionally, my goal is to distribute general knowledge as the natural gas situation is important for every macro playbook – even if you don’t want to trade natural gas stocks.
Europe’s In Trouble
As a European citizen and writer of a daily European macro newsletter, this is an issue I’ve been on top of since 2021. I’m talking of course about the energy crisis.
While I’ve covered the energy bull case since 2Q20, something changed in 2021. In the last months of 2021, Putin started to pressure Ukraine before invading the country at the end of February of this year.
The graph below shows the benchmark for European natural gas: Dutch TTF futures. In this case, I used TTE futures, which have different units. In this case $ per MMBtu. This way it’s comparable to US-based Henry Hub futures.
Please note that I use two different y-axes in the chart below. Henry Hub (orange) is NOT more expensive than TTF/TTE (black). As a matter of fact, European natural gas is 5.2x more expensive than US-based Henry Hub, which gives you an idea of how dire the situation is in Europe.
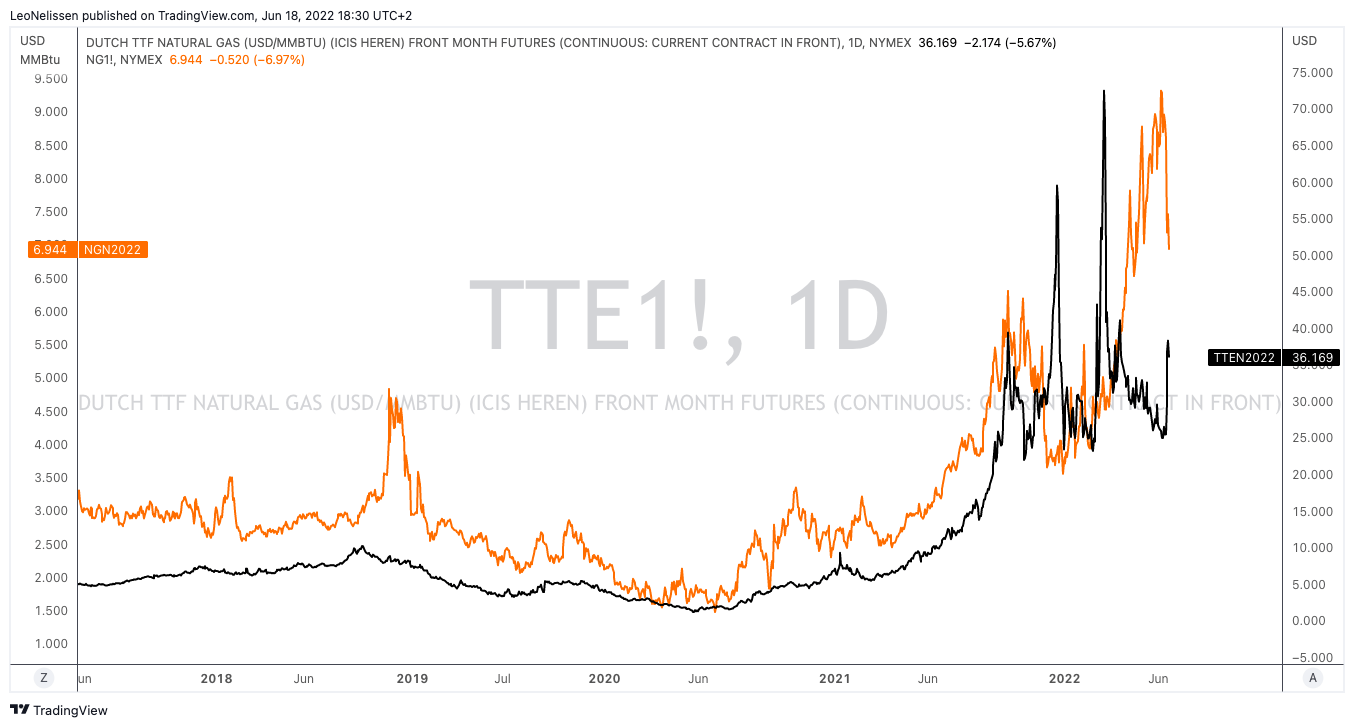
TradingView
Prior to the war, the European Union got 30% of its natural gas from Russia. Germany, Europe’s industrial heart with significant natural gas-intensive chemical exposure got 40% of its gas from Russia as it is home to the Nord Stream 1 and infamous Nord Stream 2 (this one is canceled) pipelines.

Statista
Right now, Russia has a lot of leverage over Europe as it can reduce exports of natural gas. Business insiders and companies like BASF have made clear that a decline in natural gas could cause production to halt, which would impact every single supply chain in Europe and beyond.
My goal is not to get people upset, but I believe that a situation of energy rationing would trigger supply issues far worse than the initial COVID lockdowns.
Based on that context, Russia is reducing exports. The TTF/TTE chart I included in this article shows a significant increase in gas prices as a result of lower exports.
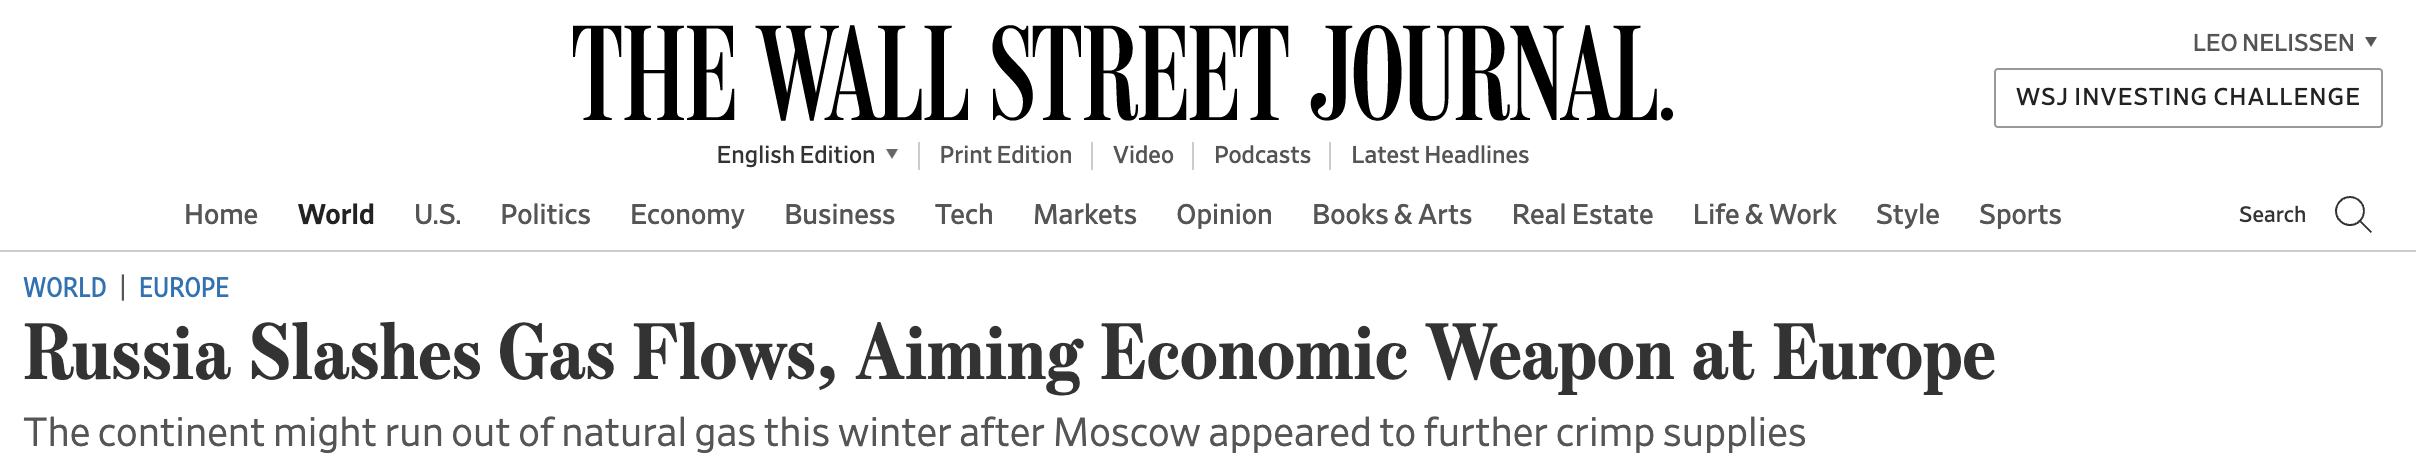
Wall Street Journal
According to the Wall Street Journal:
Berlin said gas supplies were secure and that it could procure the missing fuel from other sources, though at higher prices. But the reduction in Russian supplies will make it difficult to fill gas storage ahead of winter, potentially leaving factories and households across the continent in peril.
This is going so far that politicians and business representatives in Germany are now pushing to reduce natural gas usage. The quote below is translated from a recent Handelsblatt article:
The danger of an acute gas shortage continues to escalate, Seyfert warned. Russia has reduced its gas supplies through the Nord Stream 1 pipeline in two steps since 13 June. For the first time since the end of March, the Federal Network Agency described the situation as “tense” in its daily report on gas supply in Germany.
“In the current situation, gas-fired power plants that only generate electricity must be replaced immediately by other power plants from existing reserves,” said industry representative Seyfert.
Germany is about to throw its plans for a quick renewable energy transition out of the window as it is close to boosting coal energy production in order to boost natural gas inventories ahead of what could be a cold winter.
Hence, and to go back to the Wall Street Journal article, Germany and its European partners are sourcing natural gas imports from other countries – like the US – even though its infrastructure does not support higher imports yet (Europe really cannot catch a break).
Europe’s options are limited in the short term. Government and company officials have scoured the globe this year for alternative sources of supply, striking deals in the U.S., Egypt and Israel while securing higher volumes from producers including Azerbaijan and Norway. But the continent’s infrastructure for importing liquefied-natural gas is close to maxing out, traders said, and is in any case distributed unevenly around the region.
In other words, Europe is in trouble, which is good news for natural gas demand.
Natural Gas Supply/Demand
Europe is a major part of the natural gas bull case, but it’s not everything. In general, natural gas is seeing a huge tailwind thanks to strong domestic (US) and overseas demand. According to Shell data that I discussed in my recent EQT article:
Asian demand, for example, is expected to account for 70% of global LNG demand by 2040. In 2021, China was the world’s top importer, accounting for almost 80 million tonnes of LNG. In 2040, global LNG demand is set to exceed 700 million tonnes. In Brazil, demand tripled due to higher hydrogen production. Total LNG trade was 380 million tonnes in 2021. An increase of 21 million tonnes over 2020.
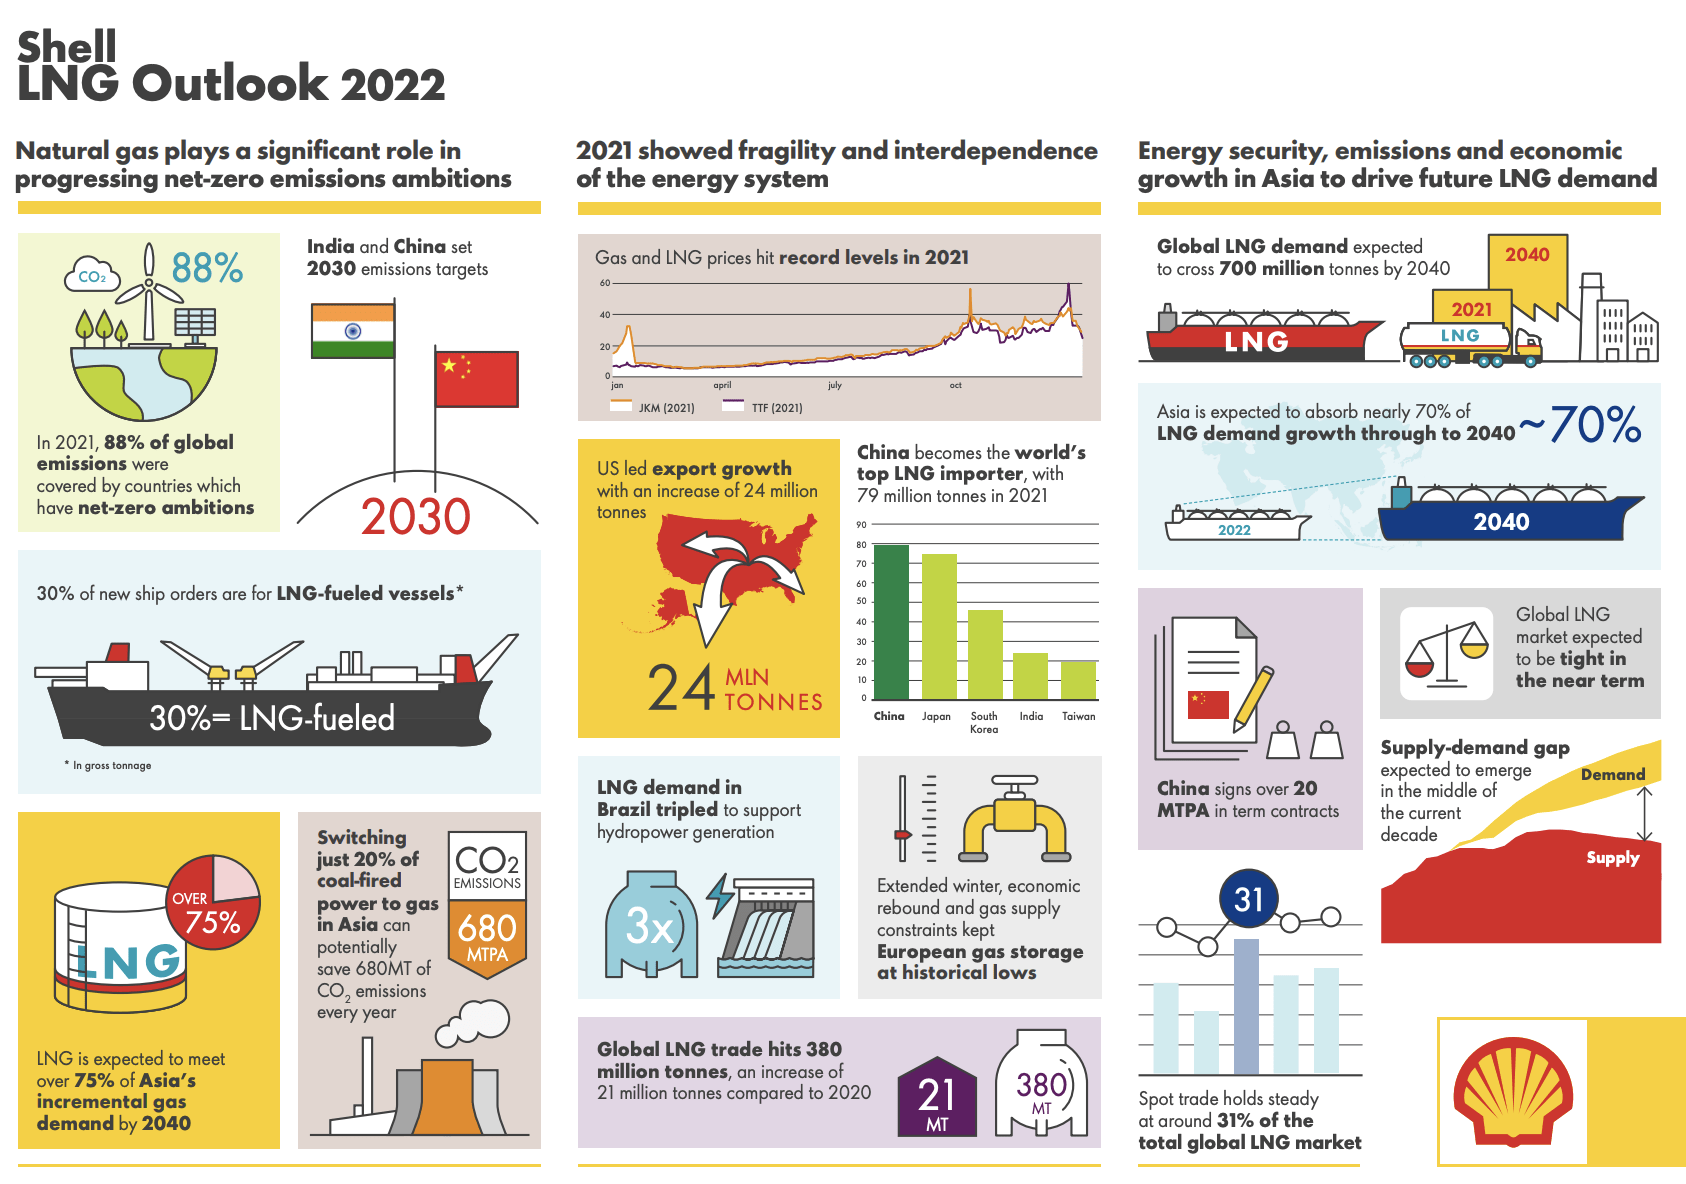
Shell
Basically, LNG is liquified natural gas. It’s the only way the US – or any other country – can export natural gas without the use of pipelines. For example, natural gas is produced in Texas, it is sent to an LNG facility at the coast where it is liquified. It is then shipped to Europe or Asia where it is turned into a gas again.
The demand side is clear.
- Natural gas is cleaner than coal, which makes it a fantastic source to reduce pollution.
- Asia can use it to lower massive coal demand, while Europe can use it to smoothen the energy transition
- The same goes for the United States and more or less every energy-intensive country
- Europe is dealing with geopolitical issues that accelerate the need for imported gas/LNG.
The big issue is that supply is expected to lag. On the right side of the Shell overview above, the company shows that it expects supply to fall in the years ahead. It does not give us numbers, but the trend is clear.
For example, as I mentioned on Twitter, natural gas production is peaking:
Twitter (@Growth_Value_)
The graph below shows that the shale revolution in the US has ended. Since 2020, production growth rates in all major basins have slowed, leading to subdued production growth.
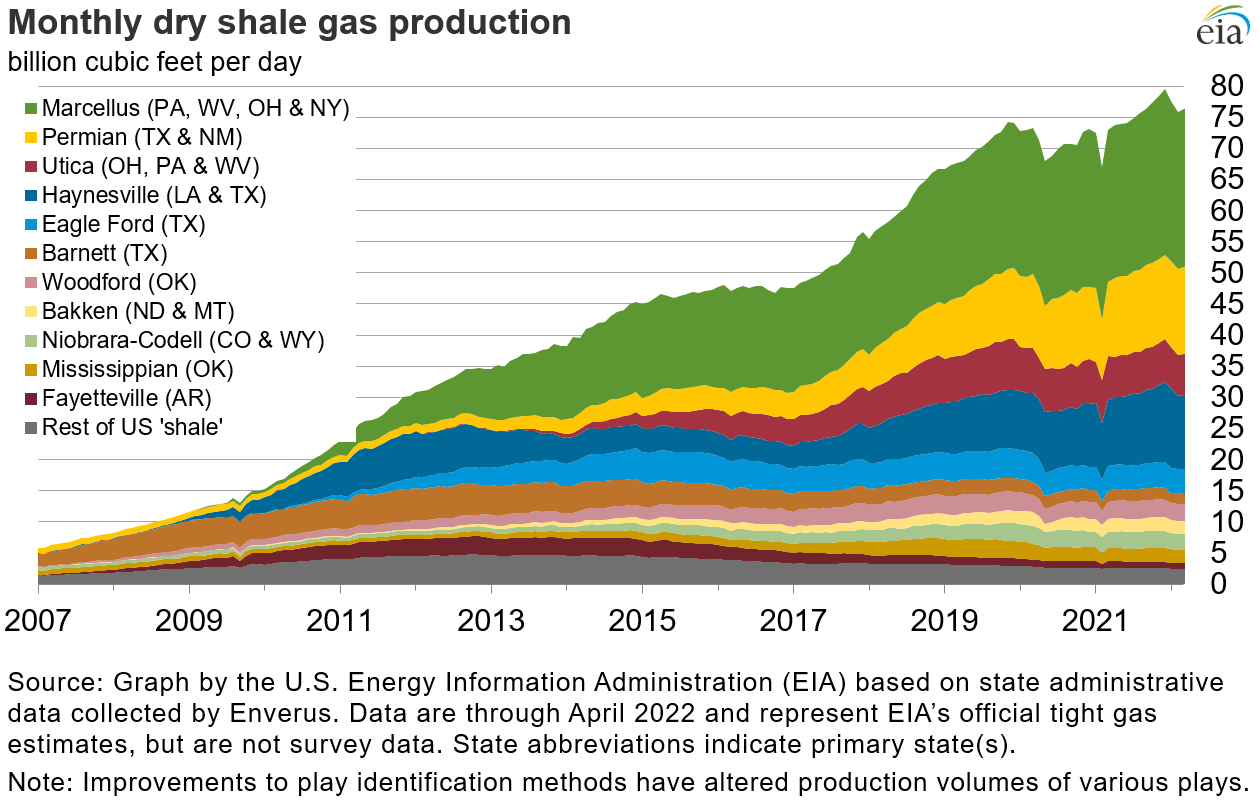
EIA
This is the longer-term outlook, which does project growth of roughly 10 trillion cubic feet, but subdued growth rates.
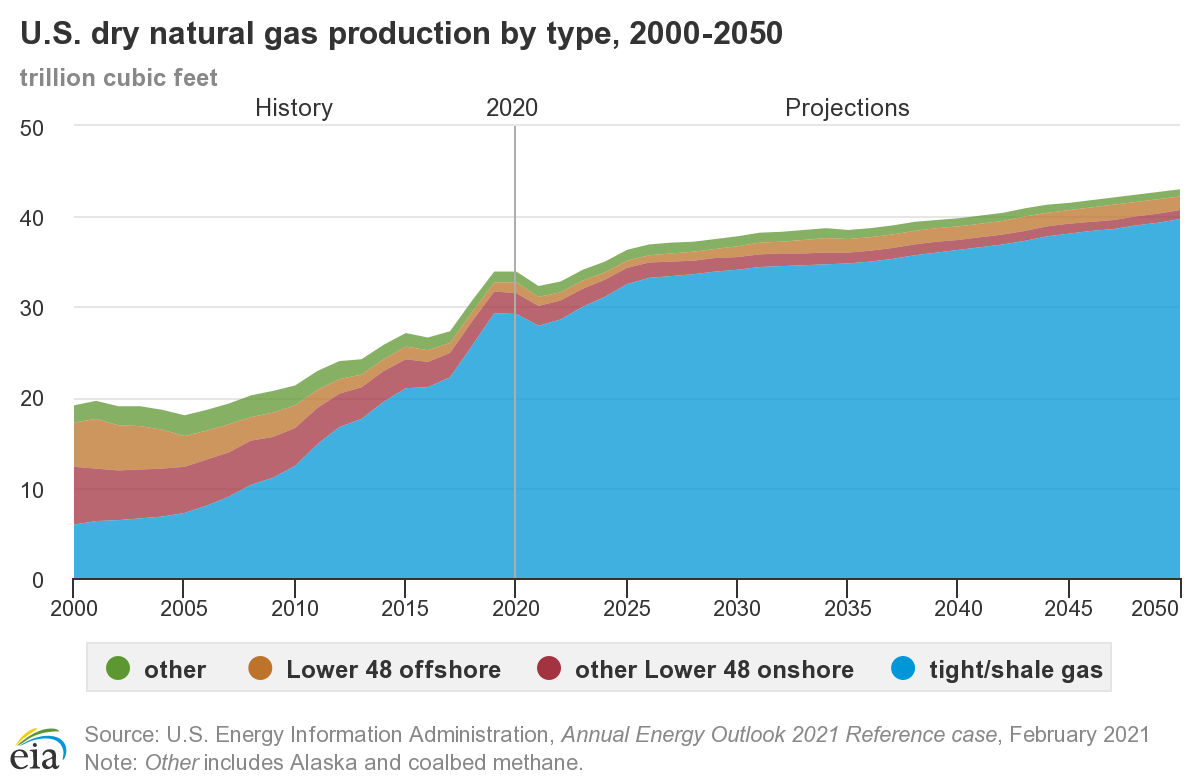
EIA
To give you a few examples of supply issues, EQT – America’s largest natural gas producer – visualized the impact of issues like insufficient pipeline capacity on natural gas prices. Note how the shale revolution provided the US and the world with cheap and reliable natural gas. That is now changing.
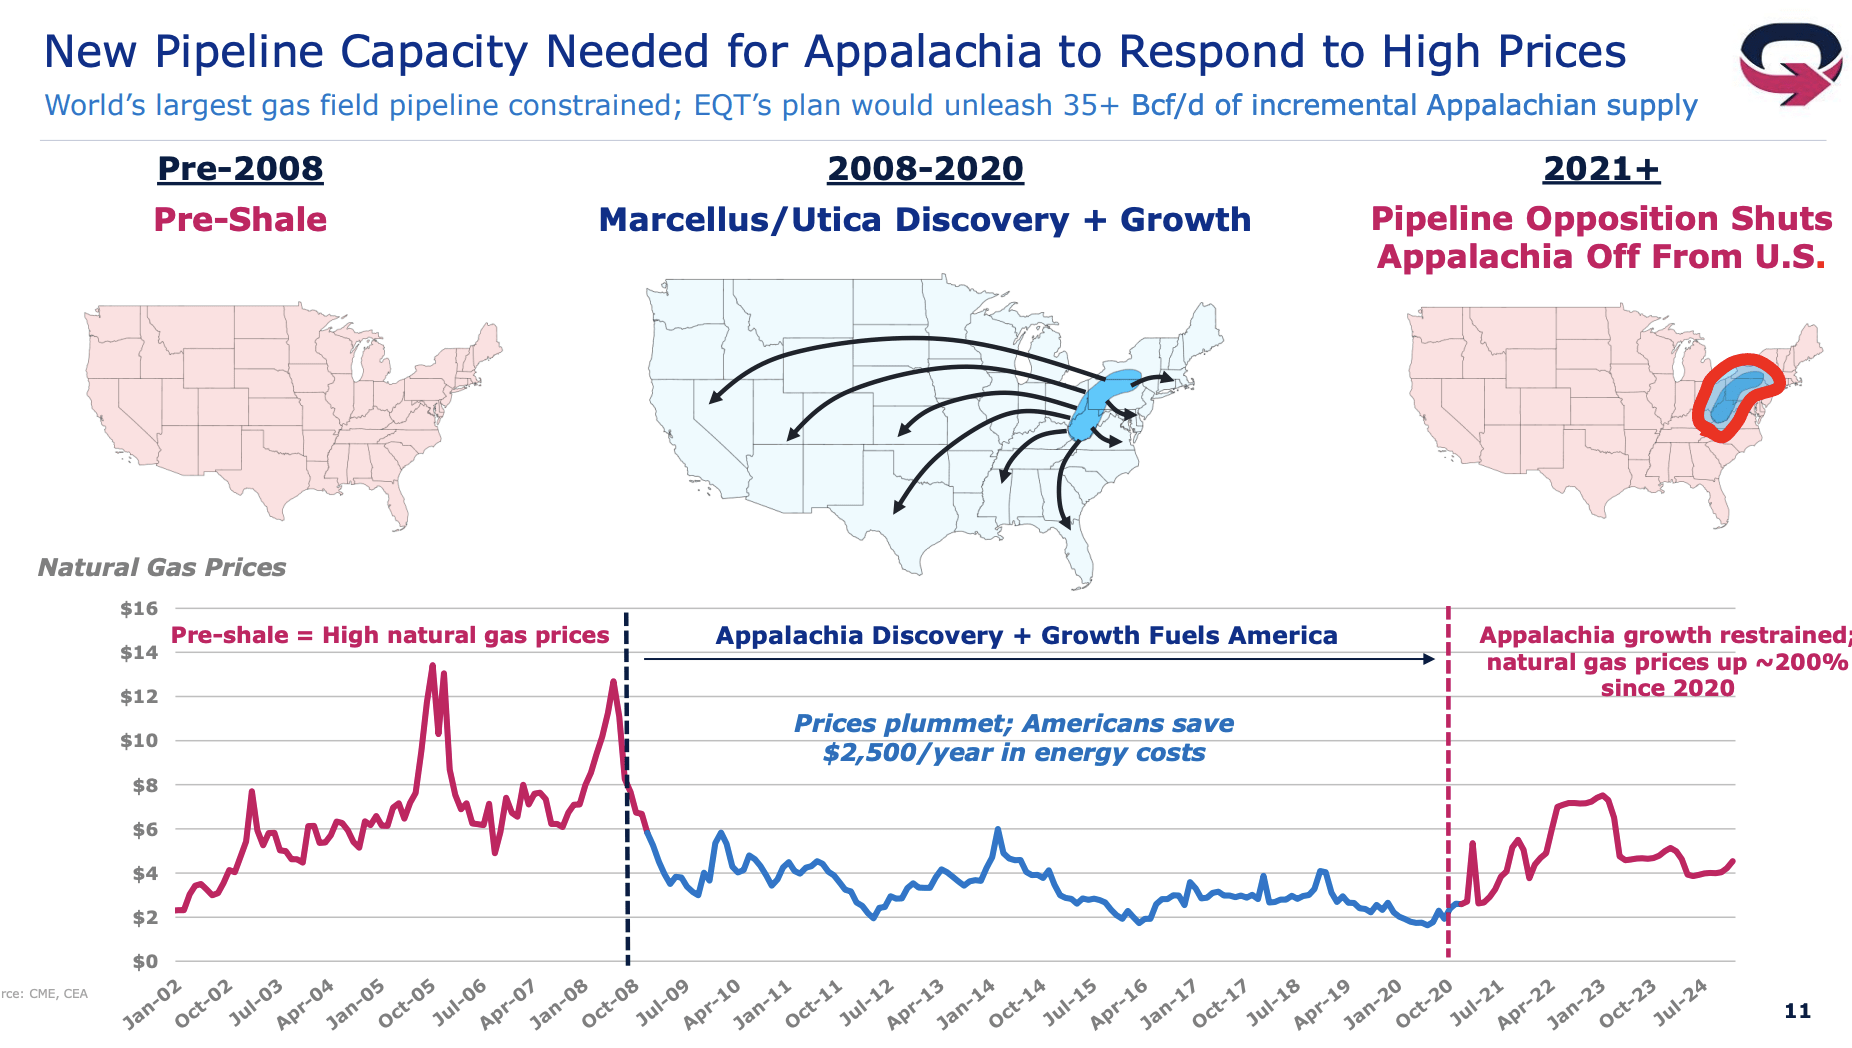
EQT Corp.
Antero Resources (AR), is calling the current environment “shale 3.0”, which is a great name for the shift from production growth to free cash flow generation. As I explained in a recent article covering energy giant Exxon Mobil (XOM), producers of both oil and gas are emphasizing free cash flow instead of production. This is the result of regulatory and social pressure on these companies. The government in the US has made clear that it wants to get rid of oil in the long term. In order to protect themselves and investors, oil and gas companies are building fortress balance sheets and cash flow streams that provide room for dividends, buybacks, and further debt reduction. Needless to say, all of this is further pressuring supply growth.
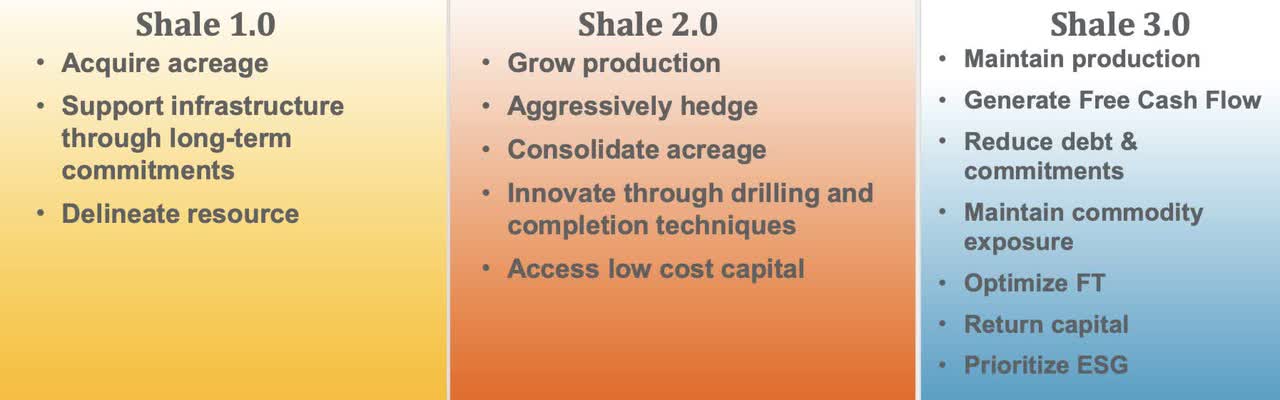
Antero Resources
With that in mind, there’s another issue that needs to be discussed.
The Freeport Fire
As the first graph of this chart showed, in the past two weeks, US natural gas crashed while European TTF soared higher.
This is due to a fire at one of America’s largest LNG export facilities. Last week, the Houston Chronicle reported that Freeport could be offline until “late 2022”. I’ve heard rumors that it would be offline until September.
This is a huge deal. The chart below shows the significance of Freeport when it comes to total US LNG exports.
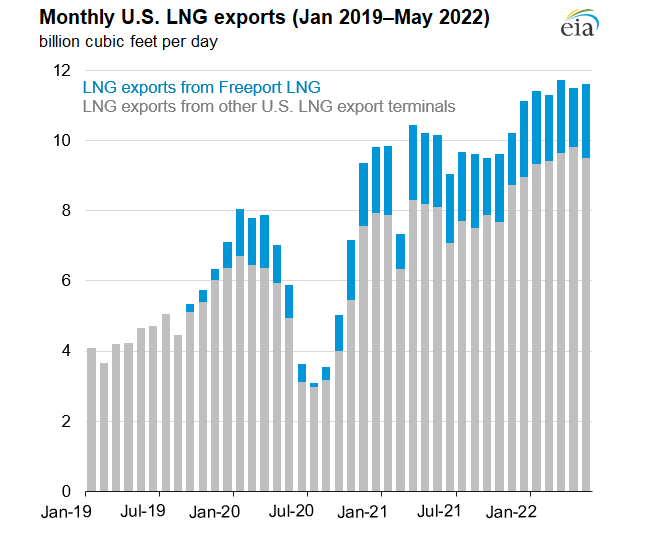
EIA
The facility produced roughly 2 billion cubic feet of LNG per day. Most of it went to Europe. Since the Russian invasion, Freeport volumes sent to Europe soared by 44%. Right now, this is a worst-case scenario as Europe is scrambling for more LNG supplies – hence the boost in TTF/TTE prices.
I believe that the decline in Henry Hub is temporary as markets have priced in the damage Freeport has done. After all, lower exports mean that more natural gas remains in the US. That temporarily causes more supply, hence lower prices.
So, how to benefit from this dip and in the long term?
First Trust Natural Gas ETF
There are multiple benefits of ETFs. The most straightforward is to avoid stock picking. It’s why index ETFs are such a great tool for retail investors. However, ETFs are also a great tool to track or trade commodities. In the case of the FCG ETF, the ETF does not hold commodity futures but natural gas stocks.
According to the First Trust website:
- “The Index is comprised of exchange-listed companies that derive a substantial portion of their revenues from the exploration and production of natural gas.
- The Index is constructed by establishing the universe of U.S. listed stocks of companies involved in the exploration and production of natural gas. Companies whose natural gas proved reserves do not meet certain requirements are eliminated.
- To meet Index eligibility, a stock must also satisfy market capitalization, liquidity, and weighting concentration requirements.
- All eligible operating companies and Master Limited Partnership (“MLP”) stocks are ranked on both liquidity and market capitalization within their segments.”
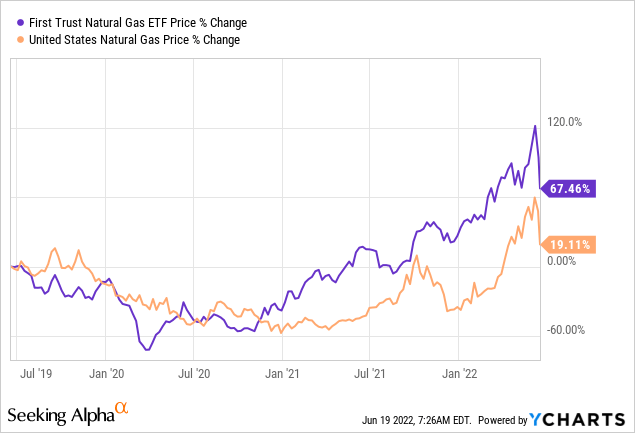
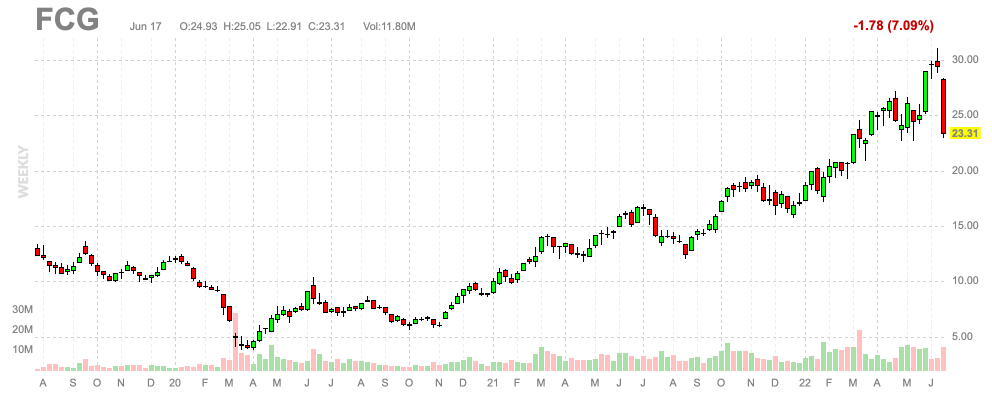
The chart below shows the ETF (black line) versus Henry Hub natural gas (orange).

TradingView
The 30-Day SEC (dividend) yield is 1.6%. The expense ratio is 0.60%, which is rather high. However, the expense ratio of the biggest ETF tracking natural gas futures (UNG) is 1.35%.
Moreover, over the past 3 years, FCG has outperformed UNG by a rather wide margin as producers often outperform the commodity they produce.
Another important point is that FCG is well-diversified. It has no holding with more than 4.6% of total exposure. The number of total holdings is 49. The total net assets of the ETF are roughly $800 million with a daily volume of 4.3 million shares.
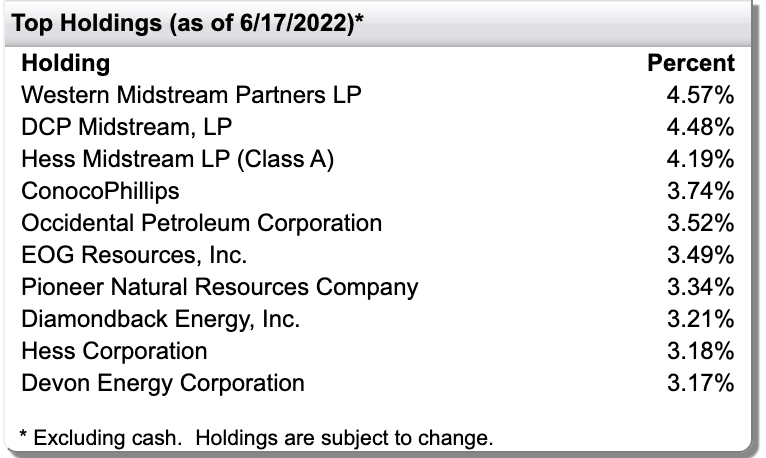
First Trust
The only drawdown is that a 0.60% expense ratio is a lot for a long-term investment. Hence, investors who want long-term exposure may have to look for single stocks after all. In that case, I like to refer to my EQT article, which I mentioned in the introduction of this article.
Moreover, investors should maintain a close eye on their exposure. Natural gas and its producers are volatile. I have 20% total energy exposure (oil, gas, refineries), and believe that’s more than enough as it adds plenty of volatility to my portfolio. Please be aware of these risks before adding any energy exposure to your portfolio.
Takeaway
The natural gas bull case took a hit last week as the Freeport fire caused expected exports to plummet. It also didn’t help that the market was selling off, sparking fears that demand may be damaged by lower economic growth expectations.
However, natural gas remains in a strong long-term bull market with upside expectations caused by a dramatic energy situation in Europe and demand competition from Asia.
I believe that prices will recover in the second half of this year, which will benefit drillers and related companies in the United States.
Supply will remain subdued, and I don’t see a way for supply to catch up with rising demand. Not in the supply-constrained environment, anyway.
The First Trust Natural Gas ETF is a handy way to play the ongoing uptrend. It follows Henry Hub prices closely, it has a relatively low expense ratio, a 1.6% dividend yield, and a well-diversified basket of US-based drillers that increasingly focus on free cash flow and related shareholder distributions.
FINVIZ
With that said, and as I mentioned in the article, please be aware that energy (in general) is volatile. Please maintain conservative exposure if you decide to buy any energy stock. Especially in the ongoing market environment it’s impossible to say that there’s not a chance of another drawdown to $20, in the case of FCG.
Other than that, I remain bullish as the rating of this article suggests.
(Dis)agree? Let me know in the comments!
Be the first to comment