


Solskin/DigitalVision via Getty Images
Price Action Thesis
We follow up with our post-FQ1 article on Teladoc Health, Inc. (NYSE:TDOC) stock, as we observed some significant developments in its price action structure over the past two months.
As a reminder, we cautioned investors against adding exposure before the release of its FQ1 earnings card, as we were concerned that Teladoc’s estimates were too optimistic. However, its post-earnings sell-off led us to re-rate TDOC stock, as we thought it looked reasonable as a speculative opportunity.
Our price action analysis suggests TDOC stock is still undergirded by its April/May bottom. However, a bear trap price action to help stymie its bearish bias remains elusive.
Our reverse cash flow valuation analysis indicates that a speculative opportunity in TDOC stock is still reasonable at the current levels.
Accordingly, we reiterate our Speculative Buy opportunity in TDOC stock.
Digestion From Double Top Bull Trap Almost Complete
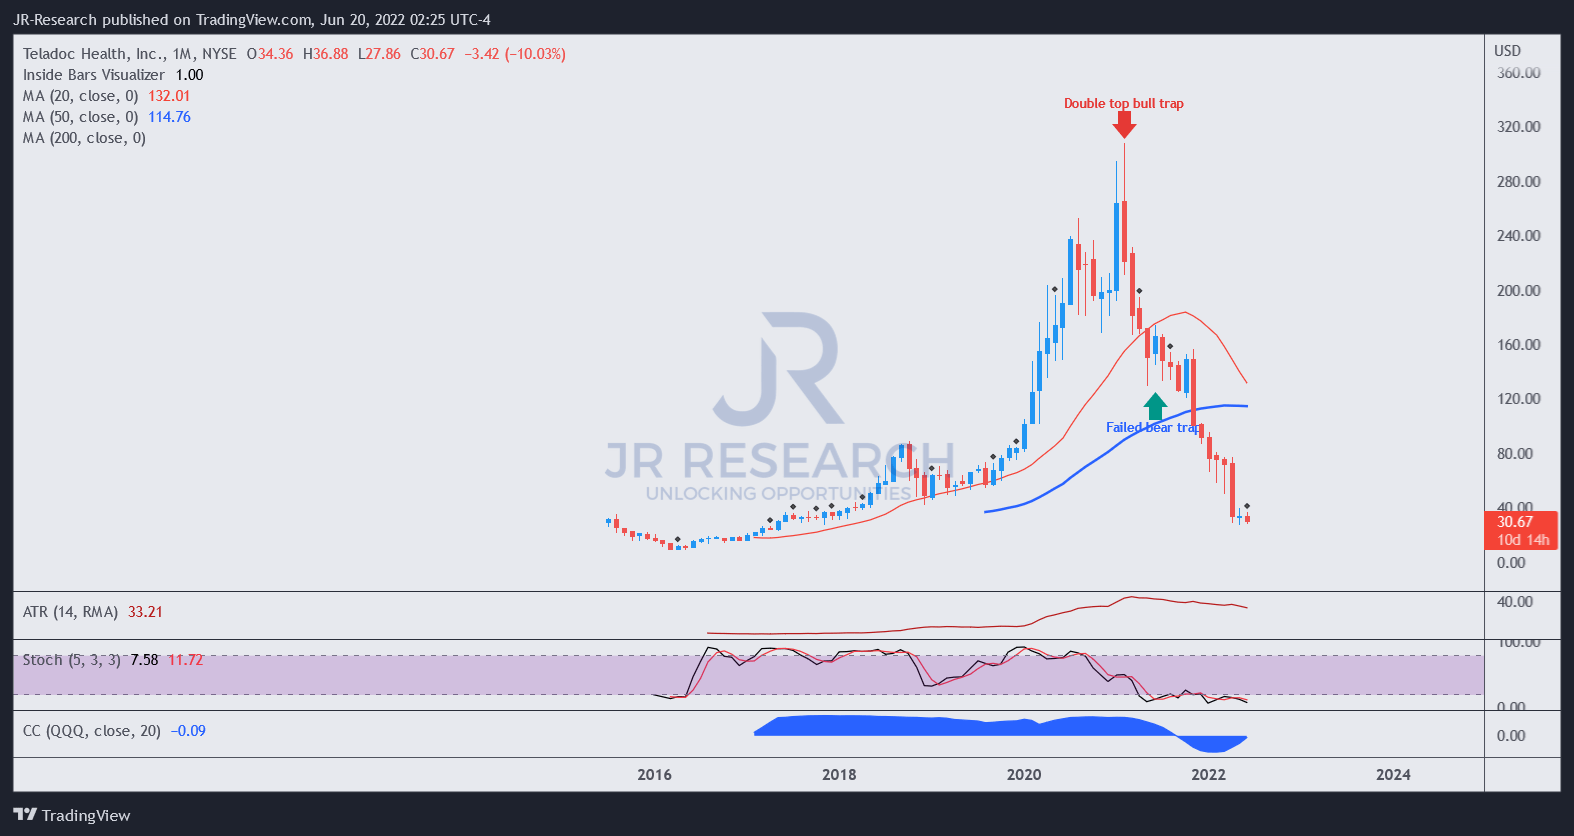
TDOC price chart (monthly) (TradingView)
Investors must be wary of such double top bull traps, as seen in TDOC monthly chart above. We have enunciated in several articles that these potent bull traps often provide early warning signals to investors on the market’s next massive move: rapid liquidation.
Notably, the double top occurred in February 2021, indicating the market’s assessment of an overvalued TDOC stock. Unfortunately, we had not paid sufficient attention to its price action structure and missed its double top. As a result, it led to several poor calls on TDOC, as we ignored the warning from the market.
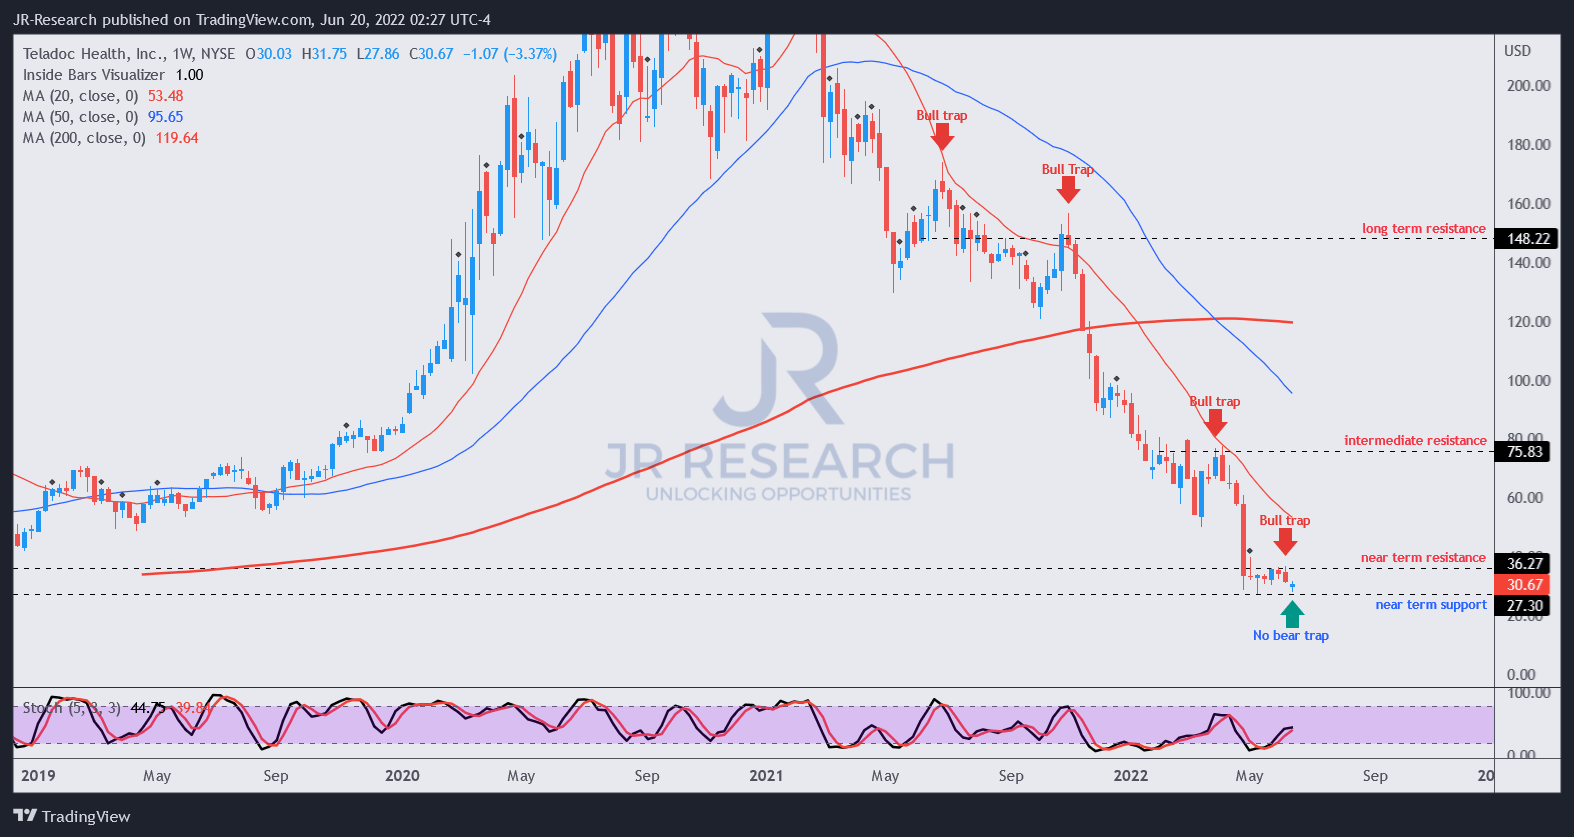
TDOC price chart (weekly) (TradingView)
A series of subsequent bull traps corroborated its bearish bias after the initial rapid sell-off from its double top. Therefore, the market has astutely digested its rapid gains from 2020-21, drawing dip-buyers into those traps.
Notably, the capitulation move post-FQ1 in April was significant, leading to the formation of its near-term support. Moreover, the market rejected another sell-off in May as selling pressure was absorbed in TDOC stock.
However, a subtle bull trap in June helped form its near-term resistance. Therefore, investors are urged to add exposure close to its near-term support and avoid buying close to its near-term resistance.
Notwithstanding, we have not observed a significant bear trap price action signal that could indicate a potential reversal in its bearish bias. Therefore, the critical risk to its current consolidation phase leading to another sell-off remains. As a result, we urge investors to implement an appropriate stop-loss risk management strategy to prevent outsized drawdowns.
TDOC Valuation Is More Reasonable – But Not Undervalued
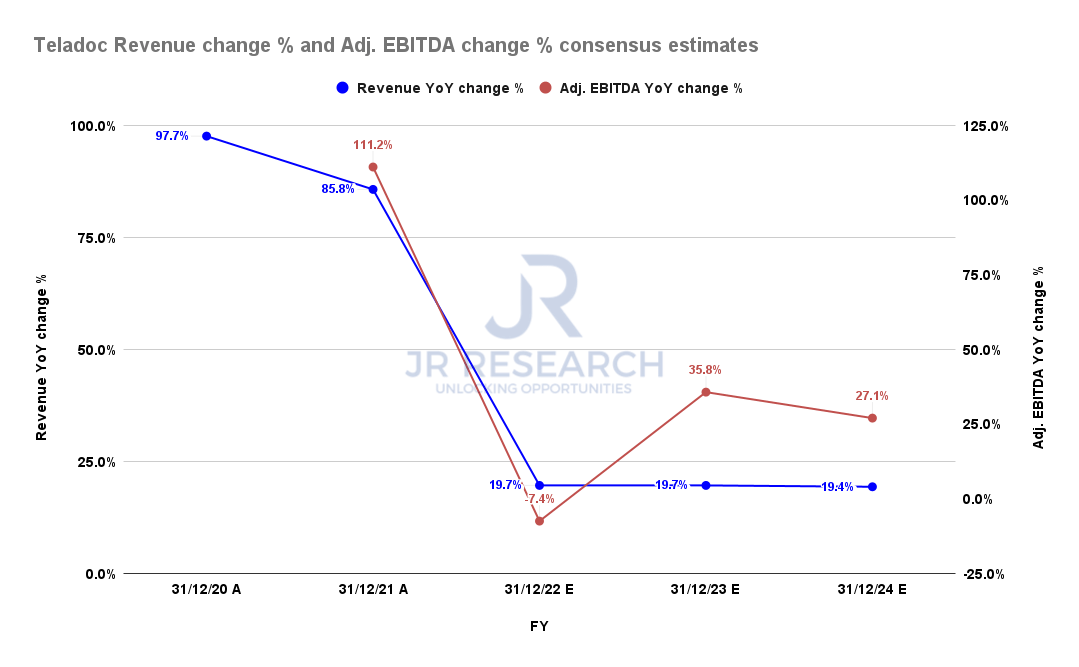
Teladoc revenue change % and adjusted EBITDA change % consensus estimates (S&P Cap IQ)
Teladoc’s massive revenue growth was clearly unsustainable, and the market’s forward-looking ability from its double top bull trap in February 2021 was prescient.
However, its revenue growth is expected to reach a nadir in FY22 before normalizing. Furthermore, its adjusted EBITDA is estimated to recover from FY23, as Teladoc laps much easier comps from FY22’s disaster.
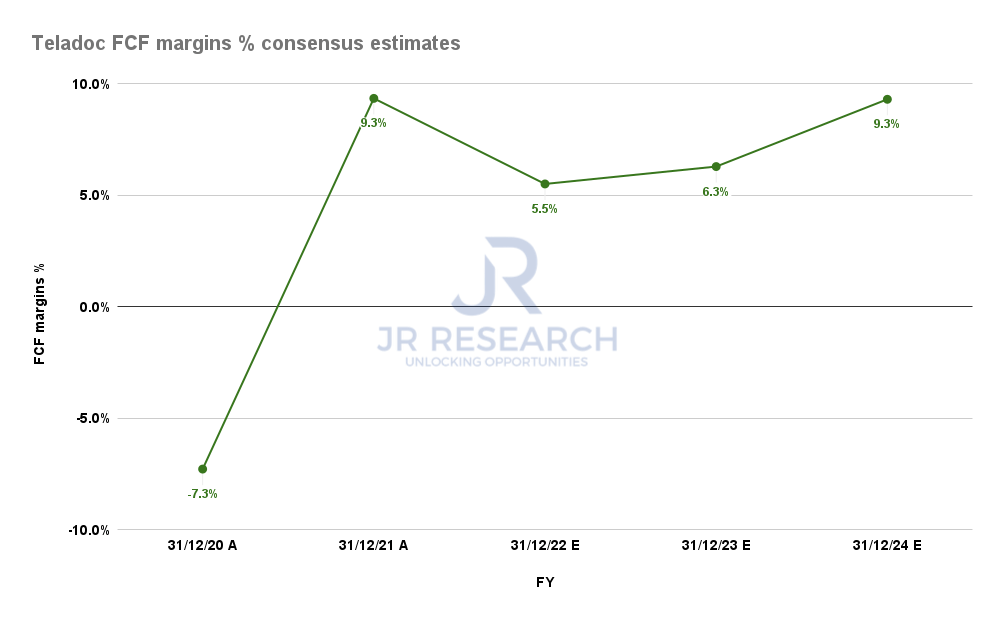
Teladoc FCF margins % consensus estimates (S&P Cap IQ)
Furthermore, its free cash flow (FCF) profitability is also estimated to recover from FY23, undergirding its valuations. Notwithstanding, the company remains unprofitable on an adjusted and GAAP EPS through FY24, which could affect investors’ sentiments on a potential re-rating.
| Stock | TDOC |
| Current market cap | $4.94B |
| Hurdle rate (CAGR) | 20% |
| Projection through | CQ2’26 |
| Required FCF yield in CQ2’26 | 3.5% |
| Assumed TTM FCF margin in CQ2’26 | 7.6% |
| Implied TTM revenue by CQ2’26 | $4.72B |
TDOC stock reverse cash flow valuation model. Data source: S&P Cap IQ, author
We used a hurdle rate appropriate for a growth stock but lower than its high-growth peers, given its slowing revenue growth. Therefore, we applied a higher FCF yield requirement of 3.5%, which is higher than its current NTM FCF yield of 2.96%.
However, we used a more conservative FCF margin of 7.6%, which is lower than its FY24 estimate of 9.3%, given Teladoc’s uneven FCF profitability.
As a result, we require Teladoc to deliver a TTM revenue of $4.72B by CQ2’26. The revised consensus estimates indicate that Teladoc could post revenue of $3.48B in FY24.
Consequently, it requires Teladoc to post a revenue CAGR of 22.5% from FY24-CQ2’26. We think it’s still a little aggressive but achievable if Teladoc executes well.
Is TDOC Stock A Buy, Sell, Or Hold?
We reiterate our Speculative Buy opportunity in TDOC stock. TDOC has outperformed the market since our re-rating in April. Therefore, the potential for a bottoming process at the current levels is increasing.
Notwithstanding, we emphasize that we have not observed a bear trap price action that could help reverse its bearish momentum. Therefore, the potential for another sell-off before creating its bear trap remains a critical risk to our price action thesis.
Our valuation analysis suggests that TDOC stock seems more reasonable now but not undervalued.
Therefore, we urge investors to apply appropriate risk management strategies to minimize the potential for large drawdowns.
Be the first to comment