

Junko Kimura/Getty Images News
Introduction
I’ve always been fascinated by the sumo wrestler fighting stance. Legs planted wide apart firmly into the ground to stand resiliently like a deeply rooted tree-trunk. Knees bent in a half-squat position to distribute weight all over. Powerful strength is in this form, but it is distributed all over the body.
How uncannily apt is it when the Japanese stock market mirrors these characteristics? Low exposure to deep cyclicals make it extremely resilient and its broad exposure ensures distribution of position weights and risks across the portfolio. I believe this is a powerful combination for eventual risk-adjusted alpha.
If this is your first time reading a Hunting Alpha article using Technical Analysis, you may want to read this post, which explains how and why I read the charts the way I do, utilizing principles of Flow, Location and Trap.
Relative Strength in EWJ
The iShares MSCI EWJ ETF (NYSEARCA:EWJ) tracks the stock market index of Japan. It is a proxy for the Nikkei 225 index (NKY:IND).
Read of Relative Money Flow
EWJ vs S&P500 Technical Analysis (TradingView, Author’s Analysis)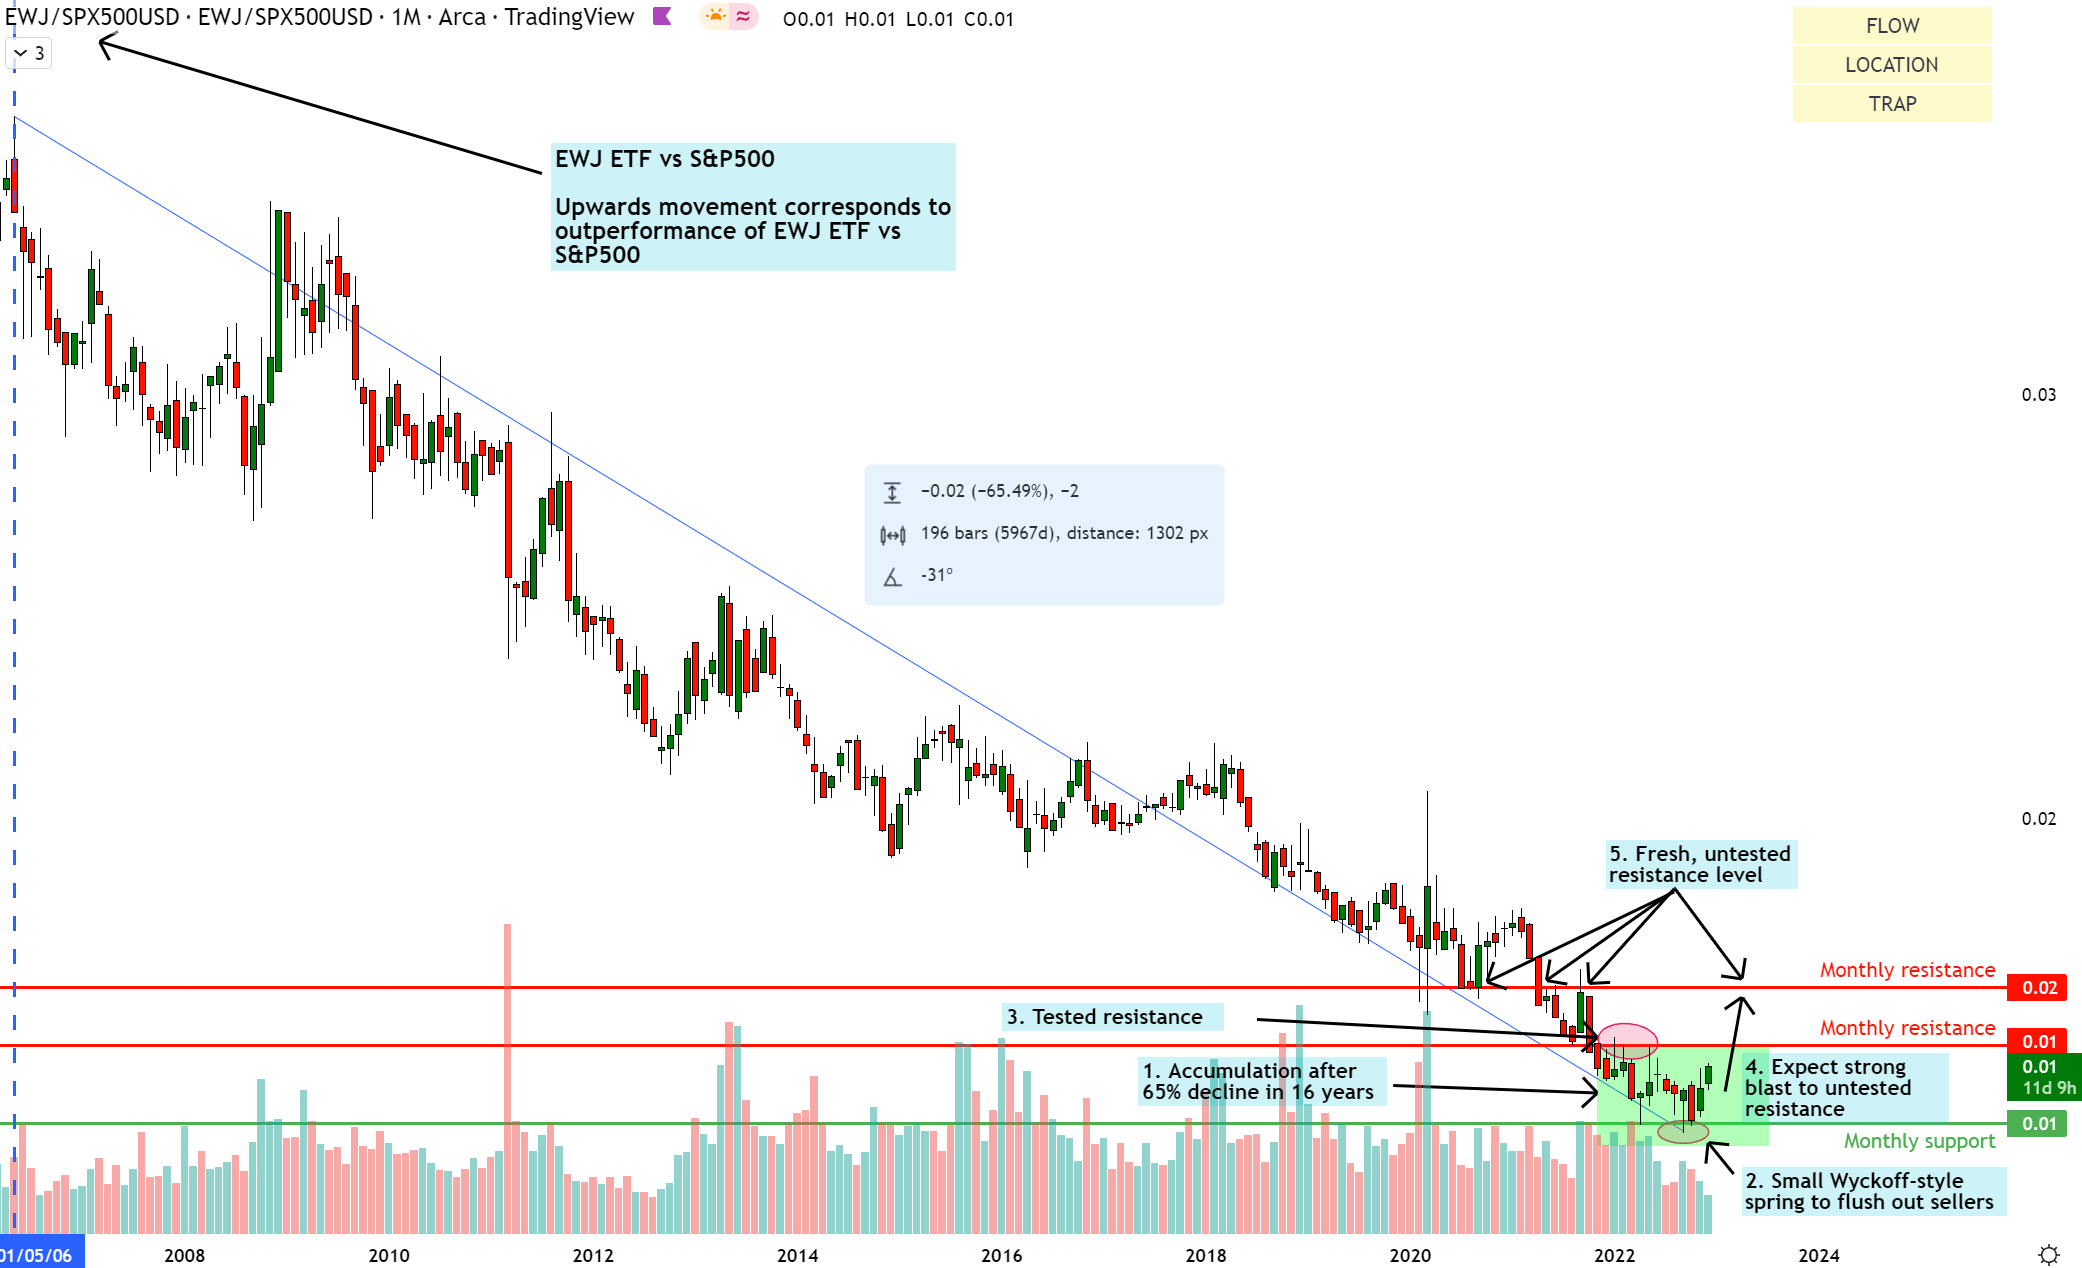
An upward movement on the relative chart of EWJ/SPX500 means EWJ is outperforming the S&P 500. Conversely, a downward movement means the EWJ is underperforming the S&P 500.
After a 65% decline in 16 years, EWJ/SPX500 is showing signs of buyer accumulation. The buyers have halted the progress of the seller flow and the price is now forming a base and forming a range off a newly formed support. Small false breakout traps are visible in the monthly chart and this would be more clearly seen on smaller timeframes. Additionally, price is forming hammer formations, suggesting an impending build-up of bullish strength.
Thus, I anticipate prices to blast up strongly past the initial monthly resistance that has already been tested. I believe EWJ/SPX500 will swiftly move towards the higher monthly resistance level marked, which is a fresh, untested resistance zone.
Read of Absolute Money Flow
EWJ Technical Analysis (TradingView, Author’s Analysis)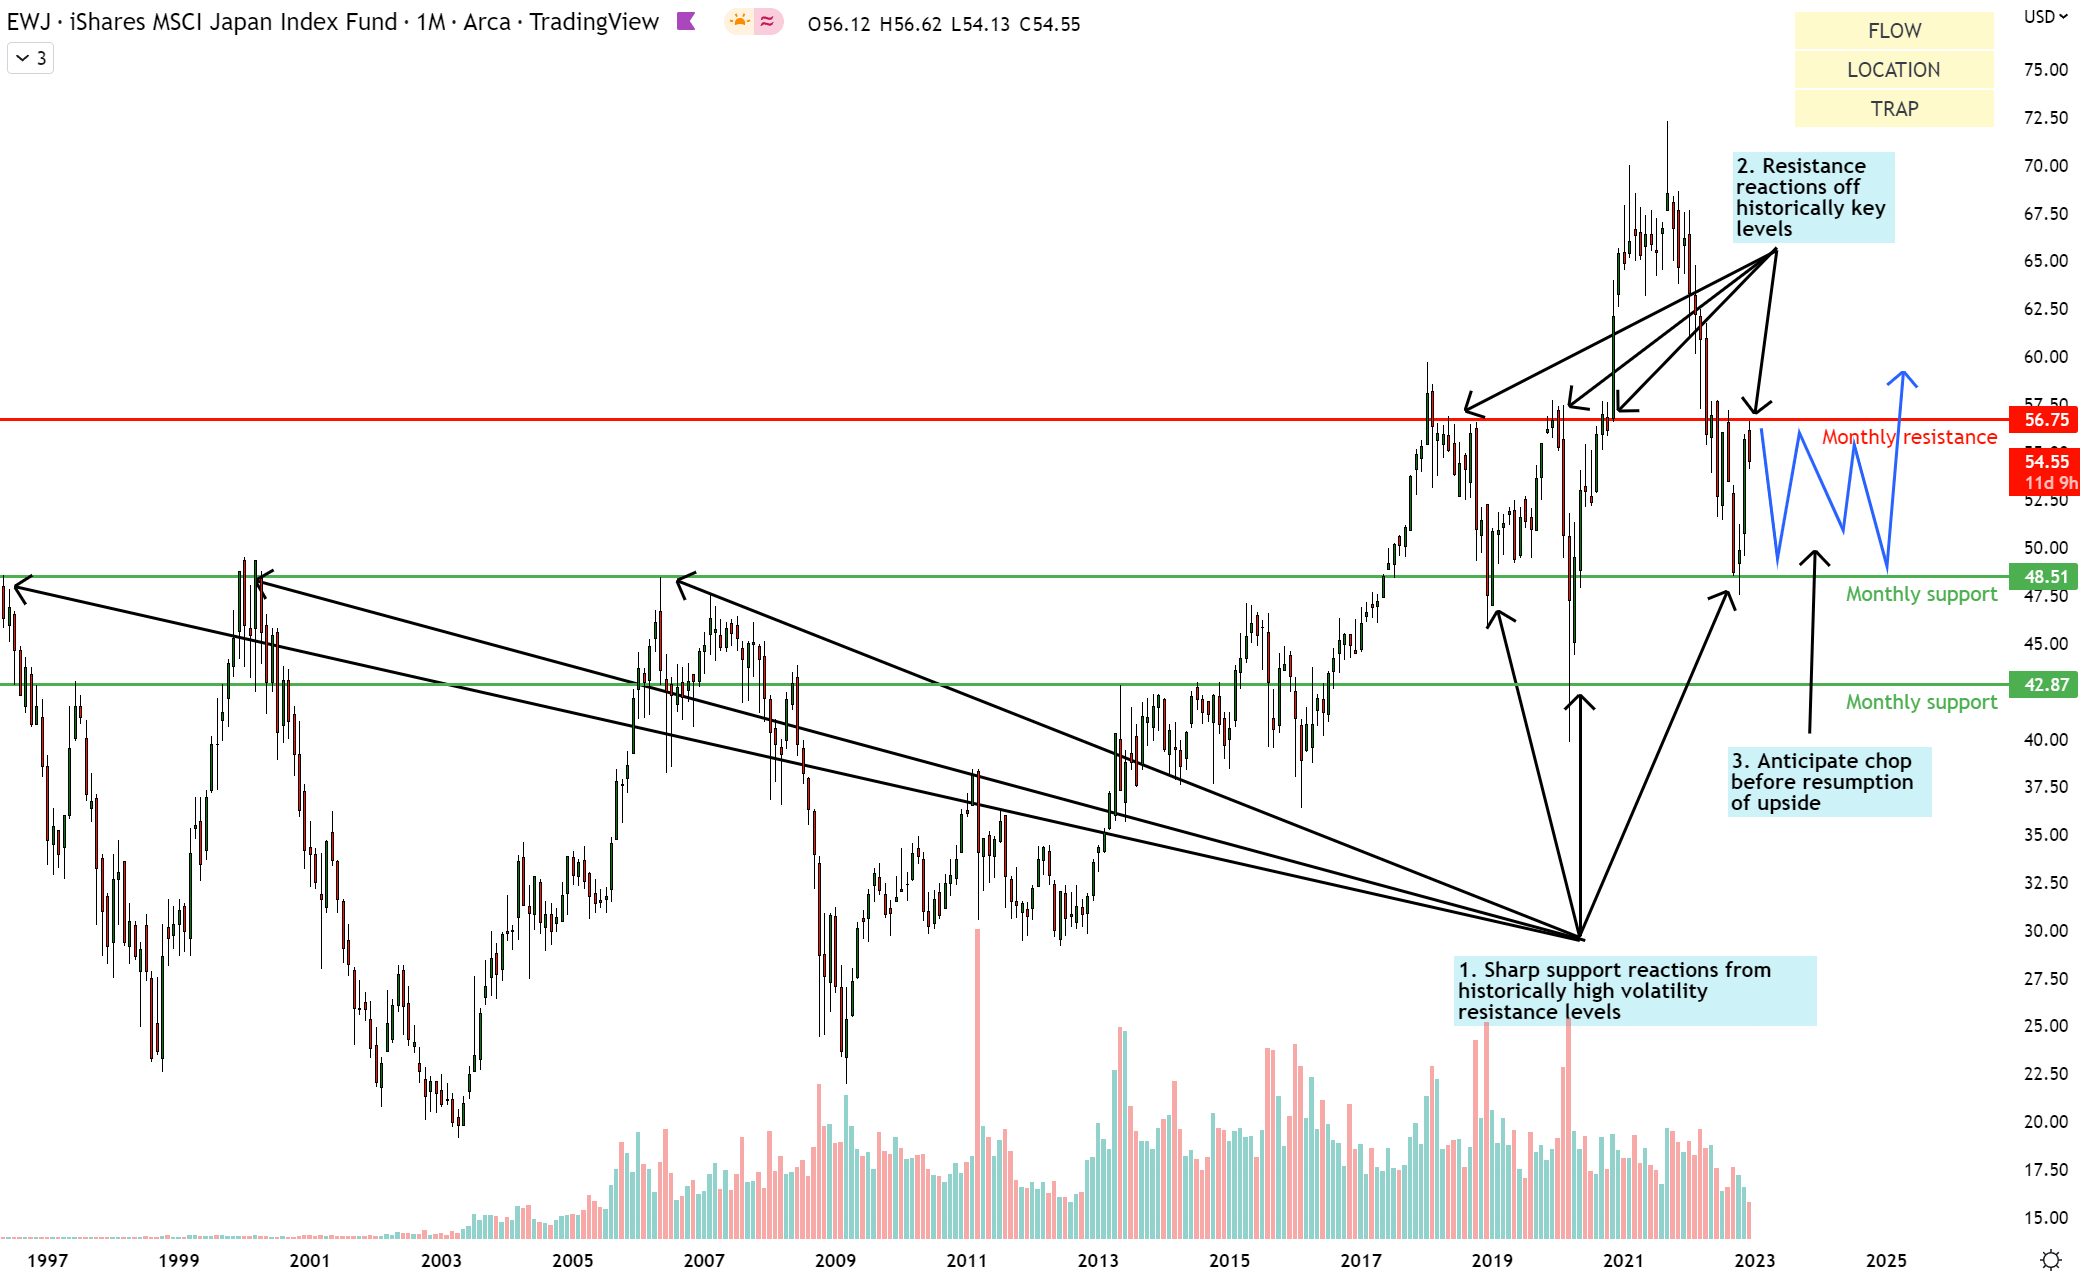
On the absolute chart of EWJ, one can clearly observe key high volatility resistance locations turned monthly support at $48.51 and $42.87. Prices are clearly making higher highs and higher lows, confirming an uptrend flow. Recently, a strong wave of buyers have attempted to make progress and continue making higher highs. However, their advance has been halted momentarily by strong selling pressure at the monthly resistance level at $56.75.
I believe the bullish structure will remain intact, but prices would remain sideways for a while as the market finds a new equilibrium before the next large imbalance. My tentative base case is that prices will eventually poke ahead above the monthly resistance. However, this is likely to be a false breakout trap to the upside so I will be on high alert before risking any capital.
EWJ ETF Composition
I remember 5-6 years ago, I used to invest in deep value stocks in Japan. The vast majority of the opportunities I found were found in the ‘old economy’ sectors such as industrials and non-tech related consumer discretionary. Unsurprisingly, these sectors contribute most to EWJ and the overall Nikkei 225 index:
EWJ ETF Sector Exposure (EWJ ETF Website, Author’s Analysis)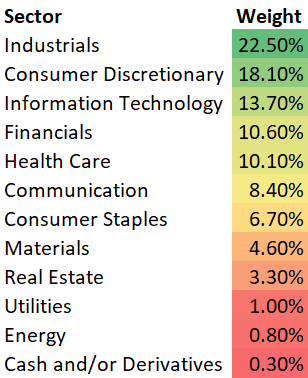
Almost 40.6% of the EWJ ETF is made up of industrial and consumer discretionary stocks. Noteworthily, there is very little exposure into deep cyclical sectors such as energy, real estate and materials. As I ponder portfolio exposures, I can’t help but imagine that amid the current corrections occurring in the capital heavy cyclical stocks, Japan is jumping up and down, screaming, “Pick me!”.
Like sumo wrestlers’ torsos, the Japanese stock market is wide in the middle. Despite industrials having the highest weight, there is no industrials stock in the top 5 holdings of EWJ:
EWJ ETF Top 5 Holdings (EWJ ETF Website, Author’s Analysis)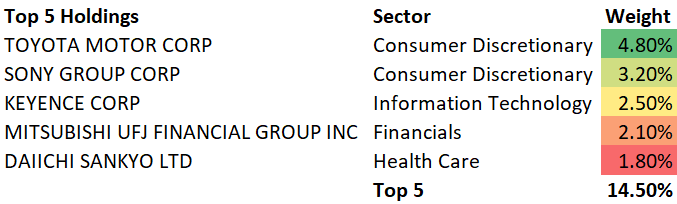
Furthermore, the top 5 holdings only make up 14.5% of the overall index. This is even lower concentration than an S&P500 ETF such as VOO (VOO), whose top 5 holdings make up 17.95% of the overall index. Thus, investing in the EWJ ETF has the additional benefit of very low unsystematic (diversifiable) risk.
Keep An Eye on the PMI!
As Japan’s stock market index and economy is weighted towards industrials and manufacturing, the Japanese Manufacturing PMIs are a key indicator to track. Here is a snapshot of this indicator’s latest position:
Japan Manufacturing PMI (Trading Economics)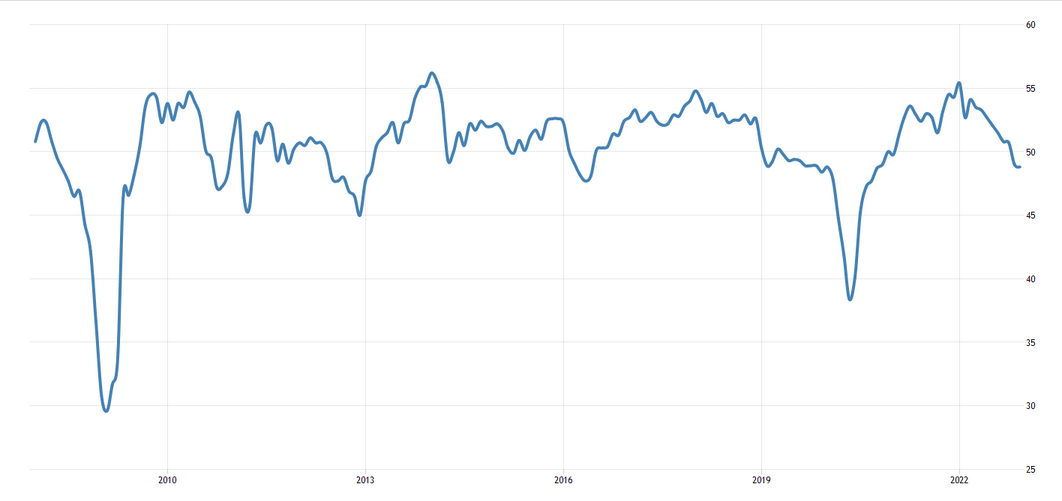
Japan’s Manufacturing PMI has been below 50 for 2 consecutive months now, indicating contraction of factory activity. Industry commentary highlights subdued demand and lingering cost pressures.
I believe the EWJ ETF would be better primed for buys when Japanese industrials get back above 50, which would indicate a resumption of economic expansion. This is the number one indicator on my watchlist as I wait for the right sumo balance of factors to manifest before I buy EWJ.
EWJ Carries A Natural Currency Hedge
The EWJ is not directly hedged against the Japanese Yen. However, I believe this is not as big a concern since Japan usually has a net export position, particularly in manufactured goods. This has the effect of being a natural hedge since when the Yen falls, you can ride the benefit as Japanese companies make more money on their exports. And when the Yen rises, your Japanese Yen denominated holdings rise to offset weaker export volumes.
However, if you prefer an explicit hedge, you can always select the hedged equivalent (HEWJ). The underlying theme is the same for both EWJ and HEWJ.
Be the first to comment