

jetcityimage
Introduction
We are downgrading our rating on Verizon Communications Inc. (NYSE:VZ) from Buy to Hold after disappointing results.
Verizon shares fell 6.7% on Friday (July 22) after the company released Q2 2022 results. Since we initiated our Buy rating in September 2021, VZ stock has lost 14.8% (after dividends), about 4 ppt worse than the S&P 500 index and less than 1 ppt better than AT&T (T), which was Hold-rated in this period:
|
Verizon vs. AT&T Performance (Since 17–Sep-21) 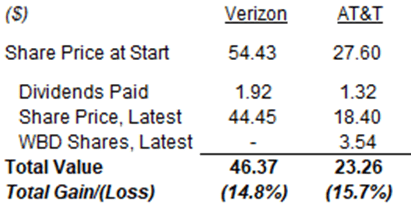 Source: Google Finance and company websites. |
While we were always conscious of the commoditized nature of the U.S. Wireless market, we thought Verizon would be shielded by its premium offering, disciplined execution and Mobile Virtual Network Operator (“MVNO”) partnerships with top U.S. Cable operators. Q2 results showed Verizon was not immune to intensifying sector competition and struggled to pass on higher inflation, and management now expects EBITDA to be flat or down for 2022.
Verizon stock is now trading at 8.6x 2022 guided EPS and a 5.8% Dividend Yield, but our renewed concerns about the risks to Verizon’s profitability from irrational competitors means we no longer view VZ stock as a Buy.
EBITDA Declines in Q2 and Likely FY22
Verizon’s EBITDA fell year-on-year in Q2, and the decline may continue into full-year 2022.
For Q2, group EBITDA fell 2.6% year-on-year and 1.3% sequentially. Revenues were flattish compared to prior periods, but with a mix shift to lower margin Wireless Equipment revenues, and were outpaced by expenses:
|
Verizon Group P&L (Q2 2022 vs. Prior Periods) 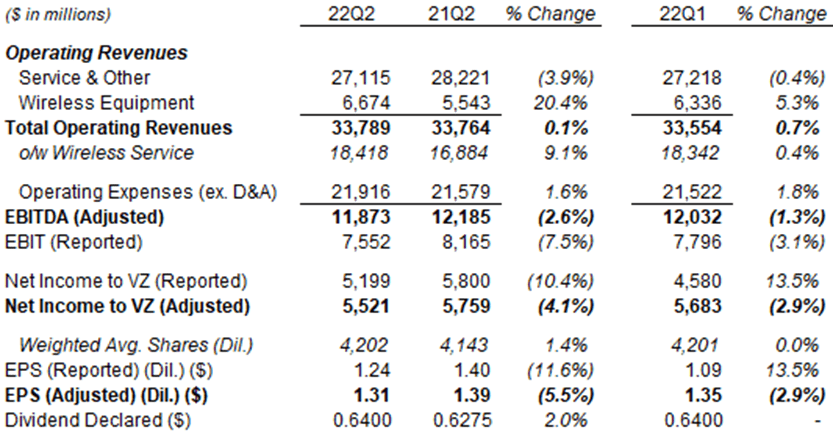 Source: Verizon results supplements. |
Year-on-year growth rates were likely slightly better excluding acquisitions – the acquisition of Tracfone (November 2021) was more than offset by the disposal of Verizon Media (September) in Service & Other revenues in both Q1 and Q2; and similarly in EBITDA in Q1 (there was no explicit reference to Q2).
Verizon experienced inflationary pressures across its cost base in Q2, and expect these to “accelerate” in H2 and negatively impact earnings.
For full-year 2022, management now expect lower growth in revenues, EBITDA to be between down 1.5% to flat (was up 2-3%) and EPS to be $5.10-5.25 (was $5.40-5.55):
|
Verizon 2022 Guidance (Current vs. Prior) 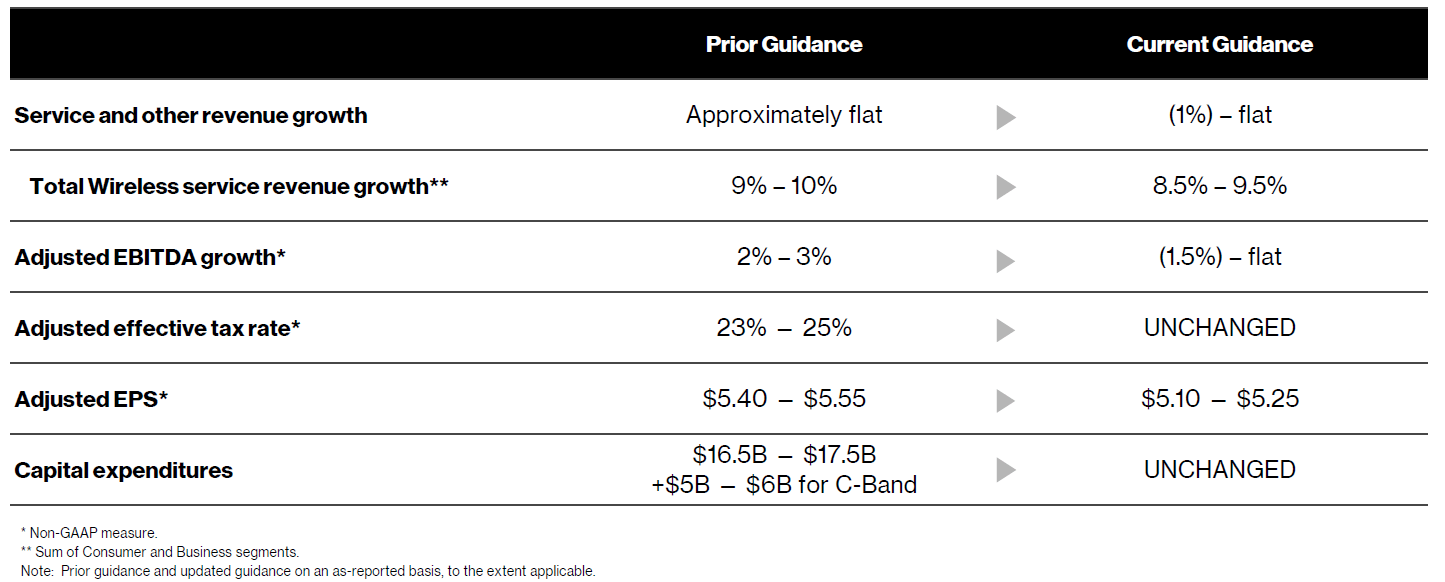 Source: Verizon results presentation (Q2 2022). |
Given year-on-year EBITDA growth was -1.8% in H1, FY22 guidance implies it will be between -1.2% and +1.9% in H2.
Weakness in Q2 results and reduced FY22 guidance showed that Verizon was not immune to intensifying Wireless sector competition and struggled to pass on higher cost inflation.
Consumer: Intensifying Wireless Competition
Wireless’ structural weakness was evident in Consumer, which generated 85% of Verizon’s segment EBITDA in 2021:
|
Verizon Consumer P&L & KPIs (Q2 2022 vs. Prior Periods)  Source: Verizon results supplements. |
Year-on-year, Consumer EBITDA fell 0.3% in Q2, as “higher contribution from TracFone was more than offset primarily by higher promotional activity”. Wireless Service revenues, which form the bulk of high-margin Service revenues, were up 10.5%, mostly from the inclusion of Tracfone Prepaid revenues. In Wireless Retail Postpaid, the segment’s core business, connections were up 1.1% and Average Revenue Per Account (“ARPA”) was up 2.4% – which imply revenues grew by approximately 3.5%. These growth rates were disappointing when compared to today’s near-10% inflation, and ARPA growth may have been driven more by the 1.9% increase in connections per account than by price/mix.
Sequentially, the picture is similar, with Consumer EBITDA falling 1.1%. Wireless Service revenues were flat, with Wireless Retail Postpaid connections rising just 0.1% and ARPA rising just 0.2%. Service revenues also include revenues from Verizon’s MVNO partnerships, and Charter (CHTR) and Comcast (CMCSA) together had 8.23m lines as of Q1 2022, a meaningful figure compared to Verizon Wireless Retail Postpaid connections of 91.4m. However, any growth in these MVNOs did not seem to have made a difference to Verizon’s revenue growth.
CEO Hans Vestberg attributed Wireless’s poor performance to inflation and competition:
The inflationary environment is clearly impacting consumer behavior. And we also saw intensified competition for consumer attention. The result was a significant impact on our gross adds”
His comments indicated Verizon has had to continue introducing promotions through Q2:
(We have) plans and promotions we introduced in May, June and July … While consumer budgets are becoming strained, we continue to find ways of delivering new valuable services … Our new Welcome Unlimited plan is a great example”
Similarly, comments by CFO Matt Ellis suggested that Verizon has delayed price increases, starting only near the end of Q2 and with some phased in, and expect a uptick in churn a:
Our recent administrative fee increase and economic adjustment charge began to show up on customers’ bills in the last few days of the second quarter … while our metered price changes will be phased in throughout the third quarter …
We have assumed in our forward view that we will see a small bubble in churn here in the third quarter as a result of customers as they get those price increases”
We know from our review of AT&T’s Q2 results that AT&T also delayed pricing action in Mobility until June, and their Average Revenue Per User (“ARPU”) rose just 1.1% year-on-year in Q2.
In Consumer Wireline, Fios revenues were flat year-on-year and down 0.5% sequentially, but with growth in high-margin Internet revenues offset by declines in low-margin Video and Voice, which means Fios profits likely increased. Fixed Wireless Access (“FWA”) subscribers grew another 168k during Q2 to 384k, but too few to materially change profitability.
Business: Mixed Performance
Verizon’s Business EBITDA fell 6.5% year-on-year but was up 0.9% sequentially in Q2 2022:
|
Verizon Business P&L & KPIs (Q2 2022 vs. Prior Periods) 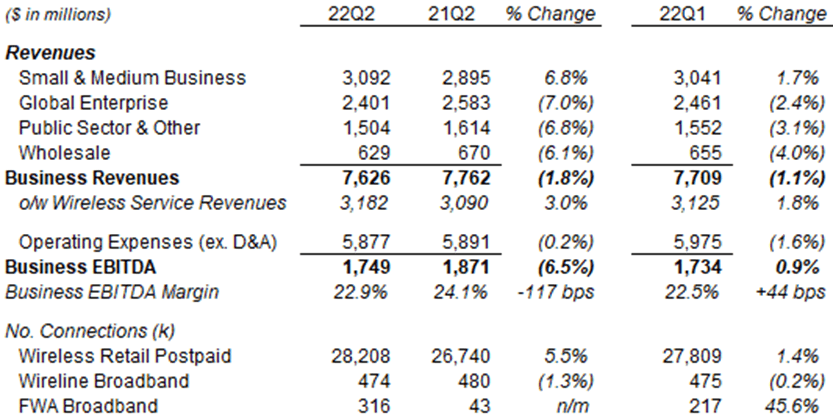 Source: Verizon results supplements. |
The year-on-year EBITDA decline was due to Wireline revenue decline and elevated device subsidies. Wireline revenue decline was the result of ongoing secular headwinds, as well as currency movements and lower federal Universal Service Fund payments this quarter. Elevated device subsidies were the result of higher wireless activations.
Small & Medium Business revenue rose 6.8% year-on-year and 1.7% sequentially, and Wireless Retail Postpaid connections rose 5.5% year-on-year and 1.4% sequentially. The segment also saw FWA connections rose to 316k. However, Wireless Service revenues only rose 3.0% year-on-year and 1.8% sequentially.
For H2 2022, Verizon expects the Business segment to have an EBITDA margin in line with H1, but did not give guidance on revenues.
The Business segment has some bright spots, but these are too small compared to the problems in Consumer.
Better Than AT&T in What Matters
Headline numbers may suggest AT&T has done better than Verizon, but we believe this is a superficial and potentially misleading view. We believe Verizon did better on what matters – actual cashflows.
AT&T’s year-on-year comparisons were flattered by the inclusion of DirecTV-related retained costs ($335m in H2 2022, vs. $700m last year) and distributions ($1.6bn in H2 2022, vs. none last year). Verizon’s year-on-year comparisons were made worse by the disposal of Verizon Media, which we believe more than offset the acquisition of Tracfone.
In addition, we believe AT&T has engaged in aggressive promotions that improved short-term P&L figures, but reduced current cashflows and may ultimately destroy value.
On adjusted figures, looking at revenues and EBITDA for Q2 alone, Verizon’s performance was 2-3 ppt weaker than AT&T in terms of year-on-year growth. However, Verizon’s Operating Cashflows were 0.9% higher than last year, while AT&T’s fell by 24.5%. The contrast in Free Cash Flow (“FCF”) was even more stark – AT&T’s FCF collapsed by 78.8% year-on-year in Q2, partly due to frontloaded CapEx:
|
AT&T & Verizon Key Financials (Q2 2022 vs. Prior Periods) 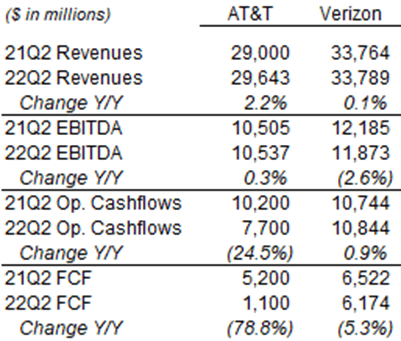 Source: AT&T and Verizon filings. NB. Excludes DirecTV-related costs and distributions. |
The picture is similar for H2. The difference in EBITDA declines between the two companies was less conclusive (1.0% vs. 1.8%), but AT&T’s Operating Cashflows have fallen 22.7% while Verizon’s have fallen 13.6%:
|
AT&T & Verizon Key Financials (H1 2022 vs. Prior Periods) 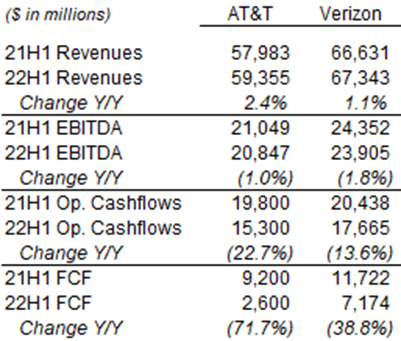 Source: AT&T and Verizon filings. NB. Excludes DirecTV-related costs and distributions. |
At AT&T, working capital represented a cash outflow of $2.77bn in H1 2022, twice as much as in the year before ($1.36bn), with “Deferred Customer Contract Acquisition and Fulfillment Costs” worsening by $900m.
AT&T has started to experience collection delays and a rise in bad debts, with slower collection alone responsible for a $1bn reduction in cashflow in Q2:
On the consumer side of our business, we’re seeing an increase in bad debt to slightly higher than pre-pandemic levels as well as extended cash collection cycles … it’s taking about 2 more days than last year to collect customer receivables. The impact of this is almost $1 billion for the quarter”
John Stankey, AT&T CEO (Q2 2022 earnings call)
By contrast, Verizon has observed no change in customer collections.
We believe a substantial part of AT&T’s worsening cashflows is in device subsidies (paid with a time lag of 1.0-1.5 quarters). Device subsidies have been a bane of the Wireless sector in the past. They increase sales in but lower margins; their costs are recognised over time but cash has to be paid upfront.
In addition to the cashflow reduction, AT&T Mobility’s EBITDA / Service revenue margin fell 1.2 ppt year-on-year in Q2, having fallen 2.0 ppt last year:
|
AT&T Mobility / Service Revenue Margin (Since 2020) 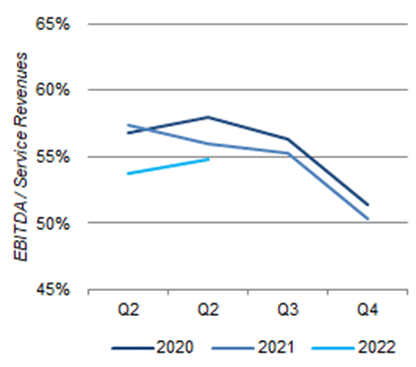 Source: AT&T filings. |
Competition has clearly pressured Verizon profits already. We are concerned that AT&T’s competitive behavior has become irrational and will remain so, creating more damage.
Read-Across for U.S. Cable
Like AT&T’s before it, Verizon’s results seem to indicate more of the same for U.S. Cable in Q2 2022, with low net adds due to lower activity level sector-wide.
Verizon’s Consumer segment had a total broadband net add of 13k in Q2, with Fios Internet net add of 30k offset by a non-Fios broadband net loss. Fios Internet revenues were not disclosed implied to have grown year-on-year.
AT&T’s Consumer Wireline segment similarly had a total broadband net loss of 25k (excluding DSL), with fiber net add of 316k more than offset by a non-fiber net loss. IP Broadband ARPU grew 5.3% year-on-year.
Verizon CFO specifically referenced lower sector activity level during the quarter:
While Fios Internet churn remains well below pre-pandemic levels, we are seeing softer gross adds due to lower-than-expected switching activity from moves and fewer new home purchases”
Matt Ellis, Verizon CFO (Q2 2022 earnings call)
Verizon’s Fixed Wireless offering is more of a concern, with net add accelerating to 168k in Q2 on the Consumer side, and management expect this to accelerate further in H2. However, this is a miniscule figure compared to total broadband bases of 30m+ each at Charter and Comcast, and we continue to believe that many Fixed Wireless subscribers represented new demand that was not served before:
|
Verizon Fixed Wireless Net Adds (Last 5 Quarters) 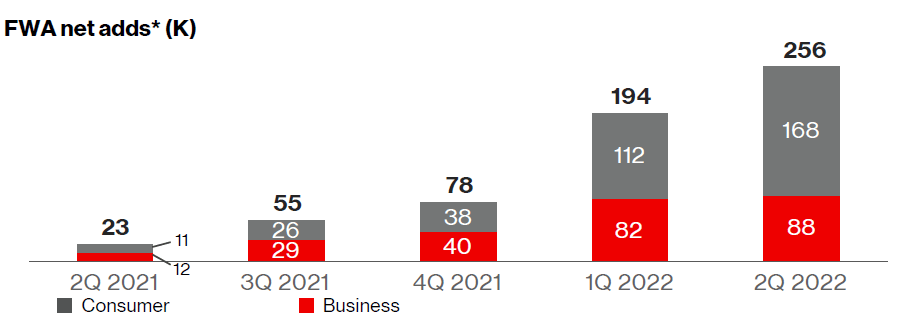 Source: Verizon results presentation (Q2 2022). |
Charter CFO Jessica Fischer had commented at an investor conference on June 15 that she did “expect” Charter’s Q2 broadband net adds to be positive excluding a 60-70k impact from the transition between different federal assistance programs (EBB and ACP), and “think” they will be positive even including this impact.
Verizon Dividend Yield & Valuation
At $44.45, relative to the mid-point of 2022 EPS guidance ($5.10-5.25), VZ stock is at a P/E of 8.6x.
Relative to 2021 financials, VZ stock is at a P/E of 8.3x and a Free Cash Flow (“FCF”) Yield of 10.3%:
|
Verizon Earnings, Cashflows & Valuation (Since 2018) 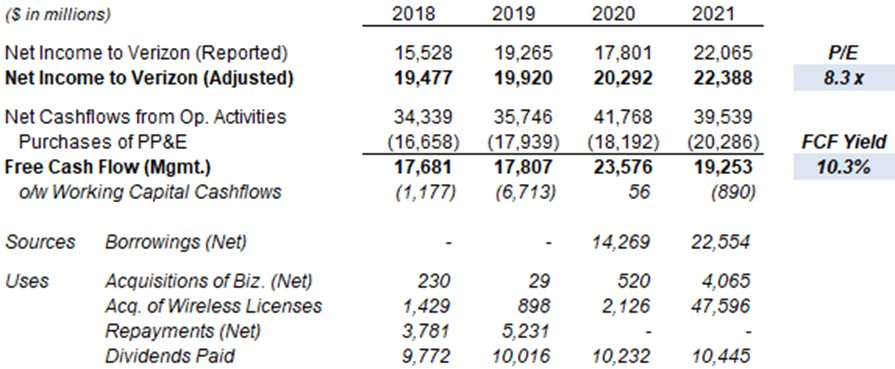 Source: Verizon company filings. NB. 2020 benefited from a $2.2bn cash tax benefit related to the sale of shares in a foreign subsidiary and a $764m interest rate swap settlement (among others). |
Excluding $2.1bn of C-band CapEx in 2021, recurring FCF was $21.4bn FCF Yield would have been 11.4%.
VZ stock pays a dividend of $0.64 per quarter ($2.56 annualized), which represents a Dividend Yield of 5.8%. Paying the dividend costs just under $11bn, nearly 2x covered by the recurring FCF. Verizon expects to continue to grow the dividend.
Net Unsecured Debt / EBITDA was 2.7x at Q2 2022, down 1.0x sequentially; the target range is 1.75-2x, expected to be reached in 4-5 years as deleveraging continues after the C-band acquisition in 2021. Net Debt / EBITDA was 3.1x.
Is VZ Stock a Buy?
We downgrade our rating on Verizon stock to Hold.
Be the first to comment