

South African Rand Dollar Talking Points:
- USD/ZAR soars after SA President Cyril Ramaphosa is found guilty of misconduct
- Rand tanks after bouncing off psychological support at 17.00
- USD weakness offset by news of potential impeachment
Recommended by Tammy Da Costa
Introduction to Forex News Trading
South African President Cyril Ramaphosa Considers Resigning Ahead of Allegations of Misconduct
Cyril Ramaphosa is considering resigning after a misconduct report placed the South African president in hot water. With the inquiry centered around a 2020 farm robbery that became public knowledge in June this year, the president faces potential impeachment after being found guilty of violating his oath of office.
In June this year, a media statement revealed that an undisclosed amount of foreign currency (estimated $4 million) in cash was stolen from the president’s private farm (Phala Phala) in February 2020. The money that had been concealed in a sofa triggered an investigation into the origins of the funds and whether the funds had been declared to SARB (South African Reserve Bank).
With private investigators hired to investigate the robbery, the incident has raised controversy around the President’s ability to serve a second term in office.
As Ramaphosa considers resigning before the impeachment hearing on 6 December, the South African Rand has experienced its largest decline since May.
Introduction to Technical Analysis
Market Sentiment
What Drives Sentiment?
USD/ZAR Technical Analysis
After trading between a narrow range of 16.88 – 17.00 throughout the week, the bearish move was invalidated as buyers flocked towards the safe-haven Dollar.
With USD/ZAR gaining approximately 3% on the day, a rejection of the 17.957 handle has provided temporary relief to the volatile Rand.
Visit DailyFX to Discover the Most Volatile Currency Pairs and How to Trade Them
USD/ZAR Daily Chart
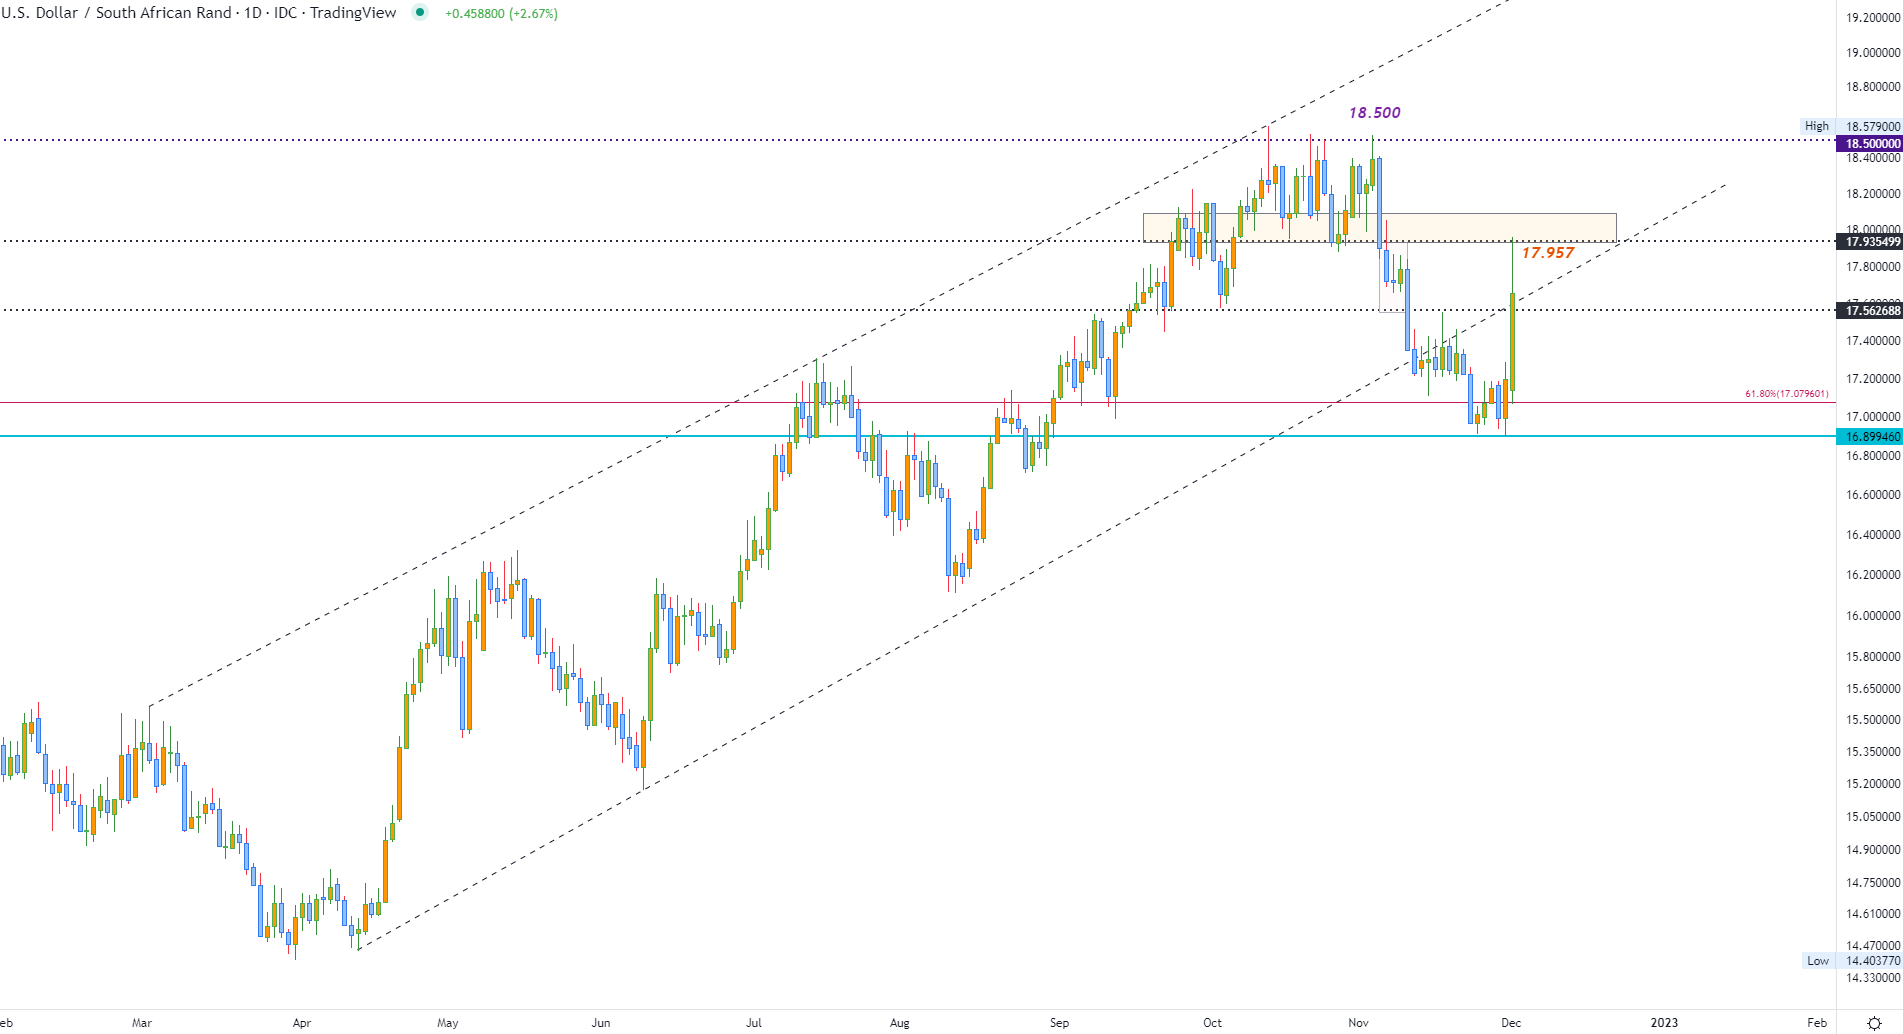
Chart prepared by Tammy Da Costa using TradingView
As price action heads back towards the rising channel that provided support and resistance for the pair, a long wick on the daily chart highlights a strong zone of resistance around the key psychological level of 18.00. If prices can hold above this level, a move above the 78.6% Fibonacci of the 2020 – 2021 move at 18.076 could bring the 18.500 back in play.
— Written by Tammy Da Costa, Analyst for DailyFX.com
Contact and follow Tammy on Twitter: @Tams707
Be the first to comment