

DOW JONES, HANG SENG INDEX, ASX 200 INDEX OUTLOOK:
- Dow Jones, S&P 500 and Nasdaq 100 indexes closed -1.42%, -1.01% and -0.99% respectively
- Western powers unveil new sanctions on Russia after it recognized two breakaway regions in eastern Ukraine
- Asia-Pacific equities opened modesty higher. The RBNZ raised interest rate by another 25bps
Dow Jones, Ukraine, RBNZ, Hong Kong, Asia-Pacific at Open:
The Dow Jones Industrial Average fell for a third day as heightened geopolitical tensions surrounding Ukraine’s border continued to weigh on market sentiment. The US and its allies are ramping up sanctions on Russia after Moscow recognized the independence of two breakaway regions in eastern Ukraine on Tuesday. Washington said the move was part of Moscow’s attempt to create a pretext for a further invasion of Ukraine. In the near term, geopolitical news will continue to dominate headlines and drive market sentiment.
US sanctions will target Russia’s sale of sovereign debt abroad and the country’s elites, which fell short of the devastating measures that had been threatened. This alleviated concerns about potential supply-chain disruptions and an escalation of military conflict. As a result, US equity futures rebounded during Wednesday’s APAC morning trade. Stocks in Hong Kong, Australia and mainland China are trading modestly higher, while the Japanese market is shut for a holiday.
The RBNZ raised interest rate by 25bps to 1% as expected this morning, sending NZD higher against its major peers. The central bank sees the cash rate rising to at least 2.5% by early 2023 due to heightened inflation in the country. It sees inflation accelerating to 6.6% in Q1 2022 and doesn’t see it returning to the 1-3% range until Q2 2023. The RBNZ’s hawkish-biased stance may set a model for the Federal Reserve, which is also facing the highest inflation in four decades and rising commodity prices. The latter would probably make inflation more ‘entrenched’ than expected, spurring speculations for more aggressive tightening measures.
Hong Kong’s Hang Seng Index (HSI) rebounded nearly half a percent today after tumbling 2.8% a day ago amid intensified fears about regulatory scrutiny on some of China’s largest tech firms, such as Alibaba and Meituan. Lingering geopolitical risks further weighed on market sentiment, sending Hong Kong’s equity benchmark to a six-week low.
Meanwhile, the city will conduct mandatory mass testing of Covid-19 cases over the next 3 months to curb the rapid spread of viral cases. Strict social-distancing measures will be impost until the end of April. There will also be an extension of the ban on inbound flights from nine countries including the US, UK and Australia. Stricter measures may exert negative impact on the city’s growth prospects in the near term as the battle against Covid-19 intensifies.
Crude Oil Price – Daily
Chart created with TradingView
Looking ahead, GfK consumer confidence index dominates the economic docket alongside and Euro area core inflation rate. Find out more from the DailyFX economic calendar.
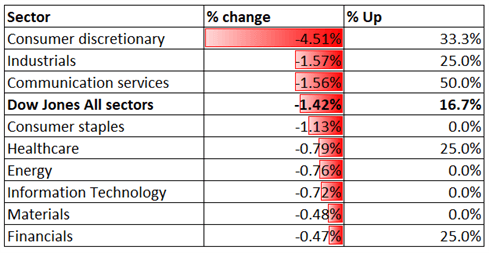
Looking back to Tuesday’s close, all 9 Dow Jones sectors ended lower, with 83.3% of the index’s constituents closing in the red. Consumer discretionary (-4.51%), industrials (-1.57%) and communication services (-1.56%) were among the worst performers.
Dow Jones Sector Performance 22-02-2021
Source: Bloomberg, DailyFX
Dow Jones Index Technical Analysis
The Dow Jones Industrial Average has likely completed a “Double Top” chart pattern as indicated on the chart below. Prices are riding a strong downward trend, scrapping a key support level of 33,830. Breaching this level may open the door for further downside potential with an eye on 33,300. The MACD indicator formed a bearish crossover beneath the neutral midpoint, underscoring bearish momentum.
Dow JonesIndex – Daily Chart
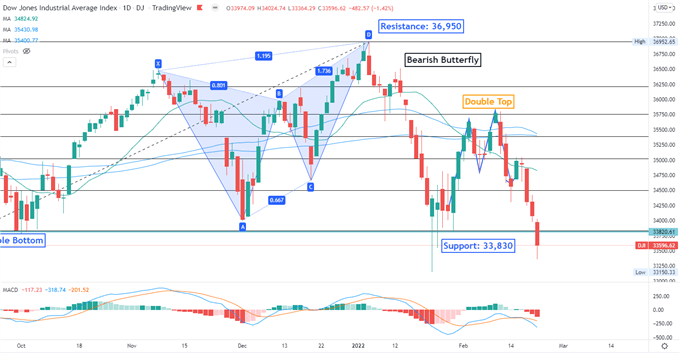
Chart created with TradingView
Hang Seng Index Technical Analysis:
The Hang Seng Index (HSI) has likely breached below the “Ascending Channel” as highlighted on the chart below, opening the door for further downside potential. An immediate support level can be found at around 24,040 – the 161.8% Fibonacci extension. Breaching below this level may expose the next resistance level of 23,070. The MACD indicator is trending lower above the neutral midpoint, suggesting that near-term momentum has turned bearish.
Hang Seng Index – Daily Chart
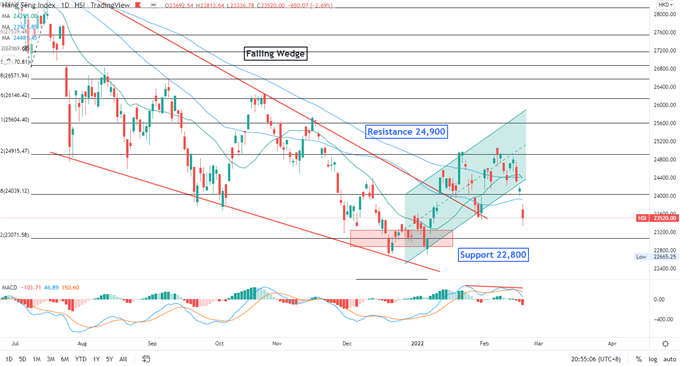
Chart created with TradingView
ASX 200 Index Technical Analysis:
The ASX 200 index has rebounded after a meaningful correction in January. Prices are challenging the 61.8% Fibonacci retracement – a key resistance level. Breaching this level will likely intensify buying pressure and open the door for further upside potential with an eye on 7,435. The MACD indicator is about to form a bearish crossover beneath the neutral midpoint, suggesting that selling pressure may be building.
ASX 200 Index – Daily Chart
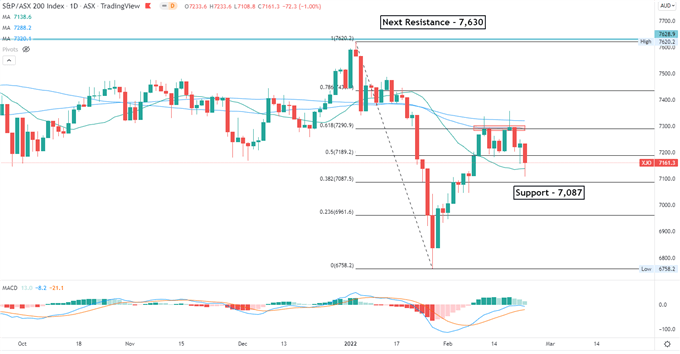
Chart created with TradingView
— Written by Margaret Yang, Strategist for DailyFX.com
To contact Margaret, use the Comments section below or @margaretyjy on Twitter
Be the first to comment