

The ICT Power of 3 is a price action model describing how markets move through three phases: accumulation, manipulation, and distribution. Also called the AMD trading model, it sits within the Inner Circle Trader framework. Traders use it to interpret institutional behaviour and shape their own market analysis. Recognising these phases may help traders assess potential areas of interest and align their strategies with broader market dynamics.
This article outlines the core principles of the Power of 3 framework, providing a detailed examination of how it is applied in the context of institutional order flow and market structure.
Introduction to the ICT PO3 Trading Model
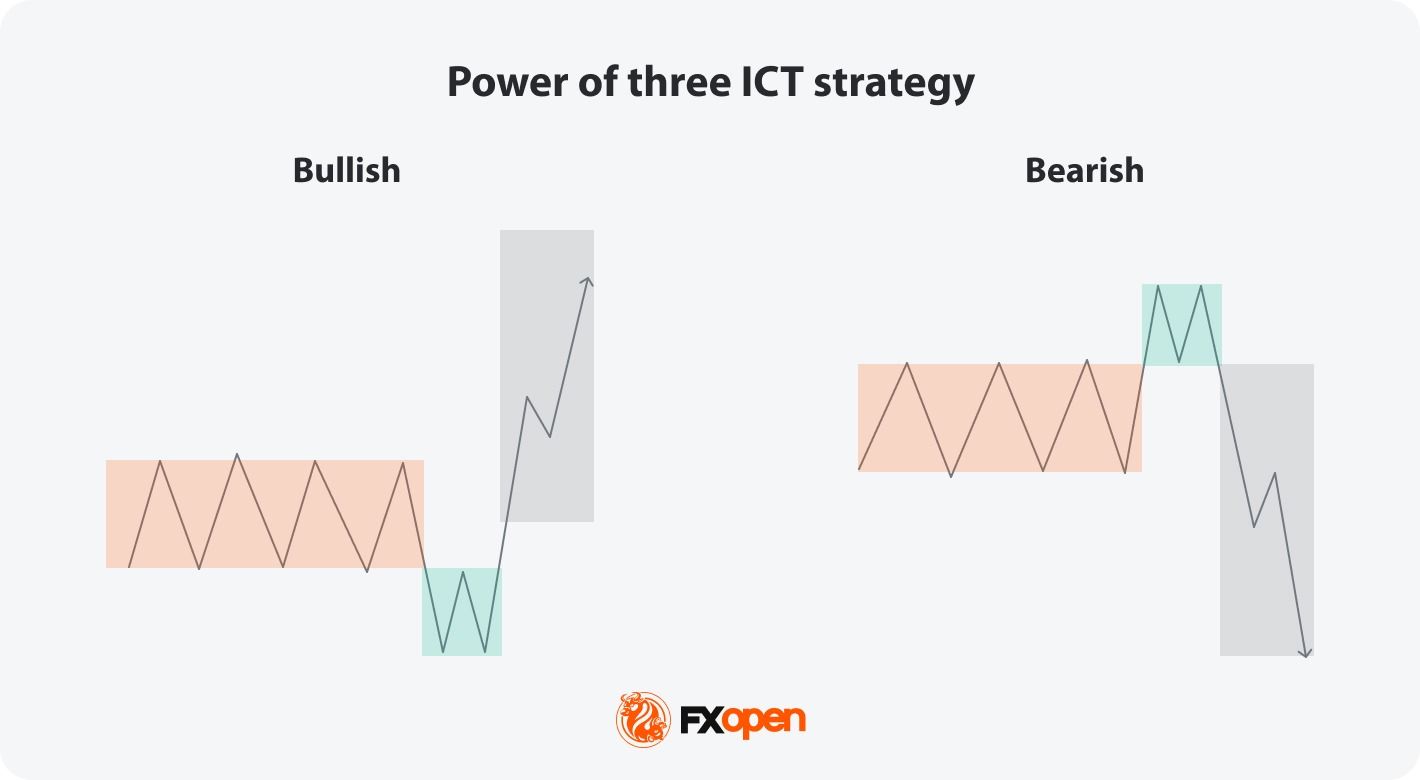
The ICT Power of 3 was developed by Michael J. Huddleston, better known as the Inner Circle Trader. The model, often referred to as the AMD trading model, divides price behaviour into three phases that repeat across timeframes and instruments. Accumulation builds positions inside a range. Manipulation pushes price beyond that range to capture liquidity. Distribution then drives the directional move that follows.
Traders use ICT PO3 to combine liquidity analysis, smart money concept trading, and market structure inside one framework. The activity these phases describe is typically attributed to institutional investors, whose order flow sits behind larger moves. Power of 3 trading applies to forex and indices, commodities, stocks, and cryptocurrencies*, though liquidity profiles vary between asset classes.
Below, we’ll discuss each of these three phases in more detail. Consider following along on FXOpen’s TickTrader trading platform.
Accumulation Phase (PO3)
The accumulation phase is the first stage of the ICT Power of 3 model. It involves relatively low volatility and sideways price movement, typically near key support or resistance levels. During accumulation, the market ranges within a narrow band as large traders gradually build positions without significantly driving up price.
The range is where liquidity builds. Stop losses cluster just outside the highs and lows, creating the order pools targeted in the next phase.
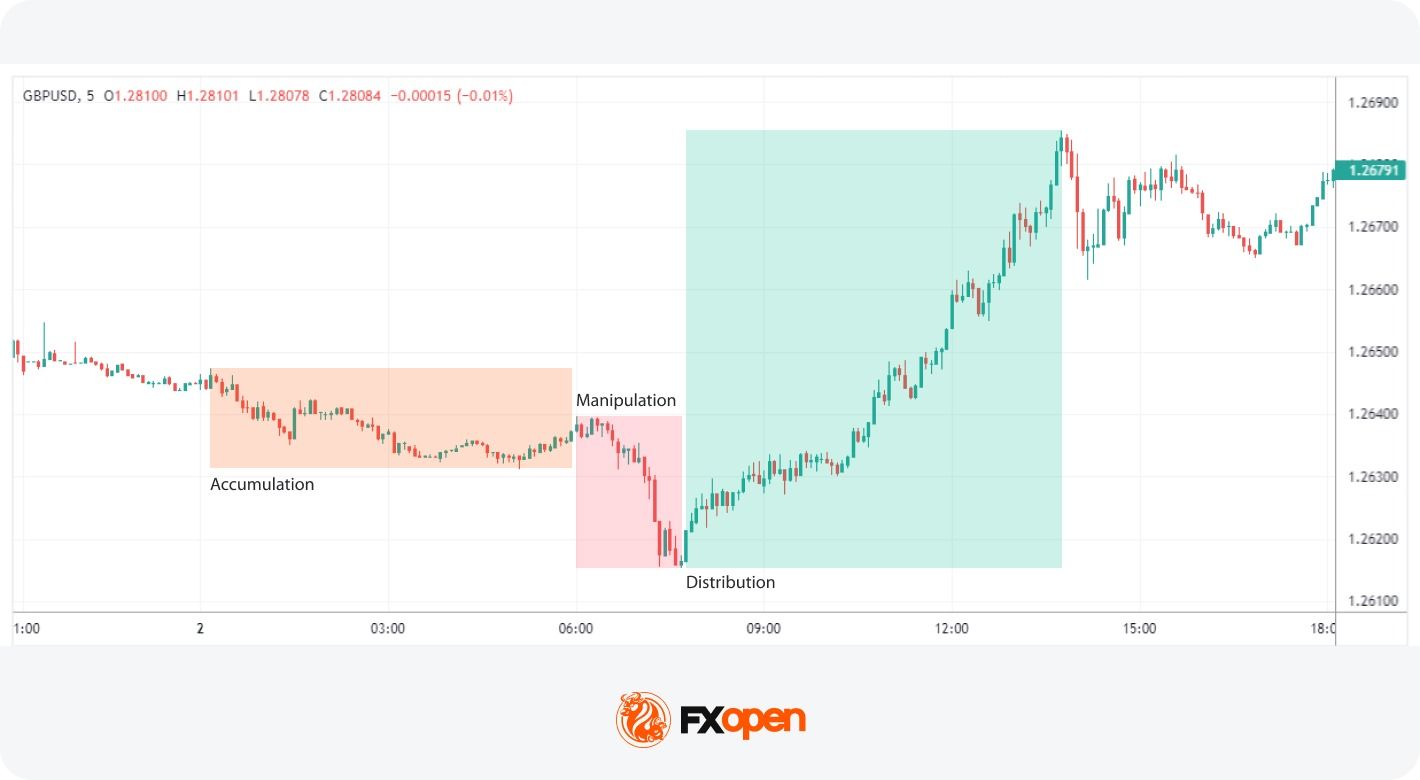
For example, GBPUSD may stall inside a 30-pip range below a recent swing high for several sessions. That consolidation, with shrinking candle bodies and steady volume, is a typical accumulation setup. The narrower the range, the more compressed the liquidity sitting above and below it becomes.
Recognising the accumulation phase involves monitoring for typical signs such as:
- Low Volatility: The asset trades within a tight range, showing little directional bias.
- Key Levels: Accumulation often occurs near historical support or resistance levels where the price is deemed under or overvalued by institutional investors.
- Increased Volume: There may be a gradual rise in volume as smart money accumulates positions, signalling their interest without causing sharp price movements.
Accumulation is most often analysed on higher timeframes such as the 4-hour or daily chart, while lower timeframes show the range mechanics.
Manipulation Phase (Liquidity Sweep)
The manipulation phase is a pivotal part of the ICT PO3 trading strategy. This stage is marked by deliberate actions from institutional investors to create market conditions that mislead and trap retail traders. Also called a liquidity sweep or stop raid, manipulation typically occurs around session opens (often London and New York), previous day highs and lows, and equal highs or lows where stop orders tend to cluster.
Signals of the manipulation phase include:
- Stop hunts: Sharp moves beyond the accumulation range that trigger clustered stop loss orders.
- False breakouts: Sudden moves that look like a breakout but reverse back into the range.
- Directional context: In a bullish setup, the sweep typically dips below the range. In a bearish setup, it spikes above.
- Failure to hold beyond the level: Candles close back inside the range rather than extending.
- Movement against higher timeframe direction: Common after a prolonged trend, signalling potential exhaustion.
These moves create liquidity, allowing larger traders to build positions at more favourable prices. Liquidity sweep trading relies on identifying these reversals once the sweep completes.
For example, on GBPUSD, price may consolidate inside a tight range through the Asian session. At the London open, a sharp dip of around 25 pips clears stops below the range, then reverses back inside within minutes. That sequence is a typical manipulation phase in trading, meaning the engineered move clears liquidity before the real direction emerges.
Distribution Phase (Expansion Move)
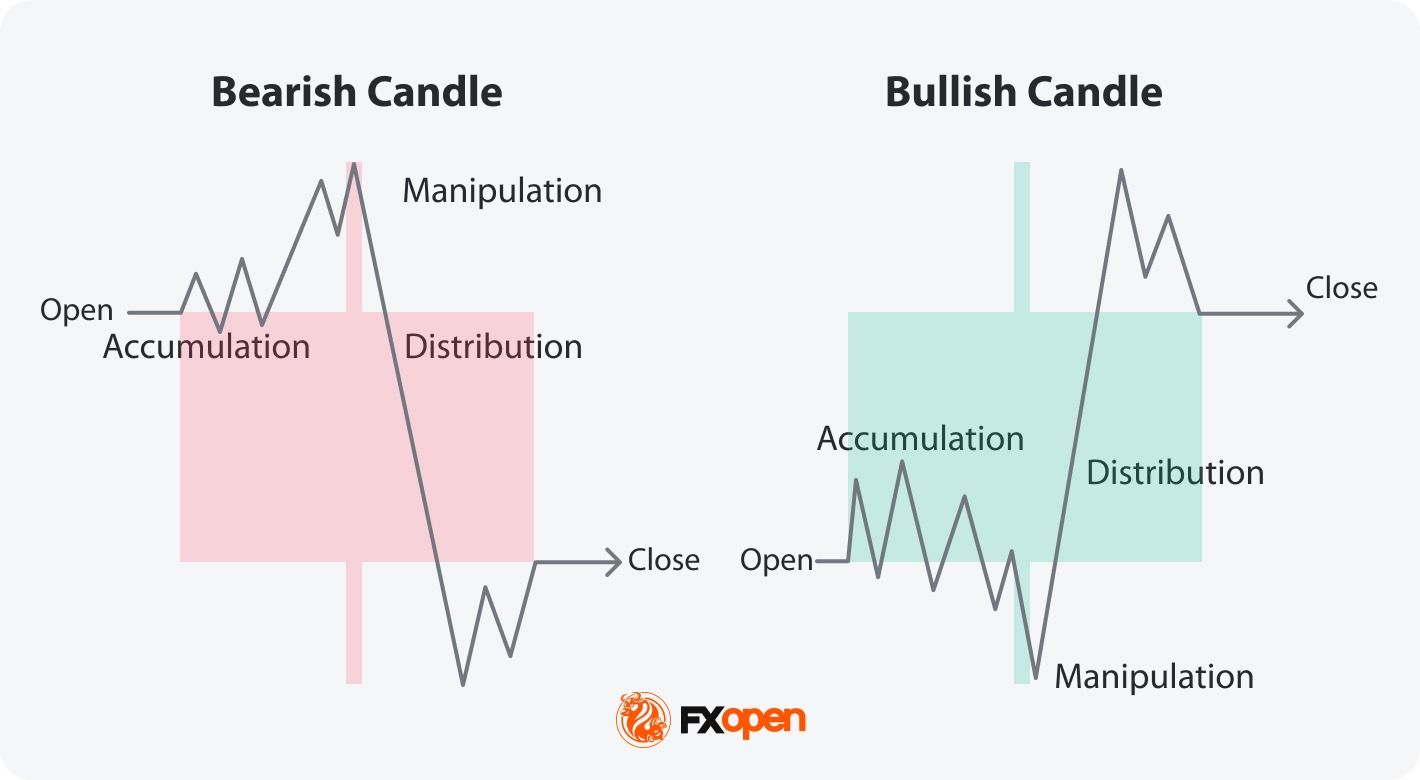
The distribution phase is the final stage in the Power of 3 trading strategy, where positions built during accumulation are realised. It is also called the expansion move, since price extends sharply in the intended direction after the manipulation phase completes.
Confirmation signals of the distribution phase include:
- Strong directional candles: Sustained movement with large candle bodies in the expansion direction.
- Market structure break: The high or low of the accumulation range is traded through decisively.
- Volume expansion: Increased volume during the move, indicating active participation.
- Holding beyond the level: Candles close and stay beyond the broken structure rather than reversing back.
- Confluence with higher timeframe direction: The expansion aligns with the broader trend.
Distribution phase forex setups are commonly analysed once a market structure break confirms the move. Traders may use moving averages or support and resistance levels to potentially help confirm the transition.
For example, on GBP/USD, after a manipulation sweep below the Asian range at the London open, price reverses, breaks above the prior range high, and extends 60 pips into the New York session. The market structure break and sustained candles confirm the expansion move is underway.
Applying PO3 in Market Analysis
ICT PO3 is typically applied through a structured workflow that moves from higher timeframe context down to lower timeframe execution. The five steps below outline how ICT PO3 works in practice:
- Set the daily bias on a higher timeframe (4-hour or daily).
- Mark the day’s opening price on the chart.
- Identify the manipulation move beyond the day’s open and range boundaries.
- Confirm the entry on a lower timeframe (5-minute or 15-minute).
- Manage the position with stops beyond the manipulation extreme.
Setting the Daily Bias
Traders often start by establishing their market bias for the day. This involves analysing higher timeframes to determine the overall market trend. Understanding whether the market is bullish or bearish sets the foundation for the day’s trading strategy.
The higher timeframe directional context, typically taken from the 4-hour or daily chart, sets the side of the market traders look to align with intraday.
Marking the Day’s Open
After setting the bias, traders mark the opening price of the day. This price point often acts as a reference level for intraday price movements and liquidity analysis.
The daily open often sits close to overnight liquidity pools, and price reactions around this level may reveal whether short-term moves align with the higher timeframe direction.
Identifying Manipulation
Traders look for price movements beyond the day’s open and the established range boundaries. For a long bias, they observe for manipulation below the open, while for a short bias, they look above the open. This stage is important as it indicates where smart money may manipulate the market to create liquidity.
Resting liquidity tends to sit above swing highs and below swing lows, and the manipulation phase typically targets these areas before the expansion move begins.
Entry Confirmation
While a trader can simply enter once price trades beyond the day’s open, many choose to confirm the trade. Using a 5- and 15-minute charts, they might look for signals such as:
- A Change of Character (ChoCh).
- Price rejection at a key swing high or low.
- Candlestick reversal patterns such as a hammer, shooting star, or engulfing candle.
- Momentum slowing in the manipulated direction.
A ChoCh is a break in short-term market structure that may signal a shift in momentum, often appearing as the first lower timeframe sign that the manipulation move is exhausted.
Traders typically place stop losses beyond the manipulation high or low to potentially manage risk here.
Distribution Phase
If an entry is missed during the manipulation phase, traders can look for entries during the distribution phase. Although this phase may offer a less favourable risk-to-reward ratio, it still may have trading potential. Continuation entries could be taken after a market structure break, ChoCh and a pullback, with stops placed beyond a recent swing point.
ICT Power of 3 Example
The example below illustrates how the ICT Power of 3 (PO3) model may appear on an intraday chart.
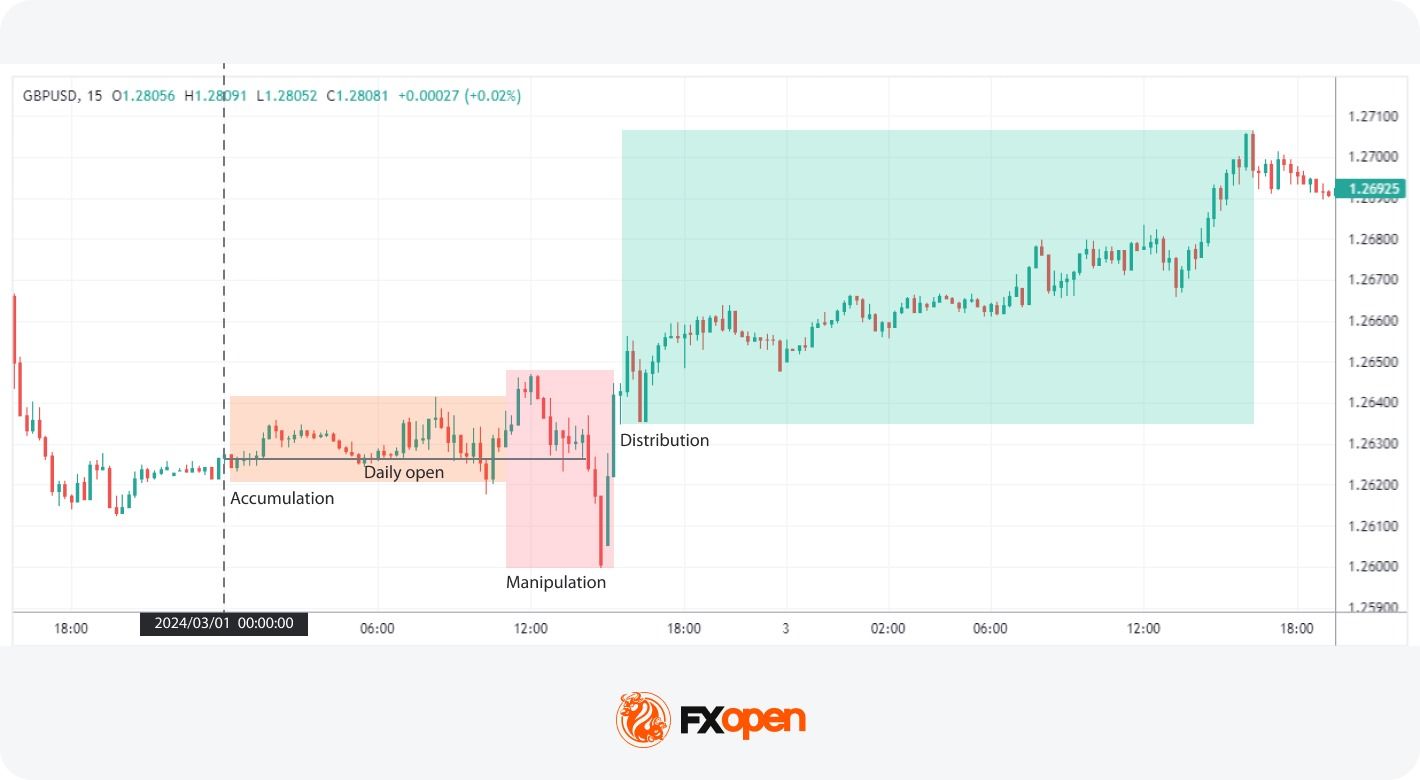
Accumulation: On the GBP/USD 15-minute chart, the day open acts as a support level. Price ranges sideways above this level, building liquidity inside a narrow band.
Manipulation: A candle wicks below the range, briefly clearing stops sitting under the swing low. Price then breaks above the range, only to reverse sharply back inside — a clear liquidity sweep across both sides of the accumulation band.
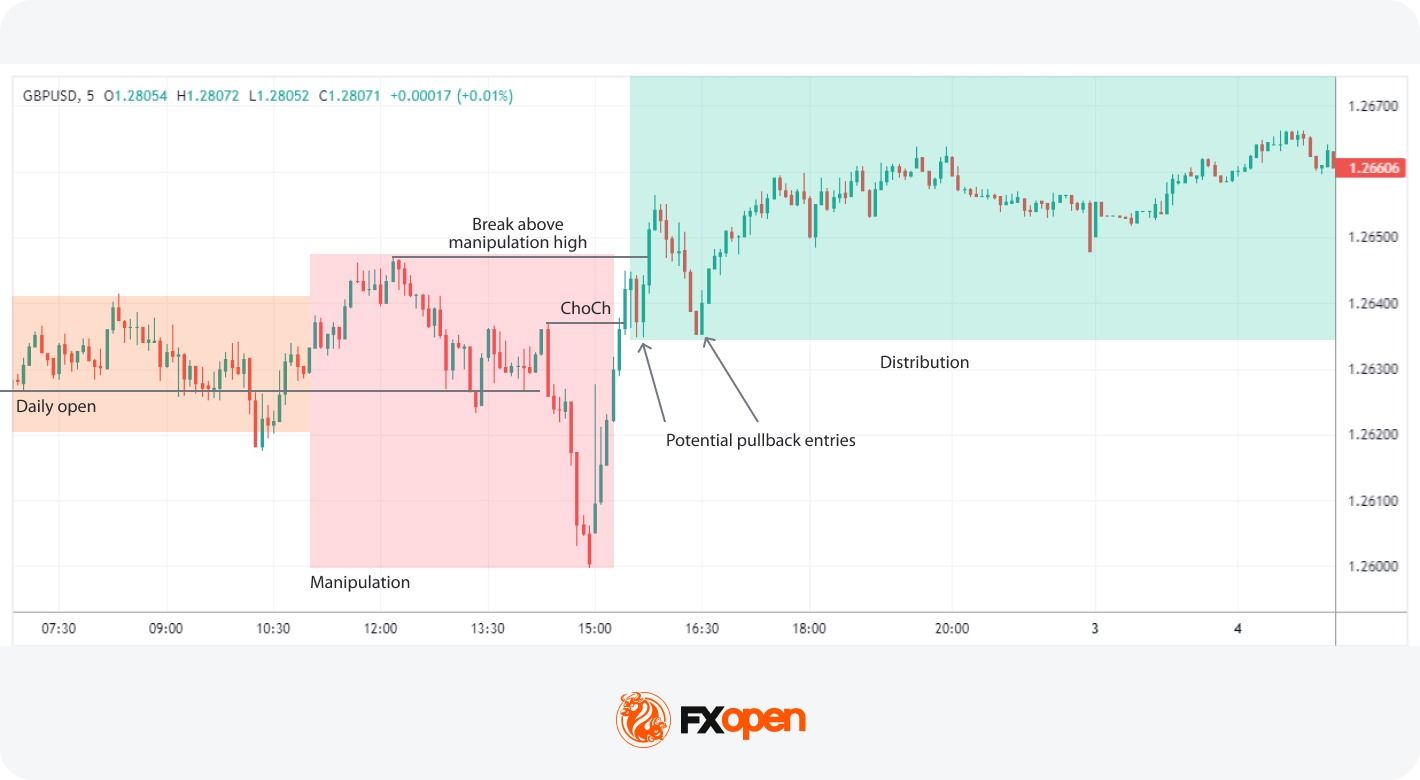
Distribution: On the 5-minute chart, a ChoCh forms as price breaks the downtrend structure. Price pulls back, then breaks above the manipulation high, signalling a bullish expansion move. Subsequent pullbacks may offer entries for traders who missed the initial sweep before price marks up further.
PO3 vs Other Price Action Models
PO3 trading shares ground with other price action approaches but differs in how it interprets price moves around key levels.
Breakout trading typically treats a move beyond a range as a signal of continuation. ICT PO3 treats the same move with caution, since the manipulation phase often produces a false breakout before the real expansion. Where a breakout trader may enter on the break, a PO3 trader often waits for the sweep to reverse and confirm direction on a lower timeframe.
Trend trading focuses on aligning with the broader directional move. Power of 3 trading incorporates trend context through the daily bias step but adds a structural framework around accumulation and liquidity, rather than relying on indicator-based trend signals such as moving averages or trendlines.
Limitations of PO3
The PO3 ICT strategy has limitations traders should consider before applying it.
The model is interpretive. Identifying where accumulation ends and manipulation begins involves judgement, and two traders may label the same chart differently. This subjectivity can lead to inconsistent application.
False signals are common. A move beyond a range may resemble a liquidity sweep but turn out to be a genuine breakout, leaving traders positioned against the actual direction. PO3 also performs differently across market conditions: ranging markets tend to produce clearer setups than strongly trending markets, where the accumulation phase may be brief or absent.
Risk Considerations in PO3 Trading
Stop placement is central to applying PO3. Stops are typically placed just beyond the manipulation high or low, since a return to that level may invalidate the setup. Placing stops too tight inside the range may potentially result in being stopped out by minor noise.
Volatility around session opens, particularly the London and New York opens, can produce sharp moves that extend further than expected. Wider stops may be required during these windows, which means position sizing potentially needs adjustment to keep risk per trade consistent. Pairing PO3 setups with structured risk management may potentially support more consistent execution.
The Bottom Line
Understanding and applying the ICT Power of 3 strategy can support a structured approach to analysing market movements. By identifying the phases of accumulation, manipulation, and distribution, traders may gain insights into potential institutional activity and adjust their decisions accordingly.
Traders interested in applying the model on live charts may consider opening a forex trading account with FXOpen.
FAQ
What Is ICT Power of 3 in Trading?
The ICT Power of 3 (PO3) is a trading strategy developed by Michael J. Huddleston, known as the Inner Circle Trader. It involves three key phases: accumulation, manipulation, and distribution. These phases may help traders understand market movements by aligning their strategies with institutional investors.
What Is the Power of 3 ICT Entry?
The Power of 3 ICT entry involves identifying optimal points to enter trades during the phases of accumulation, manipulation, and distribution. Traders typically look for signs of price manipulation, such as false breakouts, and then enter trades in the direction of the anticipated distribution phase.
How Does the Power of 3 Work?
The ICT Power of 3 can be an indicator of potential smart money involvement. It works by breaking down market movements into three phases:
1. Accumulation: According to theory, smart money is expected to build positions.
2. Manipulation: Traders monitor price movements that extend beyond the day’s opening level and the defined range limits.
3. Distribution: Smart money exits positions, leading to significant price movements in the intended direction.
How Do Traders Use the Power of Three?
Traders use the Power of Three (PO3) to analyse potential market direction through three phases: accumulation, manipulation, and distribution. They typically identify a ranging period, monitor liquidity sweeps beyond key highs or lows, and then look for confirmation that price is moving in the intended direction. Traders may combine PO3 with market structure analysis, liquidity levels, and higher timeframe bias when assessing trade setups.
Is PO3 Suitable for All Markets?
PO3 (the AMD trading model) may be applied to forex, indices, stocks, commodities, and cryptocurrencies*. Setups tend to be clearer in markets with defined session opens and concentrated liquidity, such as major forex pairs and equity index CFDs. In 24-hour markets like cryptocurrency*, accumulation and manipulation phases may form differently due to less defined session breaks, so context matters when applying the model across asset classes.
*Important: At FXOpen UK, Cryptocurrency trading via CFDs is only available to our Professional clients. They are not available for trading by Retail clients. To find out more information about how this may affect you, please get in touch with our team.
This article represents the opinion of the Companies operating under the FXOpen brand only. It is not to be construed as an offer, solicitation, or recommendation with respect to products and services provided by the Companies operating under the FXOpen brand, nor is it to be considered financial advice.
Be the first to comment