

MasaoTaira/iStock via Getty Images
As you can see from the list below, Shopping Centers REITs have slightly outperformed the Equity REIT index thus far in 2022, by a margin of (-13.54)% to (-18.35)%.
Hoya Capital Income Builder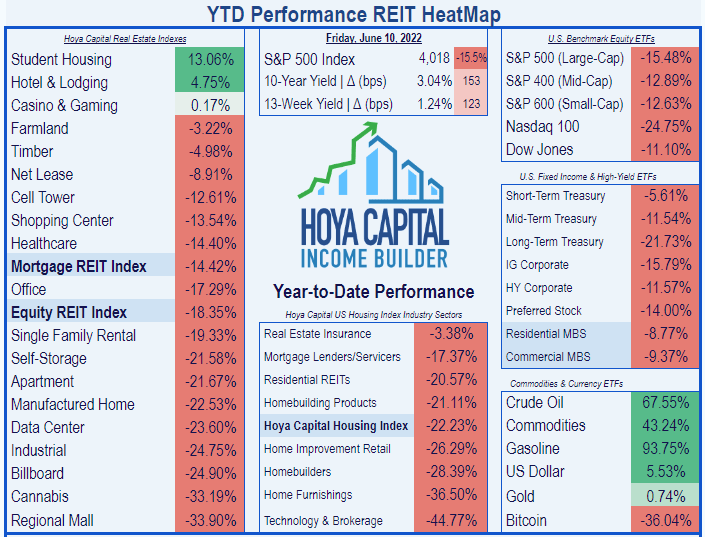
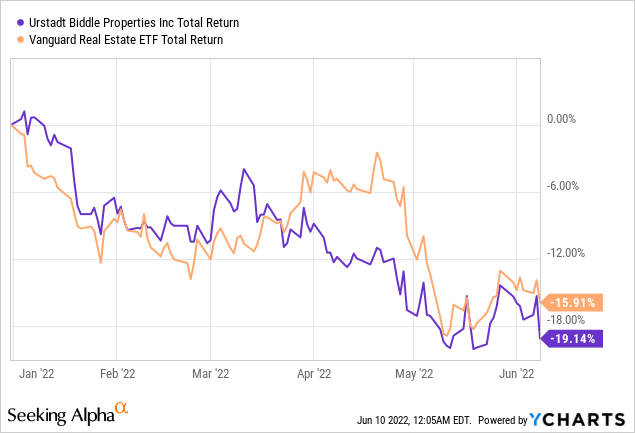
Urstadt Biddle (NYSE:UBA), however, is underperforming the REIT average as measured by the Vanguard Real Estate ETF (VNQ). Total return YTD for UBA has been (-19.14)%, while the VNQ has returned (-15.91)%.
Meet the company
Urstadt Biddle
Founded in 1969 and headquartered in Greenwich, Connecticut, Urstadt Biddle Properties is a small-cap shopping center REIT, with a market cap of $0.66 billion. The company bills itself as “the premier grocery anchored shopping center REIT in the suburban New York metro area.” That is only partially true.
While their 77 properties with 5.3 leasable million square feet are indeed concentrated around New York City, they are not all grocery anchored. Some are anchored by wholesale clubs, some are anchored by pharmacies, and 13% are not anchored by any of the above, according to the company’s own investor presentation. Other real estate assets include office properties, two self-storage facilities, single tenant retail or restaurant properties, and office/retail mixed-use properties.
Management believes grocery-anchored centers are less susceptible to economic downturns than other retail properties whose anchor tenants do not supply basic necessities, and that grocery stores and pharmacies are less vulnerable to e-commerce, because customers want to buy in person.
Company investor presentation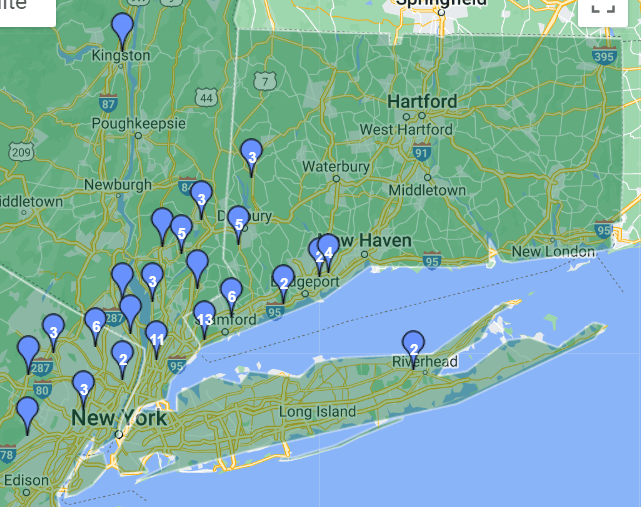
UBA’s strategy is to buy and operate shopping centers in affluent neighborhoods, in dense urban areas with high barriers to entry to new supply. The median income of households within a 3-mile radius of UBA properties is more than 60% higher than the national median. Furthermore, those households make more money than the average people in their respective states. It is safe to say, Urstadt Biddle caters to wealthy people.
Company investor presentation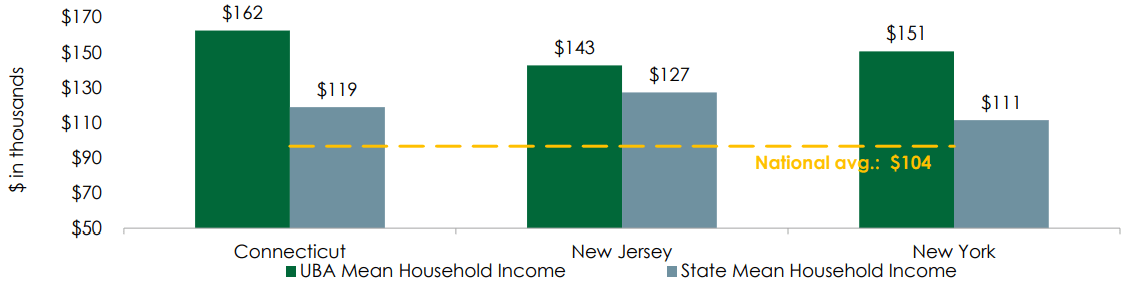
UBA also seeks tenants whose businesses are “internet resistant.” In their own classification scheme, they estimate that three-quarters of their tenants fit this description, while 8% are at potential risk from e-commerce competition, and 16% are at higher risk.
Company investor presentation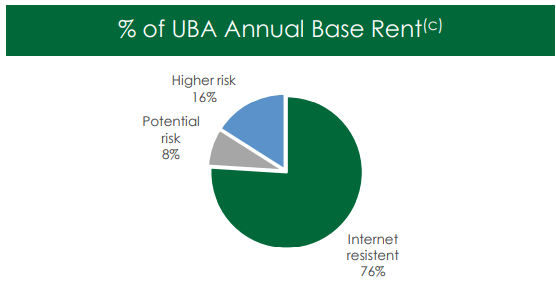
Their tenant roster is not ideally diversified. The top tenant, Stop & Shop, constitutes 8.3% of ABR (annual base rent), and the top 10 total 29.5%.
Company investor presentation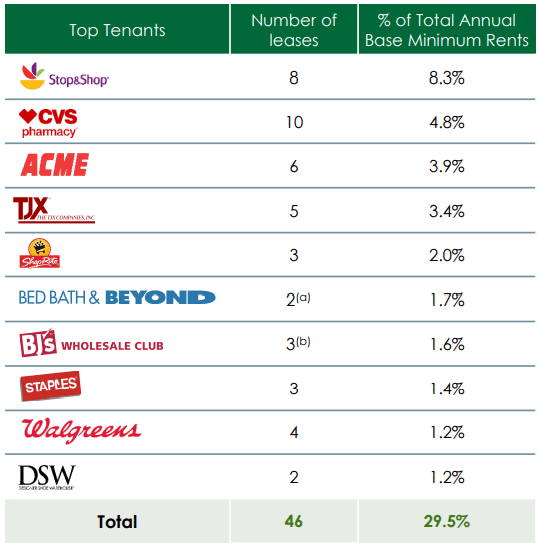
About two-thirds of their leases expire this year or next, so re-leasing space will be a major focus in the short run. Average occupancy in 2021 was 92%, down from their historic average of 94%, but up from 90% in the pandemic year of 2020. The anchor stores account for only 37% of the company’s total ABR.
Company investor presentation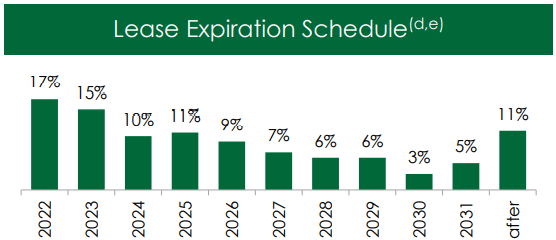
The best news for UBA is that foot traffic in their shopping centers has returned to pre-pandemic levels.
Company investor presentation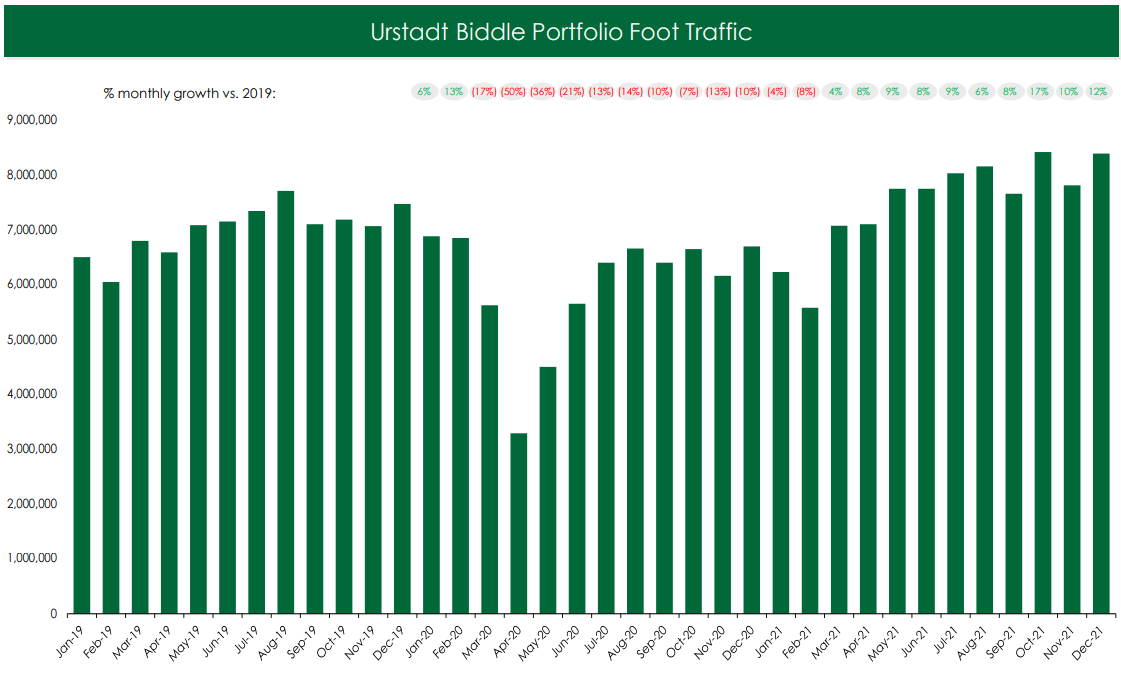
Future non-cancellable rents for the next 5 years peak at $88.5 million in 2023, as shown below:
Company 10-Q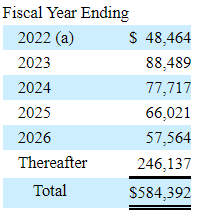
UBA is also party to six unconsolidated joint ventures, which are 94% leased. In addition to owning and managing real estate, UBA is also involved in the retail liquor business, through six taxable REIT subsidiaries.
Quarterly results
Urstadt Biddle reports by fiscal quarter, rather than calendar quarter. Their most recent quarter ended April 30, and it is the Q2 of their fiscal 2022. The company’s 10-Q for this period shows the following:
- $71.6 million in revenues, up 6.5% YoY (year over year)
- NOI (net operating income) of $26.2 million, up 12.2% YoY
- Same-property NOI of $23.8 million, up 4.7% YoY
- Earnings per diluted common share of $0.29, up 38.0% YoY
- Net cash from operations of $34.9 million, up 0.8% YoY
- Total lease income of $34.6 million, up 9.0% YoY
- FFO (Funds from operations) of $14.3 million, up 21.7% YoY
These results were helped along by relatively easy comparables from the quarter ended April 30, 2021, when the effects of the pandemic were still being felt. Management attributes the increase in FFO to increases in base rent for new leases during their Q2, and a $1.2 million decrease in uncollectable rent from the year-ago period.
The company is very proud of the one and only one acquisition they made, the Shelton Square Shopping Center in Shelton, CT. Here are the particulars on that $33.6 million investment (186,000 rentable square feet):
Company 10-Q Company investor presentation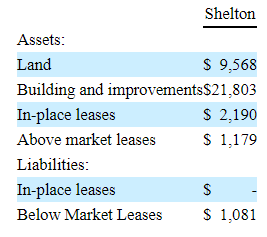

The purchase was funded with available cash and a $20 million loan from their line of credit.
Growth metrics
Here are the 3-year growth figures for FFO (funds from operations), TCFO (total cash from operations), and market cap.
| Metric | 2018 | 2019 | 2020 | 2021 | 3-year CAGR |
| FFO (millions) | $55.2 | $52.0 | $45.2 | $52.3 | — |
| FFO Growth % | — | (-5.8) | (-13.1) | 15.7 | (-1.78) |
| FFO per share | $1.43 | $1.19 | $1.36 | $1.36 | — |
| FFO per share growth % | — | (-16.8) | 14.3 | 0.0 | (-1.66) |
| TCFO (millions) | $71.6 | $72.3 | $61.9 | $73.7 | — |
| TCFO Growth % | — | 1.0 | (-14.4) | 19.1 | 0.97 |
| Market Cap (billions) | $0.72 | $0.92 | $0.54 | $0.83 | — |
| Market Cap Growth % | — | 27.8 | (-41.3) | 53.7 | 4.85 |
Source: TD Ameritrade, CompaniesMarketCap.com, and author calculations
As you can see, FFO, FFO per share, and TCFO have all been essentially flat over the past 3 years. The pandemic dealt UBA a heavy blow, like all other retail REITs, but UBA was already struggling, and has increased FFO in only one of the past 3 years. Market cap at the end of 2021 had shown a 4.85% annual 3-year growth rate, but in 2022, market cap has fallen back under 2018 levels.
Meanwhile, here is how the stock price has done over the past 3 twelve-month periods.
| Metric | 2019 | 2020 | 2021 | 2022 | 3-yr CAGR |
| UBA share price June 9 | $21.76 | $14.58 | $19.74 | $16.68 | — |
| UBA share price Gain % | — | (-33.0) | 35.4 | (-15.5) | (-8.48) |
| VNQ share price June 9 | $89.02 | $85.35 | $104.75 | $94.72 | — |
| VNQ share price Gain % | — | (-4.1) | 22.7 | (-9.6) | 2.09 |
Source: MarketWatch.com and author calculations
Of course, the company’s shares sold off during the pandemic, but they bounced most of the way back last year. However, the (-15.5)% current decline YoY leaves investors with a bigger annual loss in share value over the past three years (-8.48)% than the dividend pays. UBA has been a losing proposition since 2019.
Balance sheet metrics
Here are the key balance sheet metrics, and this is where UBA shines. The high liquidity ratio, low debt ratio, and low debt/EBITDA are truly outstanding. Like most small-cap REITs, UBA’s balance sheet is not bond rated.
| Company | Liquidity Ratio | Debt Ratio | Debt/EBITDA | Bond Rating |
| UBA | 2.89 | 22% | 3.4 | — |
Source: Hoya Capital Income Builder, TD Ameritrade, and author calculations
The company was holding $15.9 million in cash and equivalents as of April 30.
Dividend metrics
Urstadt Biddle likes to trumpet its “210 uninterrupted quarterly dividend payments.” This too is only partially true. While they have paid some sort of dividend all that time, they slashed the dividend by 75% in 2020, and it has yet to return to its pre-pandemic level. Pardon me, but that seems like a pretty significant interruption.
Nevertheless, UBA pays a much higher-than-average current Yield of 5.65%, and Seeking Alpha Premium rates the Dividend very safe (A-).
| Company | Div. Yield | Div. Growth | Div. Score | Payout Ratio | Div. Safety |
| UBA | 5.65% | (-4.8)% | 4.87 | 60% | A- |
Source: Hoya Capital Income Builder, TD Ameritrade, Seeking Alpha Premium
Dividend Score projects the Yield three years from now, on shares bought today, assuming the Dividend Growth rate remains unchanged.
Valuation metrics
From a value investor’s perspective, this aspect of the business looks good. The dividend score is well above average, even in spite of the dividend slash of 2020, the price/FFO is below both the sector average and the overall REIT average, and shares are trading at a whopping (-39.3)% discount to NAV.
| Company | Div. Score | Price/FFO | Premium to NAV |
| UBA | 4.87 | 12.1 | -39.3% |
Source: Hoya Capital Income Builder, TD Ameritrade, and author calculations
What could go wrong?
Some observers say there is another COVID wave coming this Fall and Winter, and if so, all retail REITs would likely be affected.
The very barriers to entry that UBA enjoys also make it more difficult to find and close on acquisition opportunities.
Further increases in interest rates could make acquisitions, renovations, and other capital improvements more costly and less profitable.
Inflation and labor shortages could drive up capex and pressure margins for the company’s tenants.
About one-quarter of UBA’s portfolio is vulnerable to competition from e-commerce, which isn’t going away.
Investor’s bottom line
If all you are looking for is a safe and juicy dividend, with little or no prospect of growth, UBA is a good choice. The combination of above-average Yield, bullet-proof balance sheet, and below-average Price/FFO are hard to beat, from a value investor’s point of view. However, if growth is important to you, there are probably better opportunities out there. This company is already over 50 years old, and still a small-cap. I rate UBA a Hold.
Seeking Alpha Premium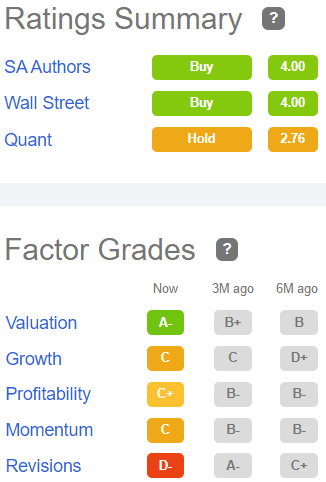
TipRanks rates UBA Outperform, and The Street rates it a Buy. Ford Equity Research rates it a Hold, as does Zack’s. Three Wall Street analysts cover this company. The average price target is $20.67, implying 25.8% upside.
Be the first to comment