

wildpixel/iStock via Getty Images
If you love inflation… The Bureau of Labor Statistics delivered the latest reading on inflation with the Consumer Price Index (CPI) for May on Friday. Make no mistake about it, this was a definitively bad report on inflation as has been widely discussed in the financial media in the days since. Capital markets recoiled at the news as well, as evidenced by the precipitous drop of -2.9% on the S&P 500 and -3.6% on the tech heavy NASDAQ. Despite this definitively negative report, consumers still have reasons for cautious optimism about inflation in the months ahead. Investors may also find reasons for encouragement, but patience and selectively remain warranted.
Be careful what you wish for. Remember the twelve year period after the Great Financial Crisis (GFC) from 2009 to 2020 when the U.S. Federal Reserve wanted to generate sustained inflationary pressures soooo badly but just couldn’t seem to solve the “mystery” of why it wasn’t happening? Well mystery solved! Inflationary pressures started heating up in early 2021 thanks to a punchy economic cocktail of excessively over-stimulative monetary and fiscal policy in response to the onset of a global pandemic coupled with the joining of both demand pull (“too much money chasing too few goods”) and cost push (“supply chain disruptions and rising raw material prices”) inflationary pressures.
As a result, we’ve gone from an environment for so long where economic growth remained sluggish as sustained inflationary pressures remained elusive to an environment where economic growth surged but is now fading while inflationary pressures are boiling over.
Now one of the two main policy levers to combat a high inflation problem is for fiscal policy makers to raise taxes. Yeah, I was snickering too when I typed it, because I believe everyone knows that taxes aren’t likely going to get raised anytime soon by either party with the exception of the Democrats on the wealthy that have a relatively low marginal propensity to consume anyway (in other words, raising taxes on the wealthy may not bring inflation down). As a result, just as the Fed was left to do virtually all of the heavy lifting to generate economic growth and inflation in the wake of the GFC, so too are they tasked with getting inflation back under control now that the horse is out of the barn and galloping down the street.
We can criticize them all we want (and I have criticized them plenty along the way), but their job has not been an easy one, particularly with how politicized the Fed has become in recent years (such is the unintended consequence of the good intent of increasing communications with financial markets). Patience with the Fed will be warranted in the months ahead as they work to bring this fire under control. And some signs of early progress may already be emerging.
Headline CPI challenges. A surface level look at the headline CPI from Friday quickly reveals why the markets had such a negative response.
Bureau of Labor Statistics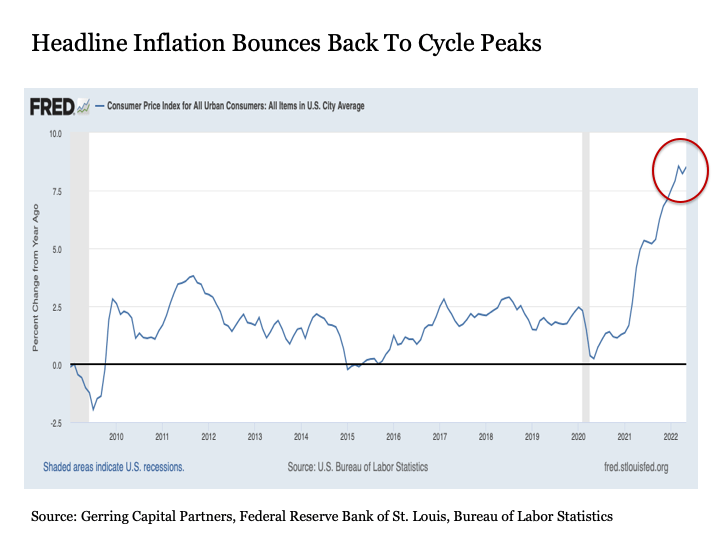
The headline annual inflation rate was already at its highest reading since December 1981 heading into the latest report for May on Friday, and while many market participants were hoping that the inflation rate would post its second straight monthly decline after peaking in March at 8.5% and falling in April to 8.3%, it ended up popping higher in May to a new 8.6% cycle high. Ouch! Although the optimist might point out the fact that at least high headline inflation has effectively leveled out over the last three months in the mid-8% range, both stocks and bonds were battered accordingly as would be expected (after all, mid-8% annual inflation is still scorchingly high).
Not rotten to the core. Despite this ugly headline number (which matters in a world today where so many look no further than the headlines to draw definitive conclusions), an initial look underneath the surface provides a marginally more constructive story.
It is certain no mystery for any of us that drive a car or shop at a supermarket that food and energy prices continue to soar. And soar they did once again in May. Food prices increased by 10.1% year-over-year in May, and energy prices spiked an even more staggering 34.6%. This included a triple-digit 106.7% annual increase in fuel oil prices (I never thought I would be thankful for only a 28.0% year-over-year increase to fill my propane tank!).
But if we take a look at the Core CPI reading that excludes volatile food and energy prices, we see a marginally more encouraging picture.
Bureau of Labor Statistics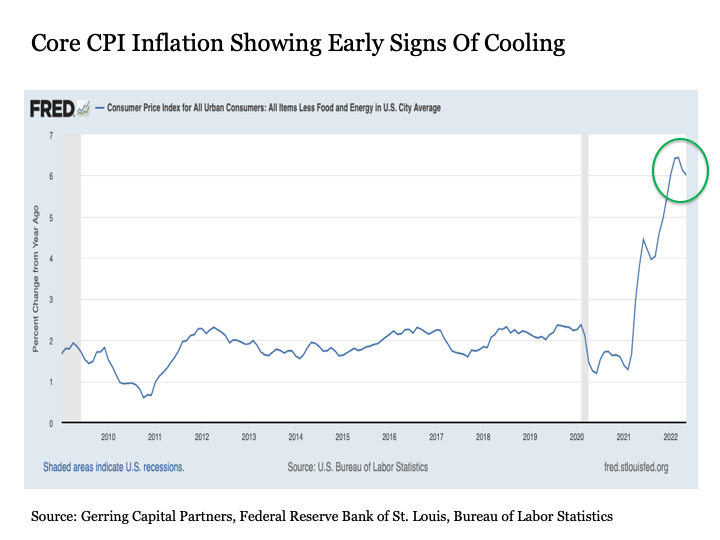
After starting to level at 6.4% in February and peaking at 6.5% in March, the annual increase in Core CPI first fell to 6.2% in April and eased further to 6.0% in May. Now it is important to note that a core inflation rate of 6.0% is still piping hot – we’re still at the highest levels for this reading since 1982. And it should also be emphasized that two consecutive months of marginally lower annual core inflation does not at all mean we have entered into a sustained trend of lower reading in the months ahead. After all, we last saw two consecutive lower readings of annual core inflation back in July and August 2021, and here we are two percentage points higher on the annual core rate nearly a year later.
Nonetheless, the fact that the annual core inflation rate dropped for a second straight month is a point of encouragement that is worth monitoring in the months ahead. For if the next CPI reading for June scheduled for July 13 delivers another month of lower annual core inflation into the 5.0% to 5.9%, this would provide added encouragement that pricing pressures may be firmly in the early stages of sustainably cooling down.
Of course, just as I like to gather my news from a variety of differentiated sources, I also like to view my economic and market related data through a variety of different lenses before drawing any particular conclusions. As a result and knowing that the Consumer Price Index from the BLS is just one of several ways to assess the current inflationary situation, it is worthwhile to consider what other key readings may be telling us.
The Fed’s preferred inflation gauge. The Personal Consumption Expenditures Price Index (PCEPI) is another inflation reading that is worth tracking. This data is provided by the Bureau of Economic Analysis (BEA) and comes out toward the end of the month unlike the CPI that is released toward the middle of the month. Unlike the CPI, it also includes “spending on behalf of a consumer” that incorporates outlays from governments and businesses.
Bureau of Economic Analysis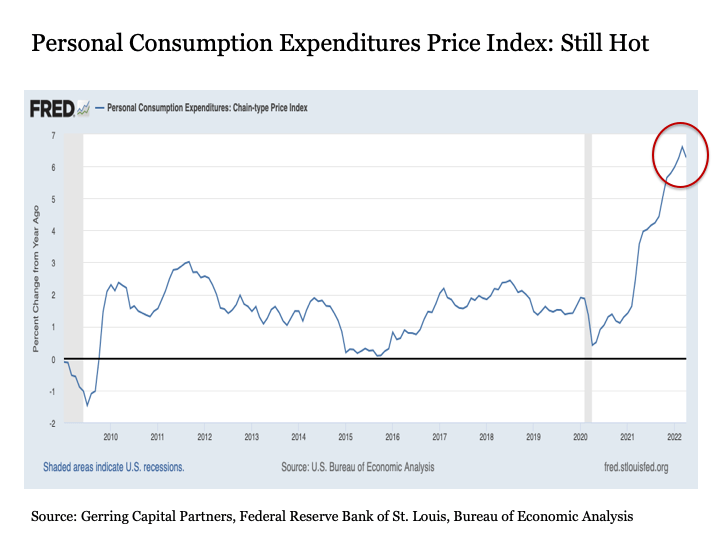
The latest reading for PCEPI reading for April released on May 27 showed similar results to the headline CPI. After peaking at a relatively more modest but still notably hot 6.6% year-over-year in March, the annual PCEPI inflation rate eased to 6.3% in April. The next PCEPI reading for May will be released on June 30, and it would be reasonable to expect that this rate may also push back higher in May just as the headline CPI inflation rate revealed on Friday. But a more modest increase if not a flat to further declining annual inflation reading could provide some renewed hope that pricing pressures may be on the wane.
Bureau of Economic Analysis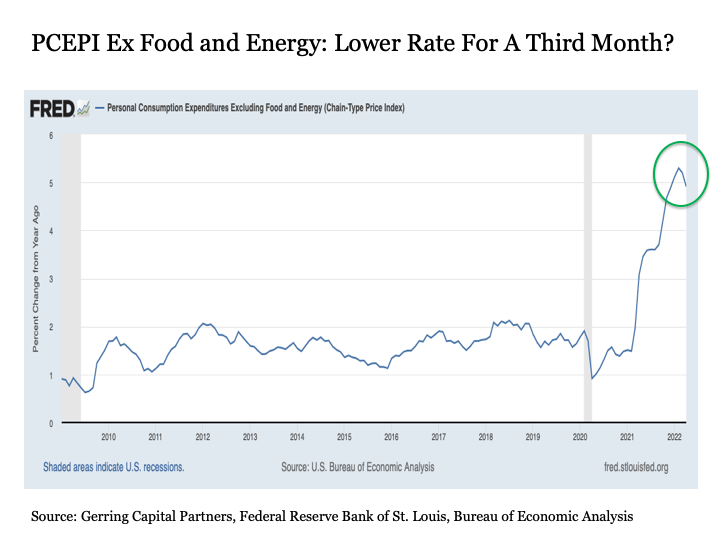
Where the Personal Consumption Expenditures Price Index becomes more interesting relative to the CPI is when considering readings less food and energy. In contrast to the annual Core CPI inflation rate that peaked in March before subsequently easing in April and May, the annual PCEPI Excluding Food and Energy inflation rate actually peaked a month earlier in February at 5.3% before falling back to 5.2% in March and 4.9% in April. Given that the annual Core CPI inflation rate just fell back by 0.2 percentage points in May, it is more than reasonable to anticipate that we could see a third monthly decline in the annual PCEPI Excluding Food and Energy inflation rate in May when it is reported at the end of the month. This would be an encouraging development, particularly given that the PCEPI is the preferred inflation gauge monitored by the U.S. Federal Reserve.
What about producer prices? Turning back to the Bureau of Labor Statistics, another worthwhile inflation reading is the Producer Price Index (PPI), which measures the average changes in prices that domestic producers receive for their goods and services. The idea here is that if producers have to pay higher input costs, they are more likely to eventually pass along these higher costs to consumers in the months ahead.
Bureau of Labor Statistics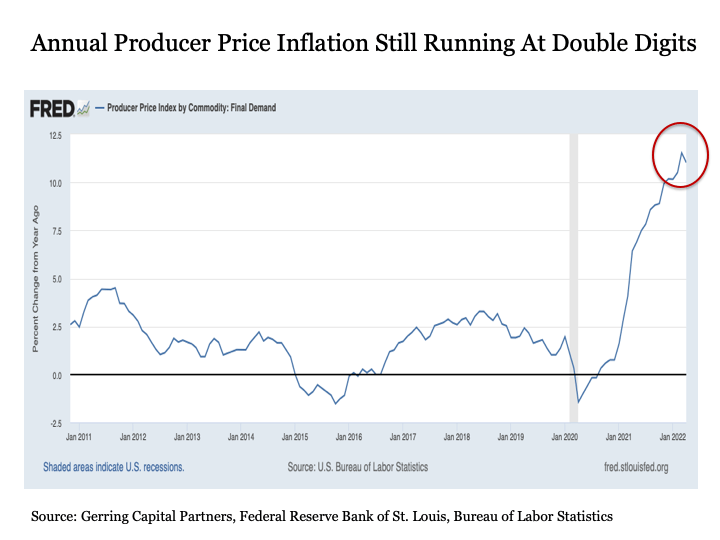
Much like the CPI and the PCEPI, the headline annual PPI inflation rate peaked at 11.5% in March before easing back to 11.0% in April.
Bureau of Labor Statistics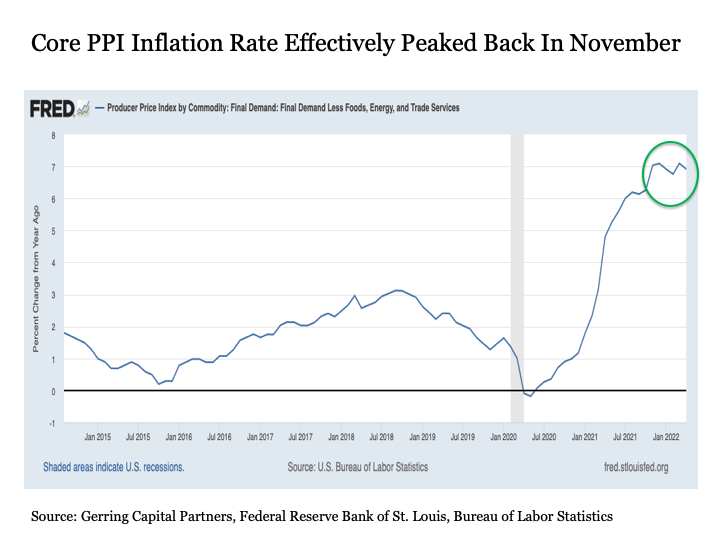
But building on the constructive signs at the core level for consumers, we see even more encouraging trends when examining the PPI excluding the more volatile food, energy, and trade services. Whereas the annual Core CPI inflation rate peaked in March and the annual Core PCEPI inflation rate peaked in February, the annual Core PPI inflation rate effectively peaked all the way back in November 2021 at 7.0%. While it has rattled around between 6.7% and 7.1% in the months since, the fact that this Core PPI rate has been moving sideways for six months is encouraging, particularly since it serves as a leading indicator for what may come for core consumer prices.
The latest PPI reading for May is set to be released this Tuesday, so very soon we will have another key data point to help us assess the current and expected inflation situation.
Price is truth. When examining inflation, I also like to look beyond the economic data releases to what the actual marketplace itself is telling us.
Before going any further, it is worth noting as mentioned above that the steadily climbing price of crude oil is clearly doing its part in driving headline inflation.
StockCharts.com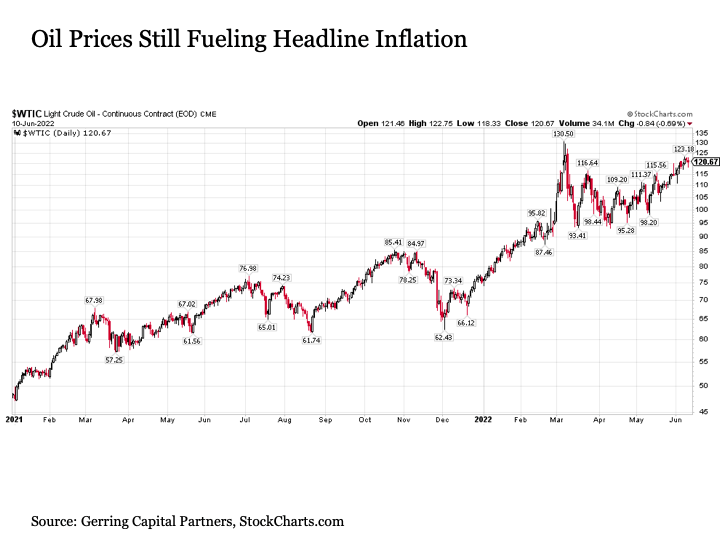
But what about the various other raw material inputs used by producers to manufacture products for consumers? Here we find more preliminarily encouraging signs on the inflation front.
Consider copper prices, which were once skyrocketing through early 2021 but have since been moving in a sideways pattern for more than a year. Copper prices managed a marginal peak in early March, but have since fallen back by as much as -20% and are currently trading at levels that are lower than they were in February 2021.
StockCharts.com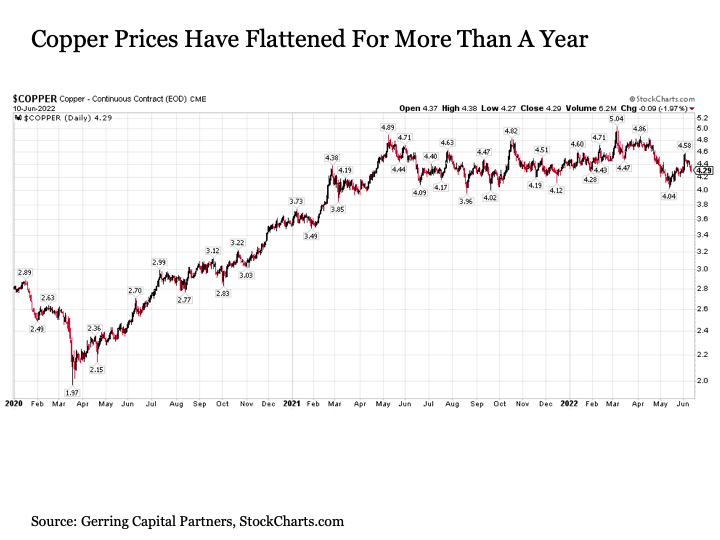
Lumber prices have also fallen off markedly since the start of 2022. Lumber had soared through May 2021 before plunging sharply through the summer last year. But after regaining its footing, it climbed back over $1300 by January 2022. Since that time, lumber prices have steadily fallen by -60%.
StockCharts.com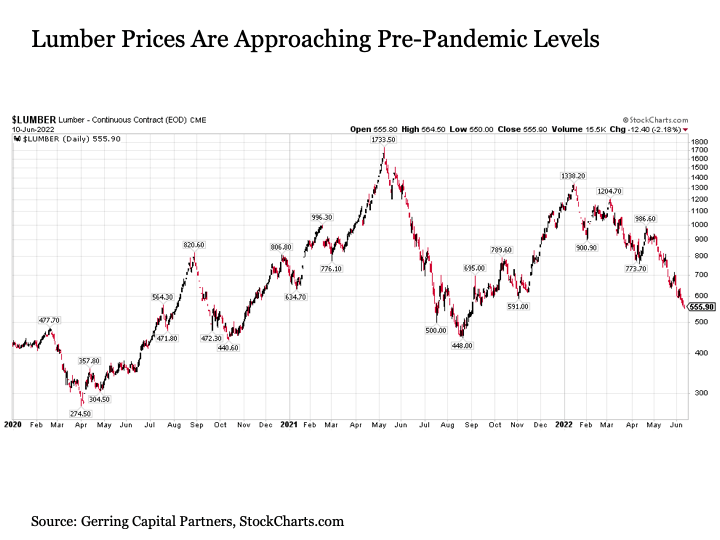
A variety of other key input prices have showing similar behavior in recent months. Steel prices are down more than -20% from their peaks from October 2021. Aluminum prices have also dropped by more than -23% since early March and are quickly descending to pricing levels from 2018. And nickel continues to come back to earth following its epic short squeeze back in early March, having dropped by -40% from this recent peak.
These are just a few of the various raw materials whose prices have fallen measurably from previous peaks in recent months. This is a positive development for the inflation outlook in the months ahead.
One more key reading providing encouragement on pricing. Beyond the economic data and raw materials prices, an inflation reading that I place particular focus on is the 5-Year Breakeven Inflation Rate. Unlike the economic data that is released monthly from the BLS and the BEA, the 5-Year Breakeven is a reading on expected inflation that is derived daily from capital markets. This expected inflation is derived by taking the difference between the 5-Year U.S. Treasury rate and the 5-Year U.S. Treasury Inflation-Indexed Security rate.
Why is this measure useful? They call the bond market the “smart money” for a reason. The U.S. Treasury market is highly liquid and pricing is driven in large part by experienced institutional investors, financial professionals, central banks, and other well-informed participants. These are not speculators, nor are they in the business of collectively being wrong on their inflation forecasts by percentage points.
Federal Reserve Bank of St. Louis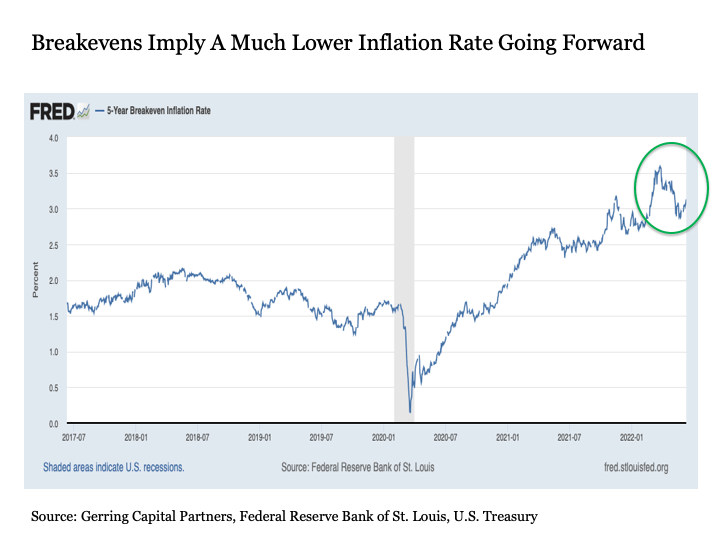
While the current headline CPI inflation rate just spiked to new cycle highs at 8.6%, the 5-Year Breakeven Inflation Rate driven in large part by these “smart money” investors is still hovering at a much more reasonable 3.13%. Moreover, this reading is lower by nearly 50 basis points from the 3.59% peak reached in late March. In other words, these “smart money” investors are more optimistic today, even after Friday’s scorching CPI report, than they were nearly three months ago.
This is a particularly encouraging development on the inflation front to be certain.
Investment implications. Despite Friday’s surprisingly hot inflation report, we still have a number of reasons for optimism that pricing pressures may increasingly abate in the months ahead. This is potentially good news for a beleaguered stock market that has effectively been in a tailspin as measured by the S&P 500 and the NASDAQ since the start of the year if not the end of last year.
But it is critically important to keep any such encouraging developments on the inflation front in context. Even if we begin to see some relief with inflation rates cooling in the months ahead, both headline and core inflation rates are still running very hot. As a result, if inflation continues to cool, it will not likely be enough to even begin to get central bankers including the U.S. Federal Reserve to think about backing off on raising interest rates and shrinking their bloated balance sheets.
More directly, we are no longer in a market environment where the Fed will be lowering interest rates and/or expanding their balance sheet through quantitative easing (QE) at the first sign of significant stock market weakness. Instead, we are now operating in the exact opposite market environment where the Fed will be continuing to raise interest rates and shrink their balance sheet through quantitative tightening (QT) even if the stock market is dropping significantly to the downside. After thirteen years of pumping the stock market higher, the Fed now has a much more important inflation battle to fight.
Stock investors still have a variety of attractive investment opportunities to pursue despite this new monetary policy reality. For just because the S&P 500 and the bloated technology, communication services, and consumer discretionary sectors within the headline index are not still rising into the stratosphere does not mean that everything is falling in unison.
For example, one of the reasons that I am overweight both food and energy in my stock allocation is the recognition that these sectors are seeing significant price increases for their products that are not only driving headline inflation higher but are also supporting growth for these firms. The fact that many of these companies were already trading at deeply discounted valuations heading into the inflation outbreak has provided added support to the upside opportunities in these areas of the market.
The same could also be said for the major pharmaceutical companies, which are benefiting not only from strong pricing power and still discounted valuations, but also the fact that we are continuing in a major global health care crisis that much like during times of war has resulted in leaps of health care innovation that is likely to drive growth in the sector for years to come.
Speaking of war, the dramatic shift in the geopolitical landscape brought by Russia’s invasion of Ukraine is likely only the very beginning of a global shift that will require a meaningful increase in the amount of military spending needed going forward. This should be supportive of defense stocks for the foreseeable future.
These are only a few of the many more specific upside investment opportunities that continue to exist in a broader market today that continues to anxiously await some relief on the inflation front. While it may very well be coming in the months ahead, investors will likely be best served to focus on selected market themes instead of the Pavlovian buy the dip strategy that worked so well for so long until now.
Be the first to comment