

Lisa-Blue/E+ via Getty Images
Note: This report was originally published on Value Investor’s Edge on May 20, 2022.
Overview
In our 2022 Product Tanker Outlook, we noted the very difficult year clean tankers endured in 2021 as a demand recovery for refined products failed to appear.
But 2022 was set to be a turnaround year with significant market tightening projected. It was forecast that “product tanker cargo mile demand is expected to grow by approximately 6-7% over the course of 2022. This comes against an expected 2% net fleet growth… with the divergence between supply and demand expected to be a bullish 4%-5%.”
The last line in that 2022 outlook summed up the conviction for that strong reversal: “This makes product tankers, my Dark Horse, or ‘come from behind’ pick in 2022.”
Fast forward to May of 2022 and product tanker rates have been strengthening, demand for airline travel appears to be returning, arbitrage trades are thriving, and the Russia/Ukraine war has caused a great deal of fleet dislocation which has led to spot premiums for fortuitously positioned vessels.
In fact, the MR class is now firmly in the running to achieve the greatest YoY increase in earnings of all the various segments and vessel classes that we cover and is on pace for new decade highs.
Source: Clarksons SIN
But things aren’t as simple as they were just five months ago, as a myriad of new geopolitical and economic factors must be considered as we move through 2022. So, how have they impacted the market? Is this move in rates structurally based or should we attribute it to short term shocks? How have owners reacted to this bull run so far? Will the market continue to tighten?
Demand
With many issues to address in this section, let’s start with the most pressing current topic; how the Russian/Ukraine war has impacted the product tanker market.
Some might recall that in Q1 Shipping Charts And Commentary I touched on the short-term shock crude tankers experienced as a result of the Russia/Ukraine war. A quick review of this situation will provide us with the basis to understand why product and crude tankers are not the same when it comes to the impact from this conflict.
The following is an excerpt from that report:
“Cargo mile demand is down in both the Suezmax and Aframax classes, but average rates are skyrocketing.
Source: VesselsValue
The reason is due to reluctance by some owners to commit to Russian cargoes or ports, which has led to major spikes in regional freight rates.
While the market at large has benefitted to some degree, the extremely high rates are only being found on these select routes, as noted below showing global Aframax rates for specific routes.
Source: VesselsValue
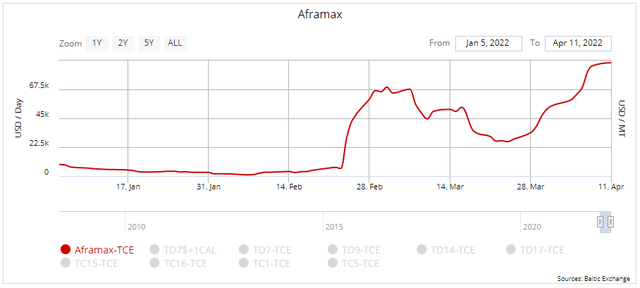
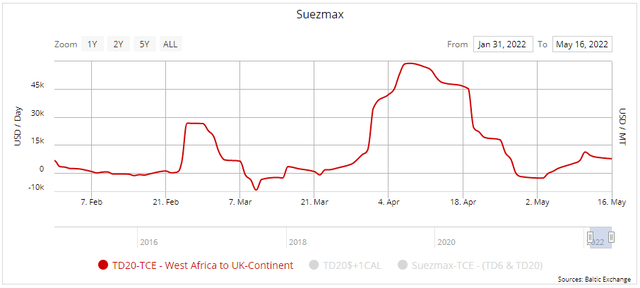
Notice the TD17 is providing the impetus for much of this rate move, which is the Baltic to UK-Cont (Primorsk to Wilhelmshaven) route, shown below.
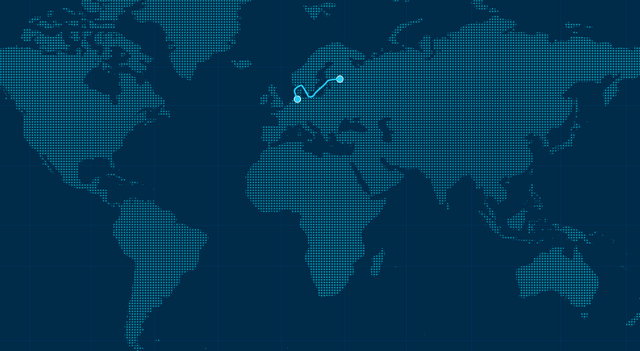
Source: Baltic Exchange
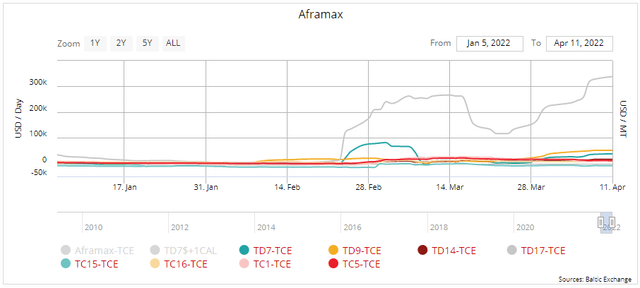
But this short haul is just one of many routes that compose the overall market.
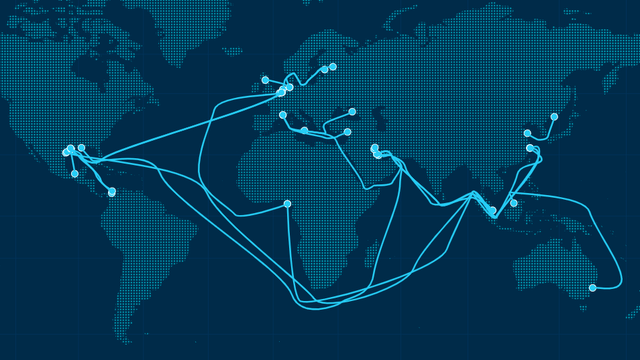
Source: Baltic Exchange
Vessel positioning and a willingness to call on certain ports will allow owners to best capture this window of opportunity while others may be left out to a large degree.
Therefore, this move is not structurally based but rather the consequence of geopolitical affairs, which implies a shelf-life, the duration of which is directly correlated to this situation in the short-run with that effect waning as we move further from the initial shock.”
The above statement was published on April 12, 2022, which also marked the high point for Aframax rates during this short shock cycle.
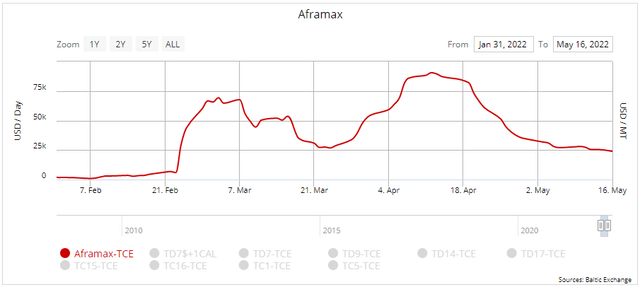
Source: VesselsValue
This also coincided with short-term tops in both the Suezmax and VLCC classes.
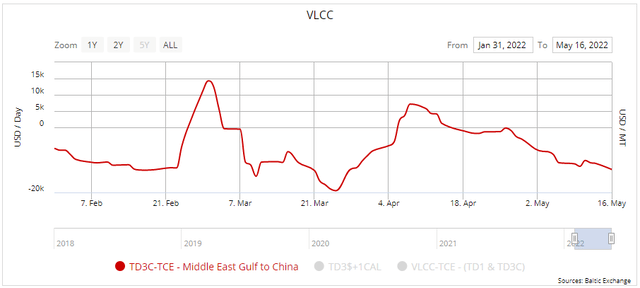
Source: VesselsValue
What makes the product tanker market different? For starters, the recent rally in product rates has been witnessed more broadly throughout the market and has possessed far greater staying power.
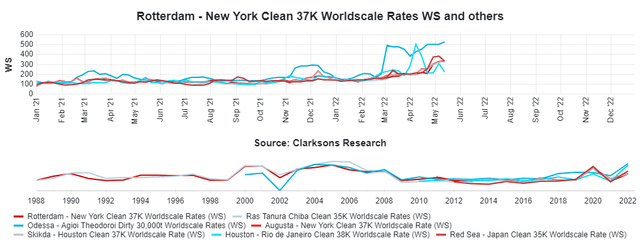
Source: Clarksons SIN
Notice that the gains witnessed in the product segment (above) are spread throughout numerous benchmark routes, whereas the rally in Aframax rates (pictured below) was confined to very specific routes with very minimal movement and no staying power for benchmarks not involved in this short-term shock.
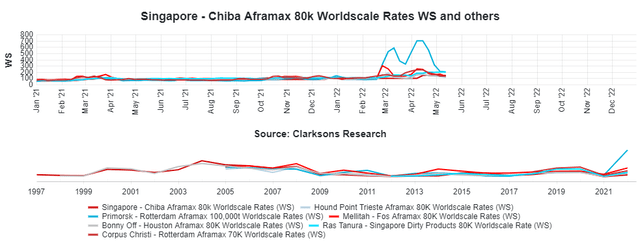
Source: Clarksons SIN
The reason why product tankers are keeping their gains is very simple; it is structurally based – as they were far closer to a state of market equilibrium compared to their crude tanker counterparts.
In our 2022 market outlooks, it was noted that a supply glut and lackluster cargo mile demand growth since 2018 has plagued the crude tanker segment leaving it in a heightened state of disequilibrium, with no quick fix likely in the cards. But the product tanker market was far better off from a supply/demand structural standpoint, almost nearing market equilibrium, with very minimal market tightening projected to result in gains.
The question then becomes, have we been witnessing this structural tightening?
In our 2022 outlook, we forecast a divergence between supply and demand to be a bullish 4%-5%. As of May 16, 2022, the MR2 fleet is posting a YTD gain of 5.61% in cargo mile demand, according to data from VesselsValue. A total of 10 MR2 vessels have been scrapped already in 2022 while a total of 21 have been delivered, leading to a net gain of just 11 vessels or 0.64%. This leads to an approximate 4.97% bullish divergence between supply/demand growth – favoring a tighter market and higher rates.
This appears to support the idea that the slowly manifesting market strength across the board is a result of this gradual tightening as opposed to short-term shocks rippling through the market.
Even though the most recent data available continues to support cargo mile demand growth estimates of approximately 5.5%-6%, it’s always wise to determine just how we achieved those figures and if they are indeed sustainable.
Again, we must turn to the impact of the Russia/Ukraine war to discern the influence it has had on rerouting and arbitrage markets.
First, let’s start with the fact that crude oil and product markets have been impacted differently.
According to IEA data, Russian oil exports rebounded in April, rising by 620,000 barrels a day to 8.1 million barrels a day, close to its prewar levels. While oil shipments to the EU, US, and UK fell by around 1.2 million b/d, cargoes bound for India and Turkey jumped by 730,000 b/d and 180,000 b/d, respectively.
However, Russia’s exports of refined products have fallen sharply and are down nearly 900,000 b/d from an exceptionally high level in February. Its April products exports are also down about 500,000 b/d from the average for the previous five months.
With Russia’s remaining trading partners, like China and India being major refined product exporters themselves, including diesel of which Europe had been a major purchaser, the Russians are struggling to find buyers for their products.
Meanwhile, short haul Russian volumes that were originating from the Black Sea and heading to Europe have found themselves being replaced by longer hauls out of the US Gulf. Additionally, tighter supply in Europe caused prices for refined products (especially diesel) to rise, which inspired an arbitrage trade.
How bullish was this for the market?
According to VesselsValue data for LR2, LR1 and MR2 vessels, total volumes sent to NW Europe from the USA between April 1, through May 17 increased by 89.5% compared that same period a year ago.
Looking at that same YoY timeframe, when broken down into cargo miles, this shift resulted in a nearly 0.86% increase in total cargo miles traveled for the entire fleet. A nice feather in the cap but certainly not responsible for the vast majority of gains we’ve seen, suggesting much of that demand is rooted in organic global economic activity and, some would argue, ongoing refinery dislocation.
It’s difficult to determine long term conviction for Europe’s desire to follow through on diversifying away from Russia, but for the short to medium term, it seems highly likely that this state of affairs will continue given the stated goal of phasing out Russian crude imports within six months and oil products by the end of the year.
Let’s return to the topic of refinery dislocation, which refers to the growing distance refined products must travel between their production facilities to consumer markets. These longer distances being traveled typically favor seaborne transportation and thereby create outsized demand for product tankers relative to corresponding economic growth.
According to Ardmore’s latest earnings presentation, the ongoing trend of refinery dislocation is expected to continue with export-oriented refinery capacity growth of 8.5 million b/d from 2022 to 2026 in Asia and the Middle East while refinery closures of 5.9 million b/d in the mature markets of the US, Europe, Japan and Australia are anticipated.
The chart below shows the concentration of these capacity additions relative to projected closures.
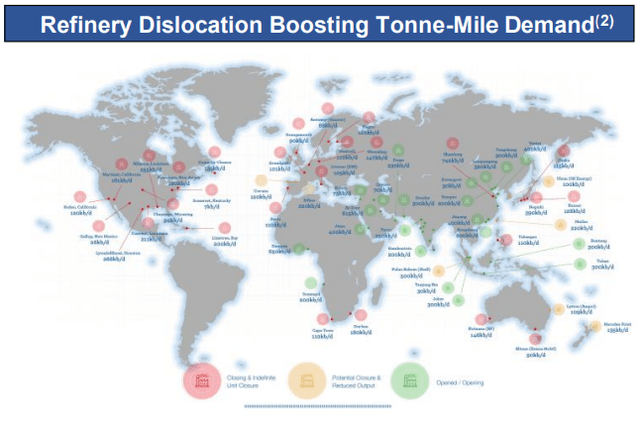
Source: Ardmore
These widespread closures in developed nations do not reflect decreasing demand, instead these volumes will need to be made up through imports.
Taken at face value, the volumes displaced and directly replaced by these new additions would result in a steady 2%-3% annual cargo mile demand growth through 2026.
But product markets aren’t that straightforward, as thousands of vessels serving numerous routes allow buyers and sellers of refined products to capitalize on the best deals which often involve minor savings on transport costs (shorter distances).
Therefore, market efficiencies will likely reduce those associated cargo mile demand gains somewhat, putting a more realistic estimate at about 1%-1.5% annual growth. Even with these more subdued expectations, this remains a meaningful tailwind.
Before we conclude the demand section, it’s worth noting that these strong cargo mile demand gains for 2022 materialized even after February recorded a 9.6% drop in total product tanker loadings, for 25k dwt and above, compared to January. Obviously, the result of the Russia/Ukraine war and lockdowns in China.
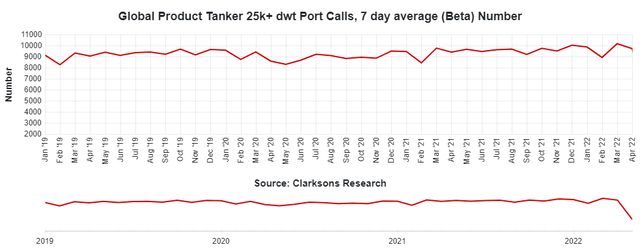
Source: Clarksons SIN
March and April have witnessed loadings return to expected levels with May showing a stronger initial two-weeks when compared to those months. This would indicate that estimates for expected organic demand growth continue to be on track.
Taken all together, an expected 3.5%-4.5% ongoing organic cargo mile demand growth, combined with approximately 1%-1.5% gains from dislocation, and an approximate 1% in arbitrage and rerouting should continue to work together to help achieve around 6%-7% total cargo mile demand gains by the end of the year.
Supply
Overall conditions for most segments are often dictated by markets surrounding the largest vessels (VLCCs for crude, Capesize for Dry Bulk, LNGC’s for LNG, etc.), however, the product tanker market is decidedly different.
Here, we see the MR2 fleet (40,000-54,999 dwt), which numbers just over 1,700 vessels in total, set the tone. This also explains why these vessels are the main area of focus when discussing the product tanker market.
With this fact comes a notable concern. Due to their small size, relatively small price tag, and quick build times, the MR2 fleet, and consequently the product tanker segment as a whole, can see supply side conditions change considerable in a short time.
In fact, a rash of newbuild orders can quickly disrupt the market some 14-18 months down the road. But before we get to newbuild orders, let’s quickly review the orderbook.
The MR2 orderbook continues to shrink, now down to an anemic 6.6% as of May 18.
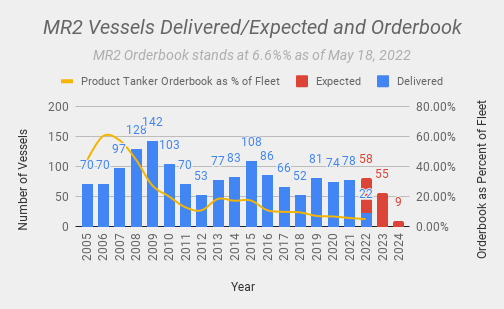
Source: Data Courtesy of VesselsValue – Chart by VIE
In terms of fleet capacity, the product tanker orderbook as a whole continues to plummet to levels not seen in over 25 years, breaking below the 5% mark this month and now down to a paltry 4.93%.
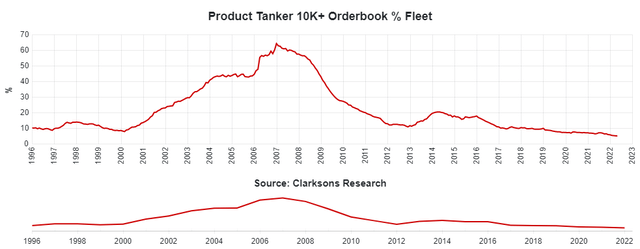
Source: Clarksons SIN
This shrinking orderbook comes amid very strong rates, which is highly unusual as noted in the next chart comparing the two.
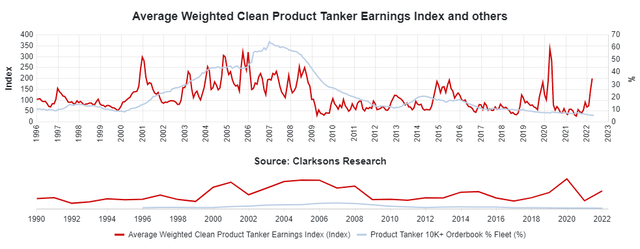
Source: Clarksons SIN
Notice that rising (or falling) rates in many instances were the catalyst for an increasing (or decreasing) orderbook which soon followed.
But this time is different as rates, which we believe are rooted in structural market dynamics, have been showing strength all while owners have shunned the newbuild market.
In fact, we are currently looking at the longest lull in newbuild orders since the onset of the Great Recession, now in its fourth quarter of lackluster activity.
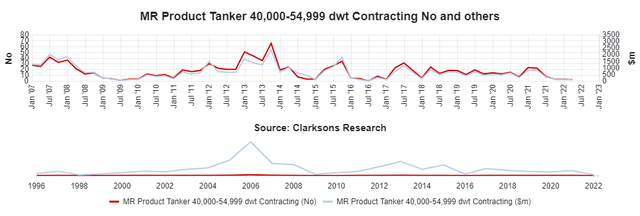
Source: Clarksons SIN
Only 9 orders total have been placed across all product tanker classes since the start of 2022. This defies expectations for owners to modernize fleets, let alone use those recent profits to expand their operations.
But maybe they are concentrated on S&P activity, as they rightfully should be according to past bear to bull cycles, where owners seek out on the water tonnage to capitalize on these limited windows of opportunities.
So, are owners utilizing the S&P markets to acquire secondhand vessels?
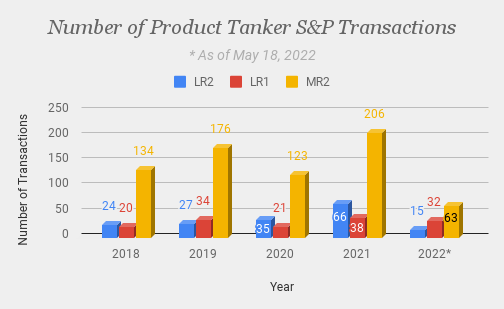
Source: Data Courtesy of VesselsValue – Chart by VIE
Current activity for LR vessels is trending above average, however the MR2 class is looking at a fairly average year. Again, we use the MR2 as an indicator, not just because of the sheer vessels numbers and it being a reflection of the market, but also because that class typically sees the highest sales in terms of dollar value.
Listening to the latest round of earnings calls from companies engaged in the product tanker trade, owners appeared trepidatious regarding fleet expansion, referring to the upcoming EEXI/CII and the lack of overall market clarity regarding the best way to achieve operational efficiency in the face of these looming mandates.
This apprehensiveness could solidify a very thin delivery schedule for 2023, which is also when we will see the greatest market shock from these upcoming mandates with the implementation of the EEXI.
It’s noteworthy that all LR orders placed this year have been scheduled for 2024 and 2025 delivery, while the last two MR2 orders which were placed in April are scheduled for delivery in December of 2023. This suggests the window for 2023 is closing with larger vessels perhaps having to wait even longer due to shipyard constraints for bigger slots.
This means we are likely looking at much tighter supply issues in 2023 and extending into 2024, which should play into higher rates and also asset prices.
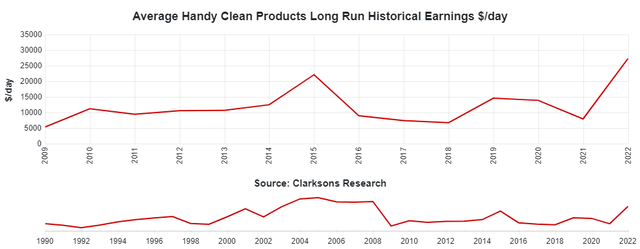
According to recent history, those asset prices could have some room to increase.
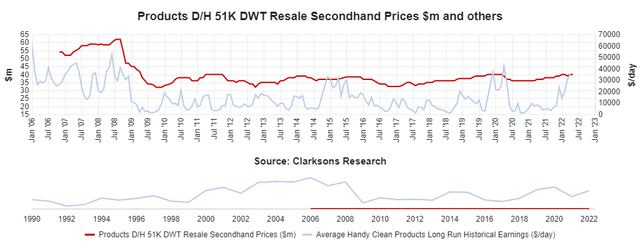
Source: Clarksons SIN
It’s noteworthy that in 2007, earnings per day averaged $31,942 and asset values averaged $59 million. Fast forward to 2022 where earnings per day are averaging $27,275 while asset values are hovering around $30 million (according to the most recent 50k dwt 5-year old sale). This would suggest that if these earnings are sustained and even increase, asset values might have some catching up to do – but a sustained (key word) increase will be required, as the market has shrugged off shocks in the past.
Conclusion
Demand for product tankers has recovered to pre-pandemic levels and is growing at a decent pace. This will be complimented by a variety of factors that should act as tailwinds in 2022 and 2023.
Of course, one looming adverse development that could impact this forecast would be a global recession that eats into the historically relatively inelastic demand of refined products. Another would be high prices themselves resulting in significant demand destruction.
While Covid did have a very profound impact on refined product demand due to the travel restrictions and imposed industrial/manufacturing curbs, in previous recessions the product tanker market has escaped relatively unscathed. During the Great Recession, it was the only segment to continue posting cargo mile demand gains year over year.
So, while a watchful eye should be focused on a global recession, the notion of losing a couple percent in demand growth isn’t so scary when it’s placed against a delivery schedule that would be entirely manageable even under those conditions.
The ongoing Russia/Ukraine war has changed product tanker flows slightly, with the outcome adding to cargo mile demand. This situation looks to have staying power of the medium term with political resolve dictating the longer-term outlook.
Arbitrage trades are alive and well. Low stockpiles and high prices are a perfect combination which should continue to open windows of opportunities for traders, adding another layer of demand for product tankers.
Refinery dislocation should continue to play a role ahead. Due to the quick moving markets populated by numerous vessels and routes, which are driven by efficiency, I personally think the impact here could be a little less profound than others, but still meaningful.
Overall, the product tanker market is witnessing solid demand while the supply side is currently experiencing extremely low net fleet growth, leading to a solid divergence between supply and demand which is favoring higher rates.
This low net fleet growth should persist, and even become more profound as we move through 2023 where the EEXI will likely force some vintage vessels on to the beaches. Remember, nearly 7% of the MR2 fleet is over 20 years-old which presents enough demo candidates to meaningfully move this market, especially when compared to the sub-5% orderbook.
Aside from a recession and price inspired demand destruction, the other main thing to watch would be a quick ordering spree among owners once clarity is gained regarding the EEXI. If they react quickly and collectively, we could be facing another round of deliveries starting in late 2024 for MR2s and early 2025 for LRs.
Be the first to comment