

wichayada suwanachun/iStock via Getty Images
This dividend ETF article series aims at evaluating products regarding the relative past performance of their strategies and quality metrics of their current portfolios. As holdings and their weights change over time, I may update reviews, usually once a year.
LVHD strategy and portfolio
The Legg Mason Low Volatility High Dividend ETF (NASDAQ:LVHD) has been tracking the QS Low Volatility High Dividend Index since 12/28/2015. As of writing this, LVHD has 99 holdings, a SEC Yield of 3.24% and a net expense rate of 0.27%.
As described on Franklin Templeton website:
Stocks in the Underlying Index must have demonstrated profitability over the last four fiscal quarters as a whole. Stocks whose yields are not supported by earnings are excluded from the Underlying Index. The methodology calculates a composite “stable yield” score, with the yield of stocks with relatively higher price volatility and earnings volatility adjusted downward and the yield of stocks with relatively lower price volatility and earnings volatility adjusted upward. Franklin Advisers anticipates that the number of component securities in the Underlying Index will range from 50 to 100. At the time of each reconstitution, no individual component of the Underlying Index will exceed 2.5% of the Underlying Index, no individual sector will exceed 25% of the Underlying Index, and real estate investment trust (“REIT”) components as a whole will not exceed 15% of the Underlying Index. The Underlying Index’s components are reconstituted annually and rebalanced quarterly.
During the most recent fiscal year, the fund had a turnover rate of 52% of the average portfolio value.
The fund invests mostly in U.S. companies (98.1% of asset value) of the large cap (58.1%) and mid-cap (32.6%) segments.
The heaviest sectors are utilities (23%) and consumer staples (19.8%). Other sectors are below 12%. Compared to the S&P 500 (SPY), the fund overweights these two sectors, and also real estate, industrials and materials. It underweights a lot technology, consumer discretionary, healthcare and ignores energy.
LVHD sectors (Chart: author; data: Fidelity)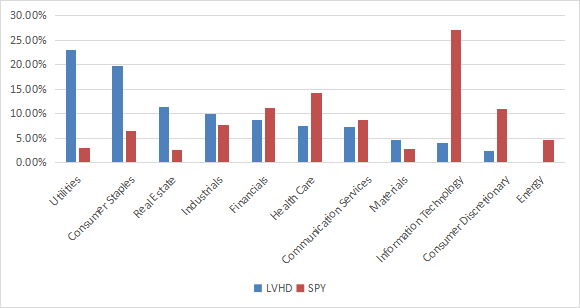
The top 10 holdings, listed in the next table with some fundamental ratios, represent about 25.5% of asset value. The largest holding weighs 2.78%, so risks related to individual stocks are low.
|
Ticker |
Name |
Weight% |
EPS growth %TTM |
P/E TTM |
P/E fwd |
Yield% |
|
AT&T Inc. |
2.78 |
778.75 |
8.74 |
8.10 |
5.36 |
|
|
Air Products and Chemicals Inc. |
2.60 |
15.81 |
25.39 |
24.13 |
2.61 |
|
|
Philip Morris International Inc. |
2.58 |
4.39 |
17.71 |
18.60 |
4.89 |
|
|
Cummins Inc. |
2.55 |
6.24 |
15.29 |
11.81 |
2.82 |
|
|
Gilead Sciences Inc. |
2.52 |
1478.31 |
16.97 |
9.28 |
4.81 |
|
|
American Electric Power Co. Inc. |
2.51 |
13.77 |
18.86 |
19.65 |
3.18 |
|
|
Lockheed Martin Corp. |
2.51 |
-8.63 |
19.00 |
16.00 |
2.60 |
|
|
VICI Properties Inc. |
2.51 |
-27.78 |
18.52 |
16.00 |
4.81 |
|
|
Citigroup Inc. |
2.48 |
11.64 |
5.62 |
7.10 |
4.28 |
|
|
Pfizer Inc. |
2.48 |
121.74 |
11.47 |
7.41 |
3.20 |
Historical performance
Since inception in December 2015, LVHD has underperformed SPY by 2.28 percentage points in annualized return, with a lower volatility (standard deviation of monthly returns), but a slightly deeper drawdown. LVHD has also lagged two popular dividend-oriented ETFs: the Schwab U.S. Dividend Equity ETF (SCHD) and the Vanguard Dividend Appreciation Index Fund (VIG).
|
Total Return |
Annual Return |
Drawdown |
Sharpe ratio |
Volatility |
|
|
LVHD |
88.97% |
10.39% |
-34.78% |
0.86 |
12.45% |
|
SPY |
116.68% |
12.76% |
-32.05% |
0.98 |
14.56% |
|
SCHD |
137.30% |
14.37% |
-32.29% |
1.04 |
14.48% |
|
VIG |
114.60% |
12.60% |
-29.58% |
1.03 |
12.99% |
Data calculated with Portfolio123
The next chart plots the equity value of $100 invested in LVHD and SPY since LVHD inception, with all dividends reinvested.
LVHD vs. SPY (Chart: author: data: Portfolio123)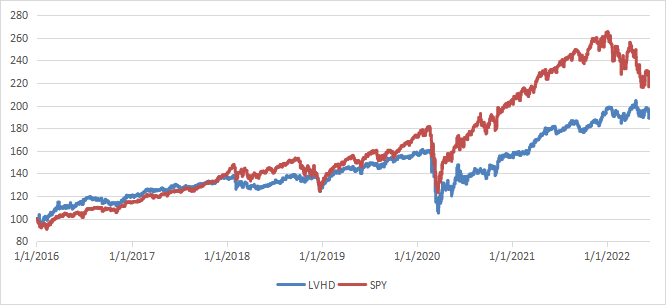
Scanning the current portfolio
LVHD holds 99 stocks. It is cheaper than the S&P 500 regarding the usual valuation ratios (see next table).
|
LVHD |
SPY |
|
|
Price / Earnings TTM |
16.37 |
20.05 |
|
Price / Book |
2.35 |
3.85 |
|
Price / Sales |
2.35 |
2.58 |
|
Price / Cash Flow |
11.82 |
15.55 |
In previous articles, I have shown how three factors may help cut the risk in a dividend portfolio: Return on Assets, Piotroski F-score, Altman Z-score. My core portfolio holds 14 stocks selected using these metrics (more info at the end of this post). I have scanned LVHD holdings with these quality metrics. I consider that risky stocks are companies with at least 2 red flags among: bad Piotroski score, negative ROA, unsustainable payout ratio, bad or dubious Altman Z-score, excluding financials and real estate where these metrics are less relevant. With these assumptions, only 2 stocks are risky and they weigh about 2% of asset value, which is a good point.
Based on my calculation, aggregate Altman Z-score and return on assets are slightly below SPY’s aggregate values. The Piotroski F-score is almost identical. These metrics point to a portfolio quality similar to the benchmark.
|
LVHD |
SPY |
|
|
Altman Z-score |
2.67 |
3.32 |
|
Piotroski F-score |
6.15 |
6.16 |
|
ROA% TTM |
7.43 |
7.89 |
Takeaway
LVHD holds 99 dividend stocks selected by a screening process based on profitability, payout ratio, yield, and volatility. It is slightly cheaper than the S&P 500 index regarding valuation ratios, and quality is close to it according to my metrics. Price volatility is lower than for the benchmark, but the maximum drawdown is slightly deeper. The 3%-plus yield is attractive for dividend-oriented investors, but total return since inception is disappointing compared to dividend ETFs like SCHD (in the same yield range) or VIG (dividend growth ETF in a lower yield range). However, it may be too early to judge it with only six years of data. LVHD has 3 stars at Morningstar, which is an average rating. For transparency, my equity investments are split between a passive ETF allocation (LVHD is not part of it) and an actively managed stock portfolio, whose positions and trades are disclosed in Quantitative Risk & Value.
Be the first to comment