

JHVEPhoto/iStock Editorial via Getty Images
This article was co-produced with James Marino Sr. of Portfolio Insight.
Created by the author
This article series compiles a list of upcoming ex-dividend dates of stocks in Dividend Radar, a spreadsheet containing stocks with dividend increase streaks of five years or more.
To earn the next dividend, be sure to buy a stock before its ex-dividend date, which usually is one business day before the record date. Unfortunately, if you wait until the ex-dividend date or thereafter, you won’t receive the next dividend payment! Instead, the seller will receive the next dividend.
Upcoming Ex-Dividend Dates
The following table presents a summary of ex-dividend dates for the next two weeks. The table is divided into sections by Ex-Div Date and sorted by Ticker for each date. Yrs are years of consecutive dividend increases, Yield is the new dividend yield for the market close Price on the date listed, and 5-yr DGR is the compound annual growth rate of the dividend over a 5-year period (on a trailing 12-month basis). Note that Payout is the dollar amount payable per share or unit on the Pay Date.
| Company (Ticker) | Yrs | Price | Fwd | 5-Yr | Next | Pay |
| (06/29) | Yield | DGR | Payout | Date | ||
| Ex-Div Date: 07/01 (Last Day to Buy: Thursday, 06/30) | ||||||
| Agilent Technologies (A) | 11 | $117.90 | 0.71% | 5.4% | 0.21 | 07/27 |
| Bank of South Carolina (BKSC) | 12 | $16.99 | 4.00% | 6.6% | 0.17 | 07/29 |
| Dollar General (DG) | 8 | $247.05 | 0.89% | 17.5% | 0.55 | 07/19 |
| Edison International (EIX) | 19 | $62.86 | 4.45% | 5.9% | 0.7 | 07/31 |
| Globe Life (GL) | 16 | $97.94 | 0.85% | 11.6% | 0.208 | 08/01 |
| Main Street Capital (MAIN) | 12 | $38.55 | 6.69% | 0.9% | 0.215 | 07/15 |
| Parke Bancorp (PKBK) | 7 | $21.16 | 3.02% | 20.7% | 0.16 | 07/19 |
| Thor Industries (THO) | 14 | $76.21 | 2.26% | -0.3% | 0.43 | 07/19 |
| Ex-Div Date: 07/04 (Last Day to Buy: Friday, 07/01) | ||||||
| Bank of Nova Scotia (BNS) | 7 | $59.55 | 5.41% | 1.3% | 1.03 | 07/27 |
| Ex-Div Date: 07/05 (Last Day to Buy: Friday, 07/01) | ||||||
| Comcast (CMCSA) | 14 | $39.33 | 2.75% | 12.7% | 0.27 | 07/27 |
| Cisco Systems (CSCO) | 12 | $42.88 | 3.54% | 7.3% | 0.38 | 07/27 |
| Cousins Properties (CUZ) | 5 | $29.76 | 4.30% | 34.7% | 0.32 | 07/15 |
| Quest Diagnostics (DGX) | 12 | $137.61 | 1.92% | 8.5% | 0.66 | 07/20 |
| Erie Indemnity (ERIE) | 32 | $187.26 | 2.37% | 7.2% | 1.11 | 07/20 |
| Healthcare Trust of America (HTA) | 10 | $28.43 | 4.57% | -4.1% | 0.325 | 07/15 |
| JPMorgan Chase (JPM) | 12 | $115.30 | 3.47% | 15.1% | 1 | 07/31 |
| John Wiley (WLY) | 23 | $48.12 | 2.87% | -2.2% | 0.348 | 07/20 |
| John Wiley (WLYB) | 23 | $46.21 | 2.99% | -2.2% | 0.348 | 07/20 |
| Ex-Div Date: 07/06 (Last Day to Buy: Tuesday, 07/05) | ||||||
| ABM Industries (ABM) | 55 | $42.42 | 1.84% | -2.9% | 0.195 | 08/01 |
| Sempra Energy (SRE) | 18 | $150.31 | 3.05% | 7.6% | 1.145 | 07/15 |
| Simpson Manufacturing (SSD) | 9 | $99.10 | 1.05% | 1.4% | 0.26 | 07/28 |
| Ex-Div Date: 07/07 (Last Day to Buy: Wednesday, 07/06) | ||||||
| Brady (BRC) | 37 | $46.43 | 1.94% | 1.8% | 0.225 | 07/29 |
| Farmers & Merchants Bancorp (FMAO) | 13 | $33.46 | 2.27% | 9.7% | 0.19 | 07/20 |
| Gentex (GNTX) | 11 | $28.51 | 1.68% | 6.2% | 0.12 | 07/20 |
| Horizon Bancorp (HBNC) | 12 | $17.57 | 3.41% | 9.5% | 0.16 | 07/22 |
| Mastercard (MA) | 11 | $322.59 | 0.61% | 18.0% | 0.49 | 08/09 |
| NetApp (NTAP) | 9 | $65.36 | 3.06% | 21.4% | 0.5 | 07/27 |
| Roper Technologies (ROP) | 29 | $393.55 | 0.63% | 13.1% | 0.62 | 07/22 |
| Riverview Bancorp (RVSB) | 8 | $6.57 | 3.35% | 21.3% | 0.06 | 07/21 |
| Toronto-Dominion Bank (TD) | 7 | $65.76 | 4.30% | 9.1% | 0.89 | 07/31 |
| Verizon Communications (VZ) | 18 | $50.94 | 5.03% | 2.1% | 0.64 | 08/01 |
| Ex-Div Date: 07/08 (Last Day to Buy: Thursday, 07/07) | ||||||
| Hormel Foods (HRL) | 56 | $47.96 | 2.17% | 10.5% | 0.26 | 08/15 |
| Intuit (INTU) | 11 | $389.66 | 0.70% | 14.7% | 0.68 | 07/18 |
| Lincoln National (LNC) | 13 | $47.29 | 3.81% | 10.5% | 0.45 | 08/01 |
| McCormick (MKC) | 23 | $85.63 | 1.73% | 9.6% | 0.37 | 07/25 |
| McCormick (MKC) | 36 | $81.88 | 1.81% | 9.6% | 0.37 | 07/25 |
| OGE Energy (OGE) | 17 | $38.15 | 4.30% | 7.1% | 0.41 | 07/29 |
| Shoe Carnival (SCVL) | 9 | $22.35 | 1.61% | 21.7% | 0.09 | 07/25 |
| UDR (UDR) | 13 | $46.29 | 3.28% | 4.2% | 0.38 | 08/01 |
| Universal (UVV) | 51 | $60.61 | 5.21% | 7.9% | 0.79 | 08/01 |
| Ex-Div Date: 07/11 (Last Day to Buy: Friday, 07/08) | ||||||
| Apogee Enterprises (APOG) | 11 | $38.67 | 2.28% | 9.8% | 0.22 | 07/27 |
| Oracle (ORCL) | 13 | $69.21 | 1.85% | 16.4% | 0.32 | 07/26 |
| Ex-Div Date: 07/12 (Last Day to Buy: Monday, 07/11) | ||||||
| VSE (VSEC) | 9 | $37.17 | 1.08% | 9.5% | 0.1 | 07/27 |
| Ex-Div Date: 07/13 (Last Day to Buy: Tuesday, 07/12) | ||||||
| Accenture plc (ACN) | 11 | $279.81 | 1.39% | 9.9% | 0.97 | 08/15 |
| Johnson Outdoors (JOUT) | 9 | $61.52 | 1.95% | 24.6% | 0.3 | 07/28 |
| Kadant (KAI) | 10 | $181.02 | 0.57% | 5.7% | 0.26 | 08/11 |
| Ex-Div Date: 07/14 (Last Day to Buy: Wednesday, 07/13) | ||||||
| AbbVie (ABBV) | 10 | $154.14 | 3.66% | 17.7% | 1.41 | 08/15 |
| Abbott Laboratories (ABT) | 9 | $109.10 | 1.72% | 11.7% | 0.47 | 08/15 |
| Camden National (CAC) | 10 | $43.52 | 3.68% | 12.3% | 0.4 | 07/29 |
| City (CHCO) | 12 | $79.52 | 3.02% | 6.4% | 0.6 | 07/29 |
| EOG Resources (EOG) | 5 | $113.22 | 2.65% | 24.3% | 0.75 | 07/29 |
| Idex (IEX) | 13 | $181.08 | 1.33% | 9.7% | 0.6 | 07/29 |
| Quaker Chemical (KWR) | 15 | $147.93 | 1.12% | 3.6% | 0.415 | 07/29 |
| Mid-America Apartment Communities (MAA) | 13 | $173.19 | 2.89% | 4.6% | 1.25 | 07/25 |
| McGrath RentCorp (MGRC) | 30 | $75.28 | 2.42% | 16.4% | 0.455 | 07/29 |
| Norwood Financial (NWFL) | 22 | $24.30 | 4.61% | 4.9% | 0.28 | 08/01 |
| RGC Resources (RGCO) | 22 | $18.99 | 4.11% | 6.4% | 0.195 | 08/01 |
| Trinity Industries (TRN) | 12 | $24.06 | 3.82% | 14.4% | 0.23 | 07/29 |
| WD-40 (WDFC) | 13 | $200.08 | 1.56% | 10.9% | 0.78 | 07/29 |
Previous Post: Upcoming Ex-Dividend Dates: June 24-July 7, 2022
High-Quality Candidates
We use DVK Quality Snapshots to assess the quality of dividend growth stocks. An elegant and effective system, DVK Quality Snapshots employs five quality indicators and assigns 0-5 points to each quality indicator for a maximum quality score of 25 points.
We assigned quality scores to all Dividend Radar stocks with upcoming ex-dates and screened for stocks with quality scores of 22 or higher. There are eleven such candidates this week.
Below we present the quality scores, an assessment of fair value (whether Above, At, or Below fair value), and two measures of each stock’s recent performance (1-year and 3-year trailing total returns [TTR]). Key metrics from the previous table are repeated here for convenience.
Created by the author from data in Dividend Radar and using DVK Quality Snapshots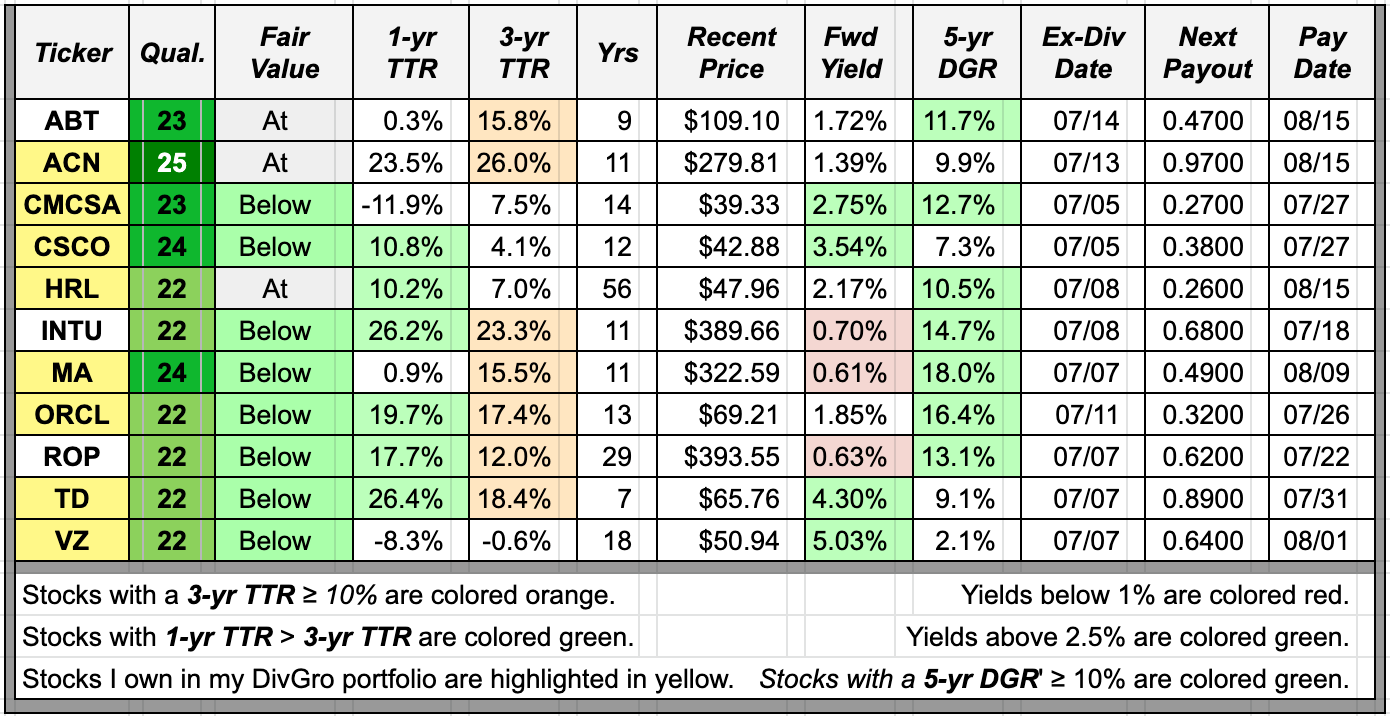
Dividend Radar views fair value as a range. All but three stocks are trading at discounted valuations below the fair value range. The exceptions are ABT, ACN, and HRL, which are all trading within the fair value range.
TTR adds the returns due to stock price appreciation (or depreciation) and dividend payments over each time frame. Dividend Radar provides 1-year and 3-year TTRs. The summary table highlights 3-year TTRs of 10% or higher in orange and any 1-year TRR that exceeds the 3-year TTR in green (indicating stronger recent performance).
Seven of this week’s candidates have 3-year TTRs above 10% but only four of those also have 1-year TTRs that exceed the corresponding 3-year TTRs.
We also color-code the Fwd Yield and 5-yr DGR columns, preferring forward dividend yields above 2.5% and 5-year dividend growth rates of 10% or higher.
Four candidates yield more than 2.5% (CMCSA, CSCO, TD, and VZ), and seven have 5-year dividend growth rates above 10% (ABT, CMCSA, HRL, INTU, MA, ORCL, and ROP).
An Interesting Candidate
Ideally, we’d like to see green cells in each of the Fair Value, 1-yr TTR, Fwd Yield, and 5-yr DGR columns. That rarely happens, though, so we look for a candidate that offers the best metrics overall, at least based on our current investment objectives.
We’ve covered all but one of these stocks before, but let’s cover Dividend Contender, Intuit (INTU) this week.
INTU provides financial management and compliance products and services for consumers, small businesses, self-employed, and accounting professionals in the United States, Canada, and internationally. The company operates in three segments: Small Business & Self-Employed, Consumer, and Strategic Partner. INTU was founded in 1983 and is headquartered in Mountain View, California.
INTU is rated Fine (quality score 19-22):
Created by the author from a personal spreadsheet based on DVK Quality Snapshots
The stock yields only 0.70% at $389.66 per share and has an impressive 5-year DGR of 14.7%.
Over the past 10 years, INTU easily outperformed the SPDR S&P 500 ETF (SPY), an ETF designed to track the 500 companies in the S&P 500 index:
Portfolio-Insight.com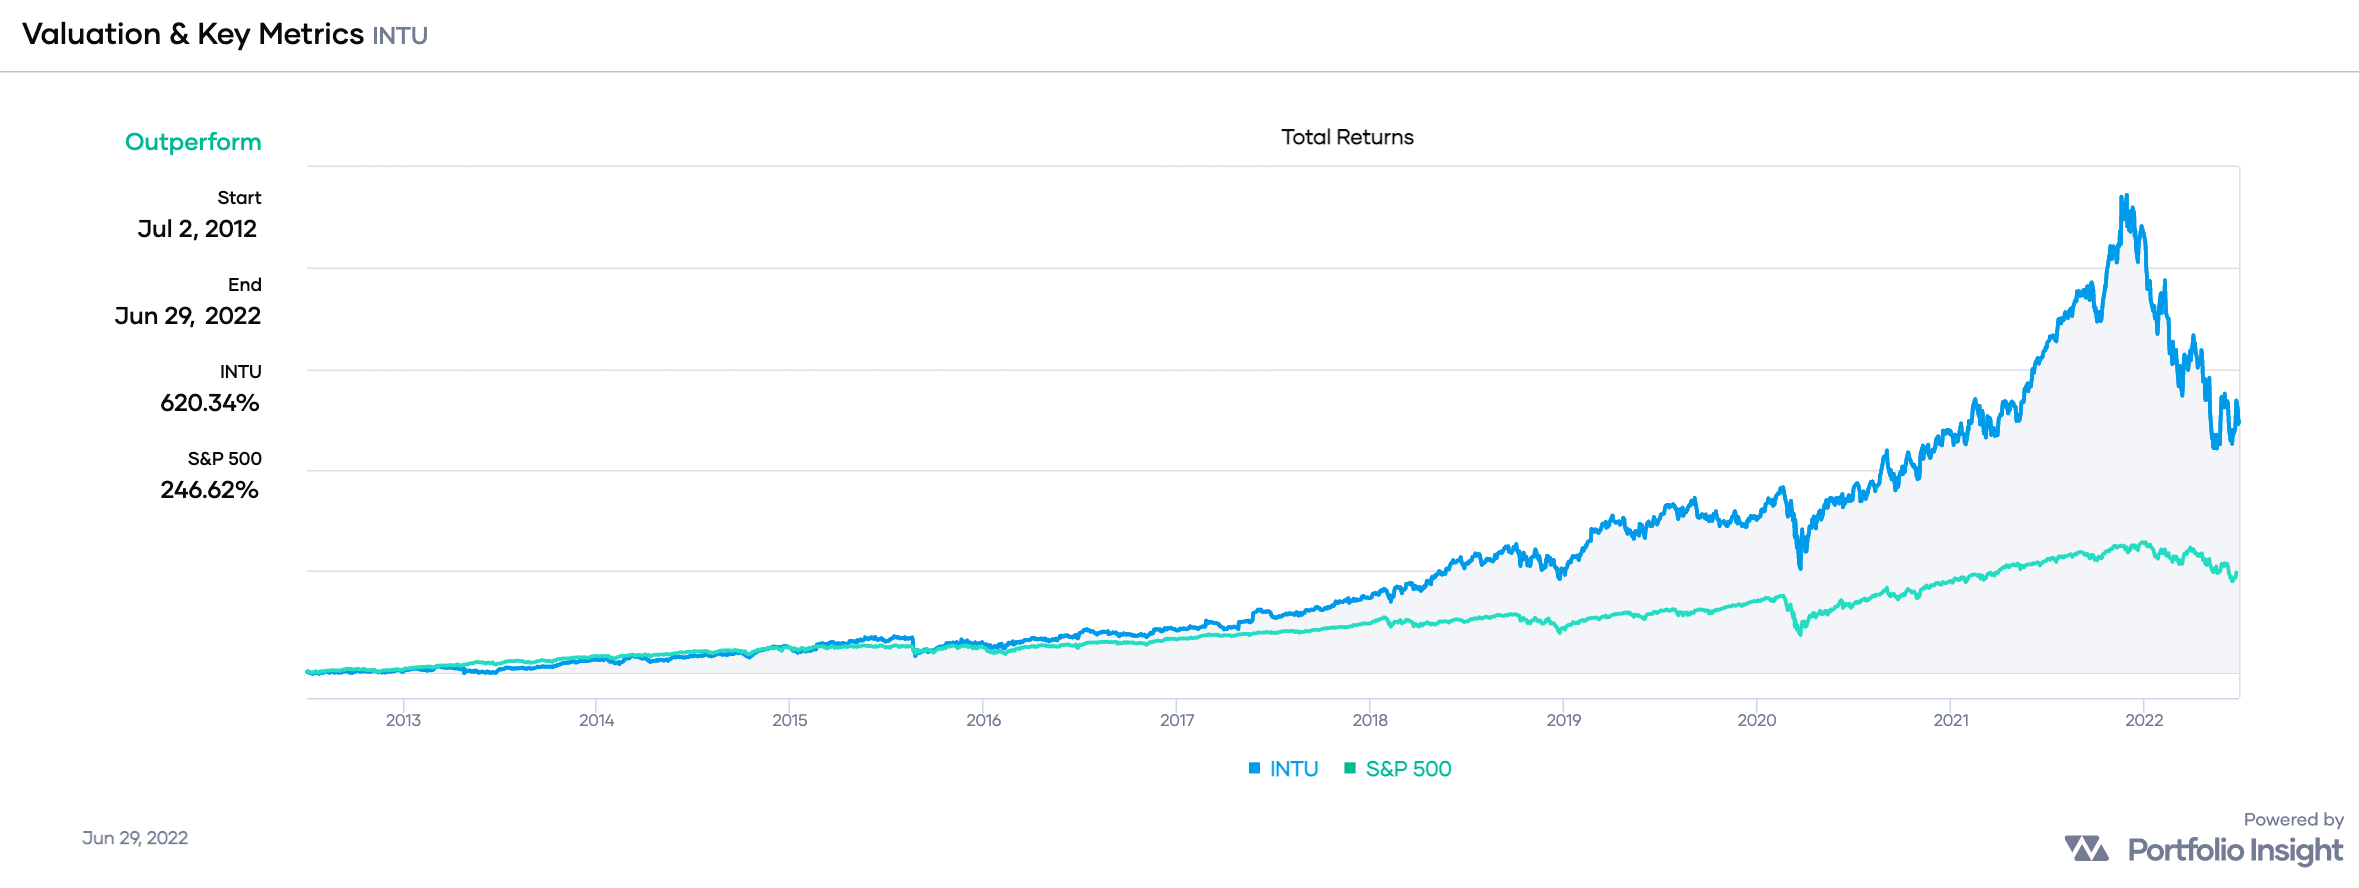
INTU delivered total returns of 620% versus SPY’s 247%, a margin of 2.51-to-1!
If we extend the time frame of comparison to the past 20 years, INTU’s outperformance is even more impressive, with total returns of 1,637% versus SPY’s 479%. That’s a margin of 3.42-to-1!
Here is a chart showing INTU’s dividend growth history through the end of 2021:
Portfolio Insight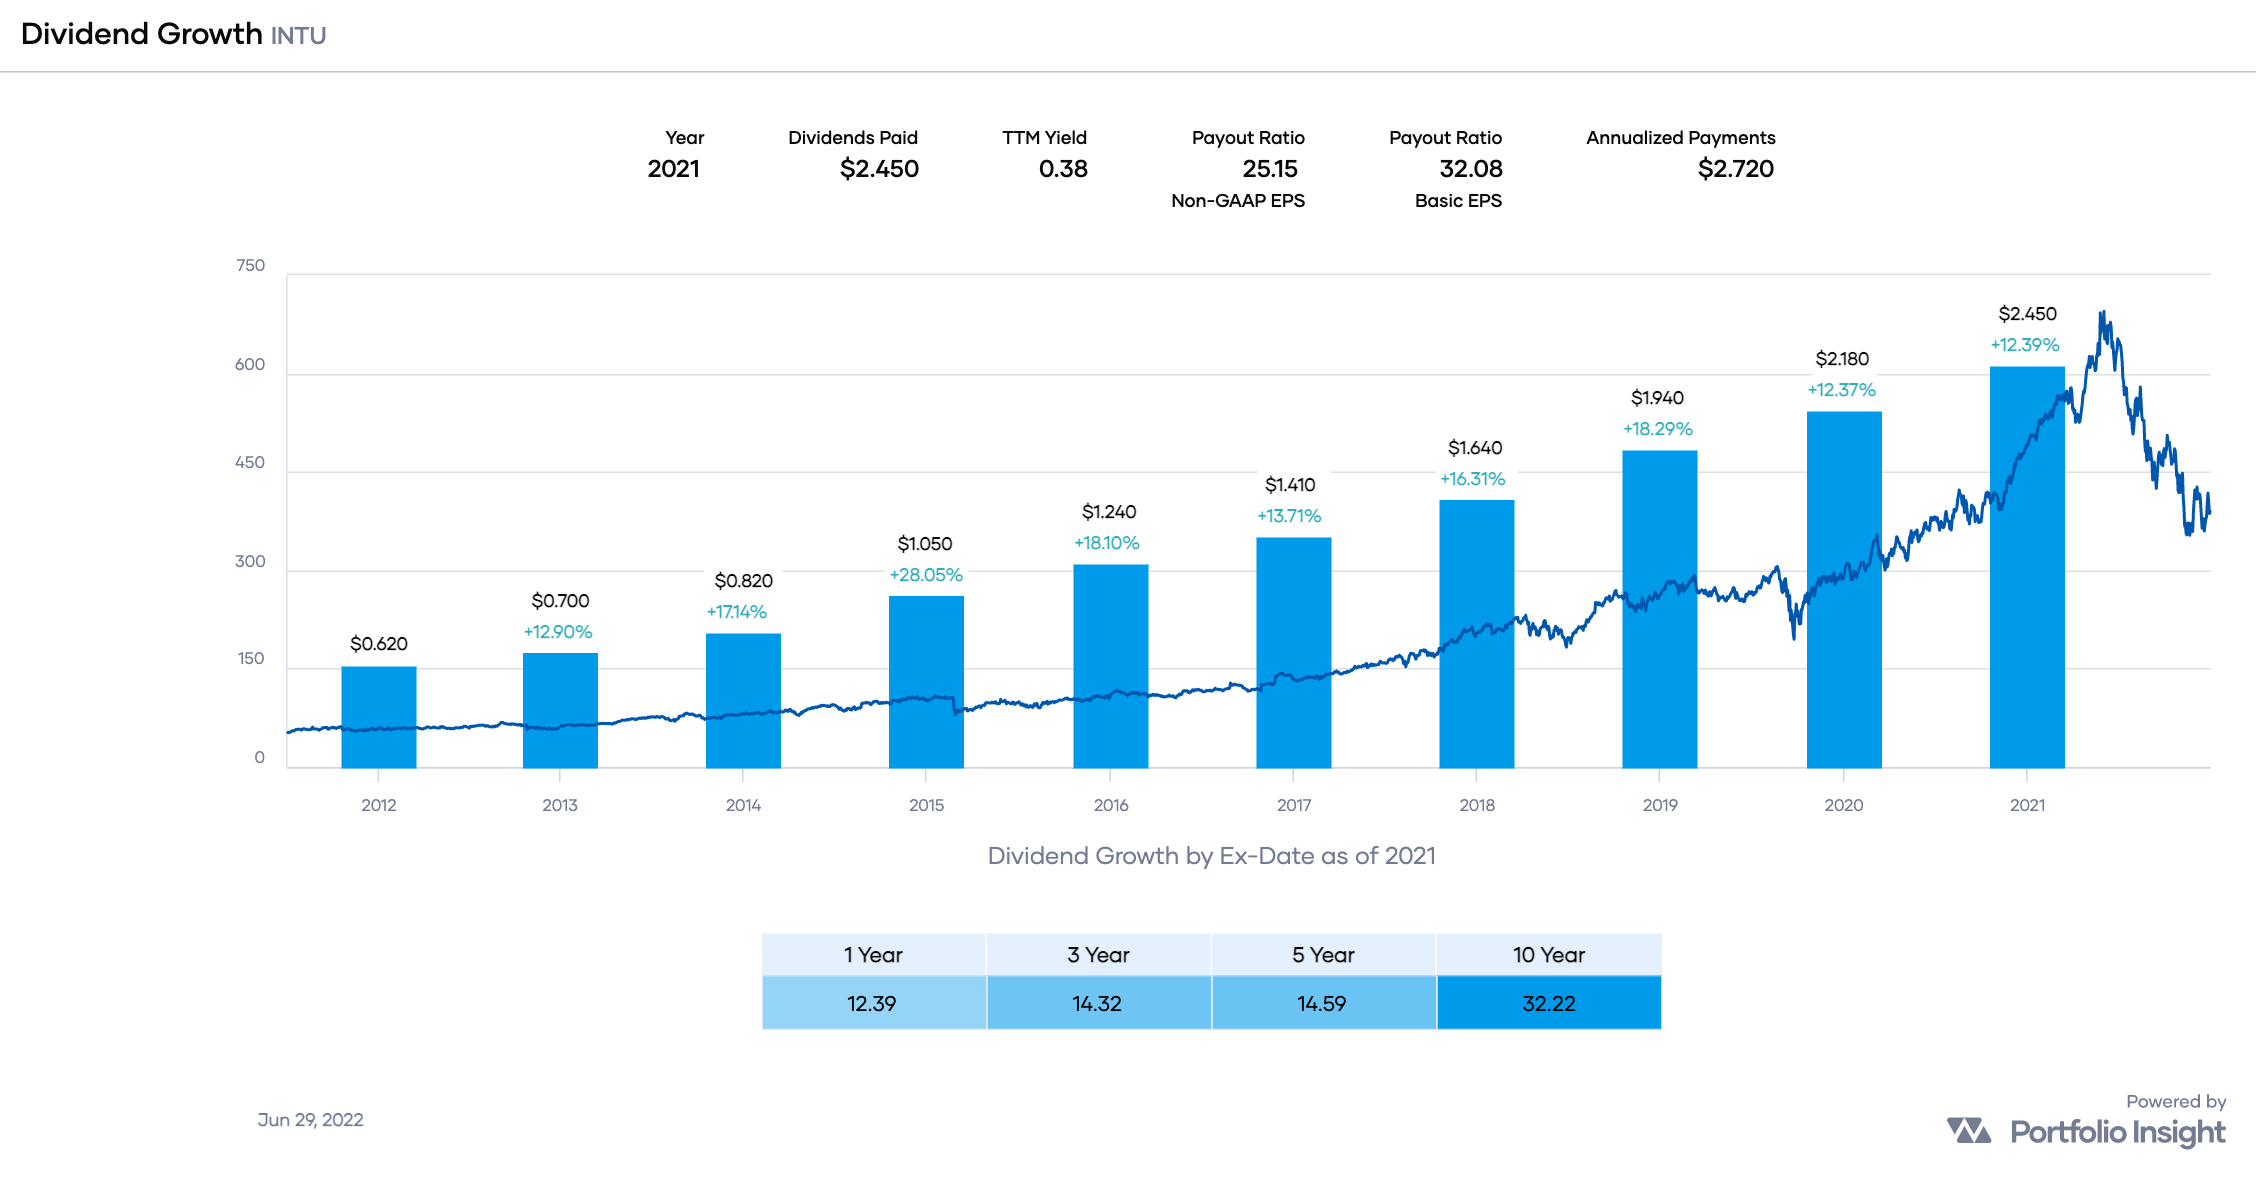
INTU’s dividend growth history is quite impressive! Typical of many Dividend Contenders, though, INTU’s dividend growth rate [DGR] is decelerating. We can see this by dividing the 3-year DGR by the 5-year counterpart: 14.32 ÷ 14.59 = 0.98. A ratio below 1.00 indicates a deceleration of the DGR. However, note that INTU’s last increase was a generous 17%!
INTU’s earnings growth is truly impressive, with increases in FY 2022 through FY 2024 expected to continue the upward trend:
Portfolio Insight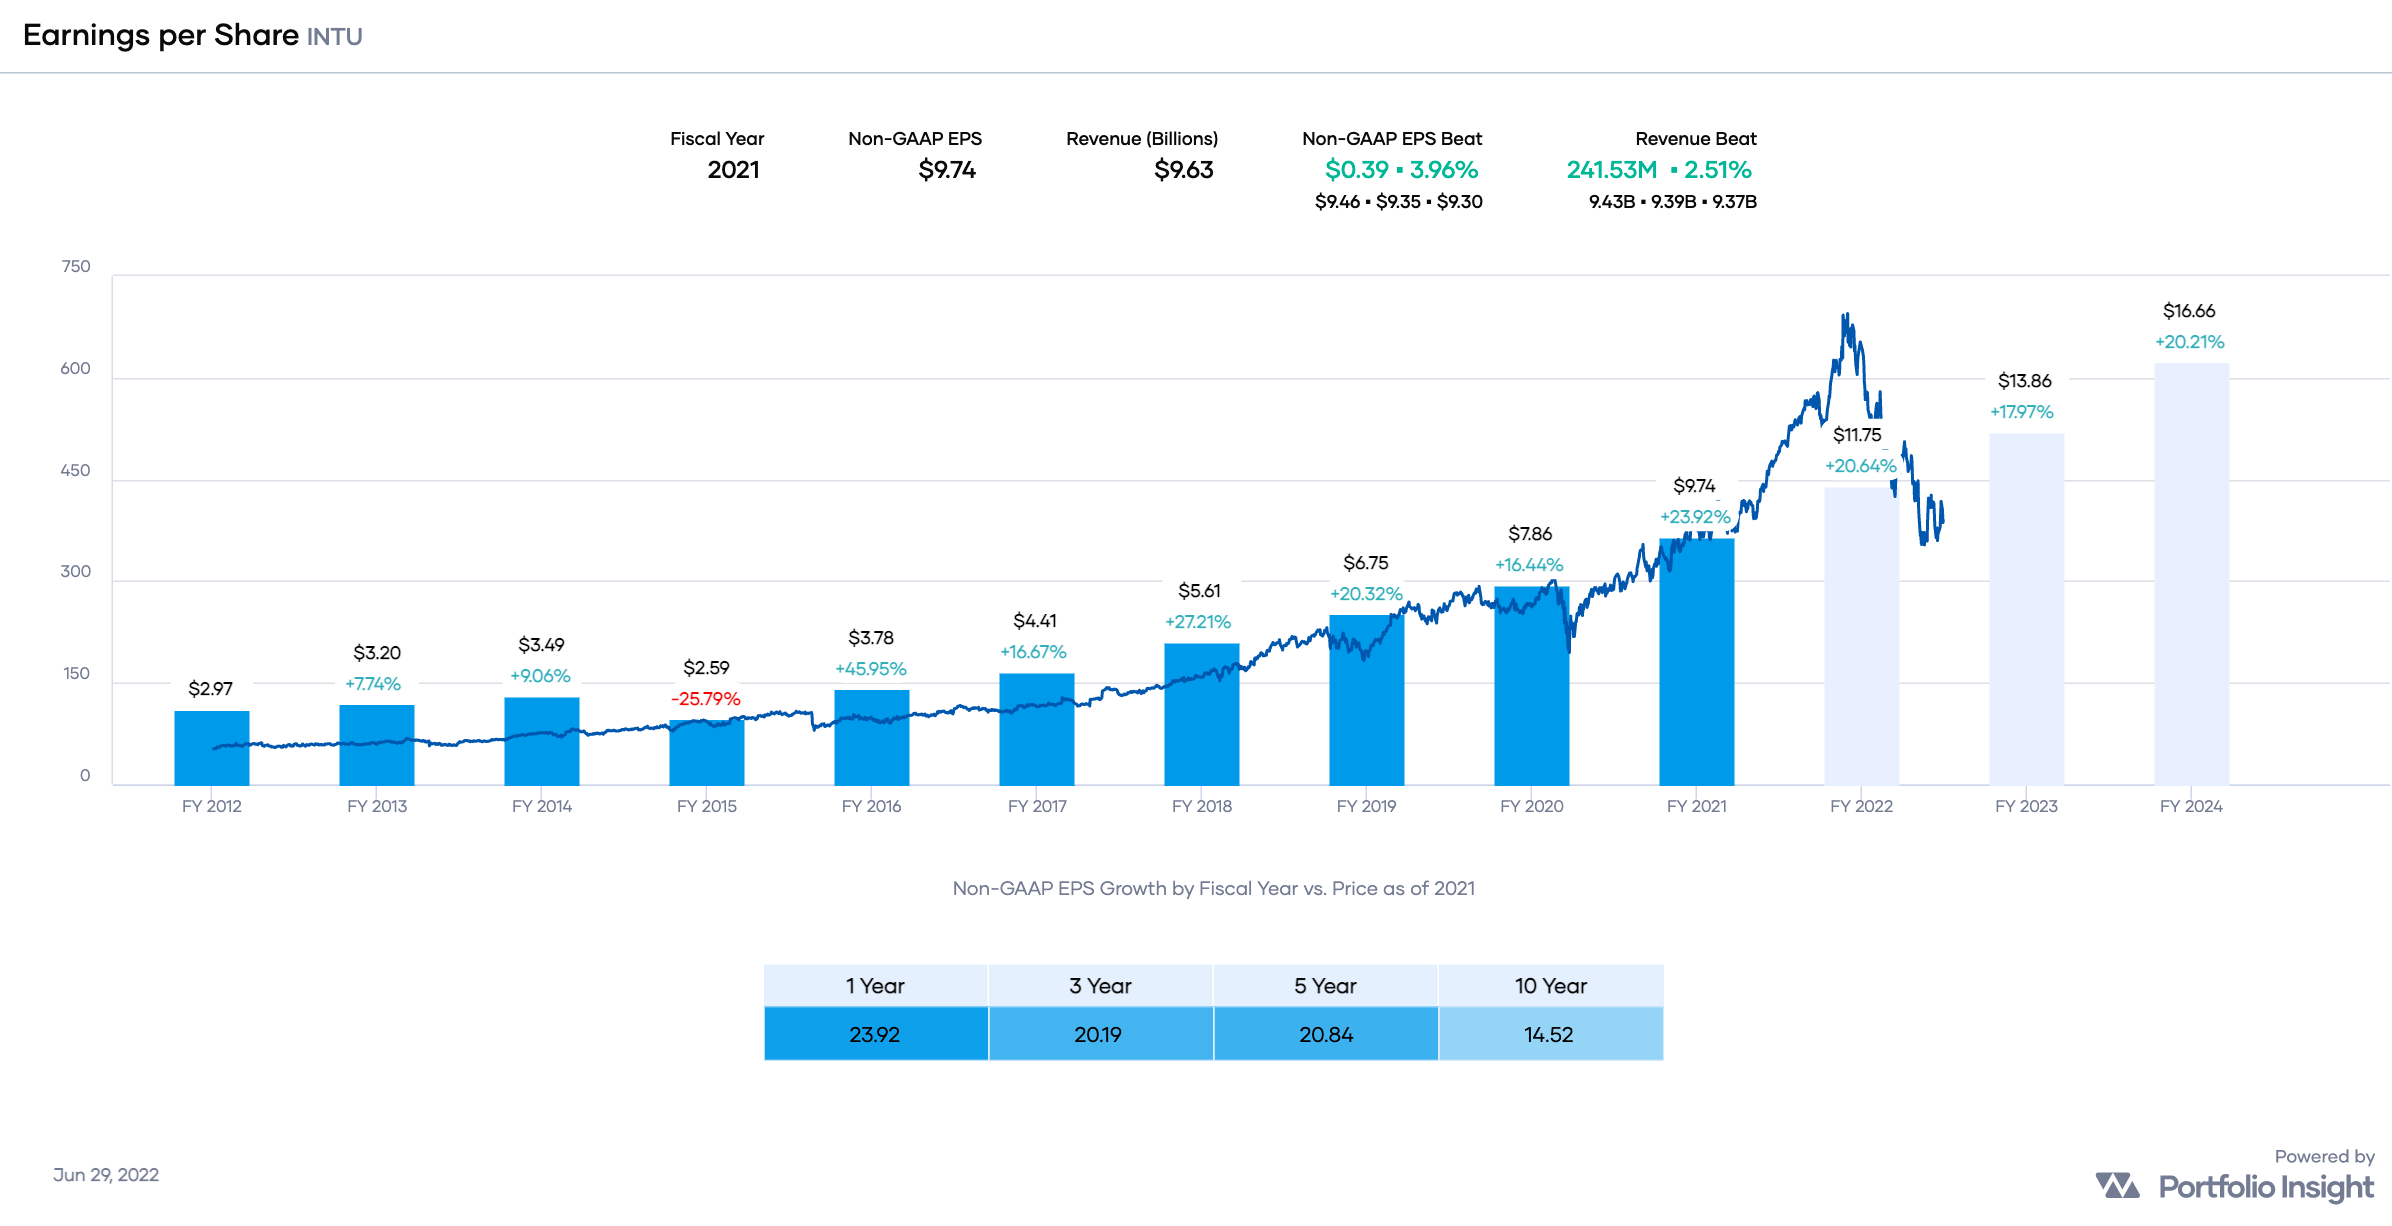
Note that INTU’s earnings growth rate is accelerating, which is typical for hyper-growth stocks.
INTU’s payout ratio of 21% is “very low for most companies,” according to Simply Safe Dividends:
Simply Safe Dividends
INTU has plenty of room to continue paying and increasing its dividend! Simply Safe Dividends considers INTU’s dividend Very Safe with a Dividend Safety Score of 98.
Let’s now consider INTU’s valuation.
Portfolio Insight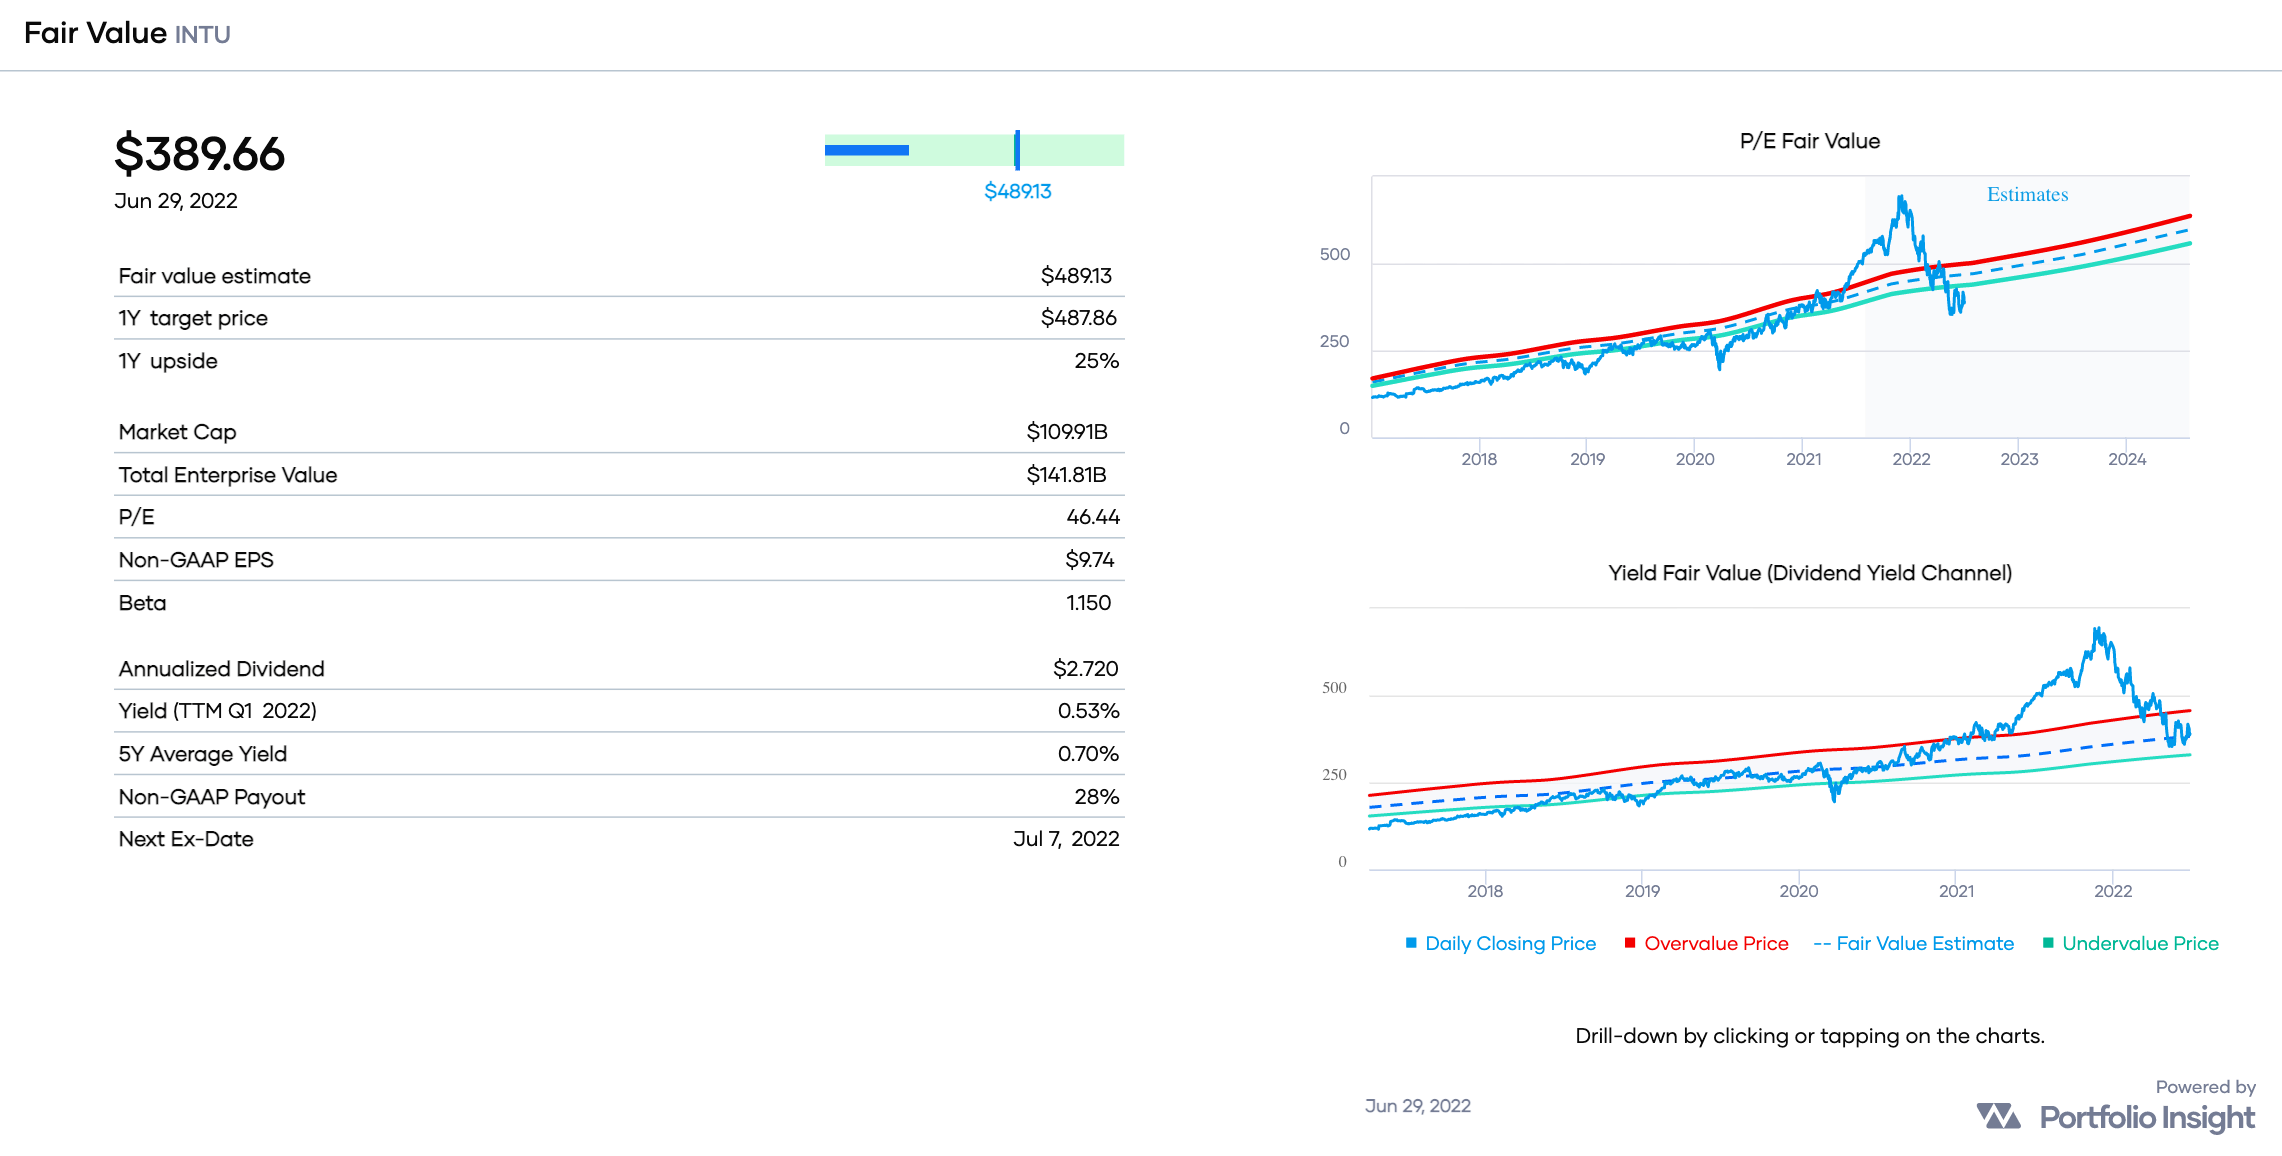
A quick way to estimate fair value is to divide the annualized dividend ($2.72) by the stock’s 5-year average yield (0.70%). That results in a fair value [FV] estimate of $389 based on INTU’s dividend yield history.
For reference, CFRA’s FV is $292, Finbox.com’s FV is $488, Portfolio Insight’s FV is $489, Morningstar’s FV is $511, and Simply Wall St’s FV is $555. That’s quite a range of opinions!
My own FV estimate of INTU is $421.
The average of all these estimates is $449. Given the stock’s current share price of $389.66, it appears that INTU is trading at a discounted valuation of about 13%.
Here are the most recent Seeking Alpha articles covering INTU:
- Hold: Intuit: If Successfully Integrated, Credit Karma And Mailchimp Are Game Changers, by Beersheba Research
- Buy: Intuit‘s Q3 Earnings Digest: Diversification For The Win, by Best Anchor Stocks
- Buy: Intuit: Strong Q3 Results Confirmed Structural Growth And Resilience, by Librarian Capital
Conclusion: INTU is a high-quality dividend growth stock trading below my fair value estimate of $421. For stocks rated Fine, my Buy Below price equals my FV estimate. Therefore, my Buy Below price for INTU is $421 per share. For conservative investors, a buy below $379 would be more appropriate.
Please note that we’re not recommending INTU or any of the stocks listed in this article. Readers should do their own research on these companies before buying shares.
Be the first to comment