

hobo_018/E+ via Getty Images
The greater stock market has been a rough go in 2022. This has been due to an array of different things.
- Peak inflation last seen in the 1980s
- Poor Consumer Sentiment not seen since the 80s recession
- Rising interest rates
- Fed tightening resulting in selling off its Treasury Bonds
Knowing all this, and how the economy as a whole will be under pressure in 2022, likely headed for a recession if we are not already in one, it is important to prepare your portfolio.
Things are more than likely going to get worse before they get better. Due to the high inflation we are seeing, the Fed’s hand is almost forced to take this aggressive approach.
Here is a look at inflation over the past decade here in the US:
US Inflation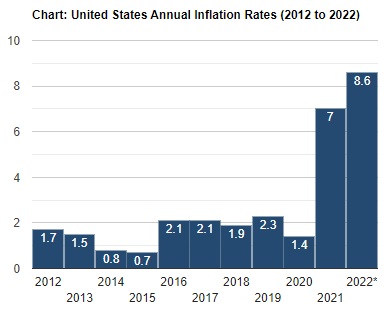
An Under The Radar High-Quality REIT
With that being said, it is important to build your portfolio with safe, high-quality companies. This is where National Retail Properties (NYSE:NNN) comes into play.
National Retail Properties is an established triple net-lease REIT with 3,271 single-tenant properties across 48 states, that are leased out to over 370 different tenants, as of Q1 2022.
NNN Investor Relations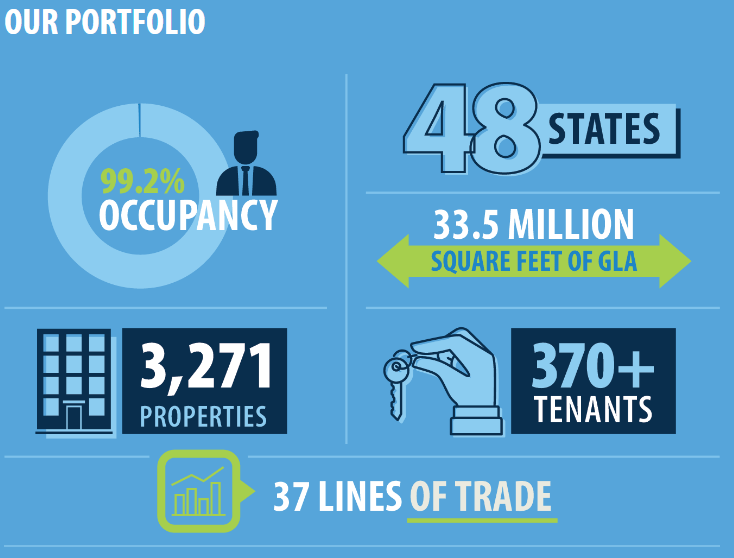
National Retail Properties is a net lease REIT, meaning many of the typical landlord costs, such as Insurance, Property Taxes, and Maintenance are all passed onto the tenants.
The net lease sector is one of my favorite REIT types to invest in, as they have some of the highest quality REITs available to investors. This includes the likes of Realty Income (O), STORE Capital (STOR), and W.P. Carey (WPC) just to name a few.
National Retail Properties has often been compared to and flown under the shadow of its larger counterpart Realty Income. However, the company has stood up to the challenge and performed quite well. Both NNN and O became public companies at the same time in 1994.
Realty Income is known for its Monthly Dividend, but National Retail Properties has outdone them with 32 consecutive years of dividend growth. We expect that to be 33 years in a few weeks when the company is expected to raise the dividend yet again.
NNN Q1 Investor Presentation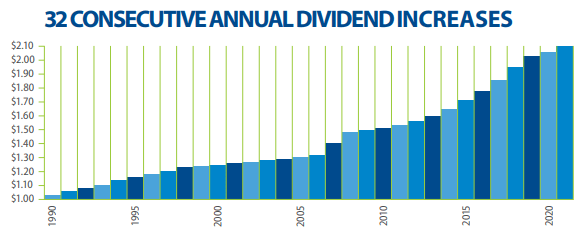
This is a testament to the leadership of NNN as well as the strength of their portfolio to grow funds from operations over the years.
Before we get into their recent results, let’s take a look at the company’s top tenants. Here is a look at the company’s top 10 Tenants based on Annual Base Rent:
NNN Investor Relations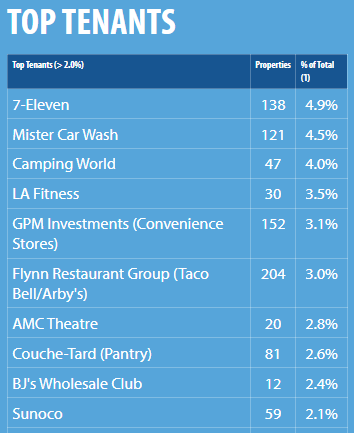
As you can see from the slide above, the company’s top 10 tenants account for roughly 33% of total annual base rent.
Here is a look at the company’s portfolio based on industries.
NNN Q1 Investor Presentation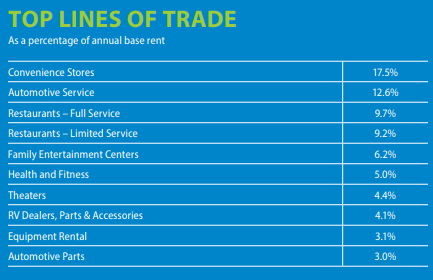
Convenience stores continue to hold the top spot, accounting for 17.5% of annual base rent followed by Automotive Services accounting for 12.6%. With convenience stores and service related industries making up a large bulk of the portfolio, you can see why a company like National Retail Properties has been able to withstand numerous slow economic cycles.
It is interesting to many when they hear the word “retail” in the name, it could worry some with the threat of e-commerce, but in reality, the portfolio is rather resistant to this threat. This in large part is due to its exposure to convenience stores, service retail, and restaurants.
Exposure to Theaters as well as fitness clubs does exist within the portfolio, but the exposure to these industries has been lowering over the years. We saw how these two got heavily punished during the global pandemic, but both have recovered nicely of late.
Out of The Gates Fast In Q1
During the company’s most recently quarterly earnings report, NNN reported an occupancy rate of 99.2%. The company has maintained a long-term average occupancy rate above 98%. In addition, the company collected 99.6% of all rent due in Q1.
The company reported Q1 Core FFO of $0.77, which was an increase of 11.6% year over year. Revenues during the quarter grew 6% to $190.3 million.
NNN continued to add to its portfolio during the period as it invested $210.8 million in property investments, acquiring 59 new properties with an aggregate 879,000 square feet of leasable space.
The balance sheet over the years has been a strength for the company and has allowed them to grow their portfolio at very reasonable debt terms, which has proven to be a major advantage. The company has a BBB+ credit rating.
During the Q1 earnings call, CEO Steve Horn announced the company’s progress to start the year as well as a positive guidance revision:
Given our strong beginning of the year, we are pleased to announce an increase in our guidance for 2022 core FFO from a range of 2.93 to 3 per share to a range of 3.01 to 3.08 per share.”
A Safe, Reliable, Growing Dividend
National Retail Properties currently pays an annual dividend of $2.12, which equates to a dividend yield of 4.8%.
As I mentioned at the open, NNN has paid a growing dividend for 32 consecutive years going on 33. The company has a five-year dividend growth rate of 3.1%.
In terms of safety, the dividend is well-covered with an AFFO payout ratio of only 66.9%. This is incredible coverage and further adds to the safety of NNN especially if we do dip into a recession.
Investor Takeaway
National Retail Properties is a stable net-lease REIT with a well-diversified portfolio. The company is led by a strong management team that has continued to expand the portfolio along with maintaining a fortress balance sheet over the years, which has contributed to NNN’s competitive advantage within its field.
Shares of NNN appear to be trading at a rather intriguing valuation. Analysts are expecting 2022 AFFO of $3.17, which equates to a Forward P/AFFO multiple of 13.9x. Over the past five years, shares of NNN have traded closer to an AFFO multiple of 17x, suggesting shares are undervalued based on recent history.
FAST Graphs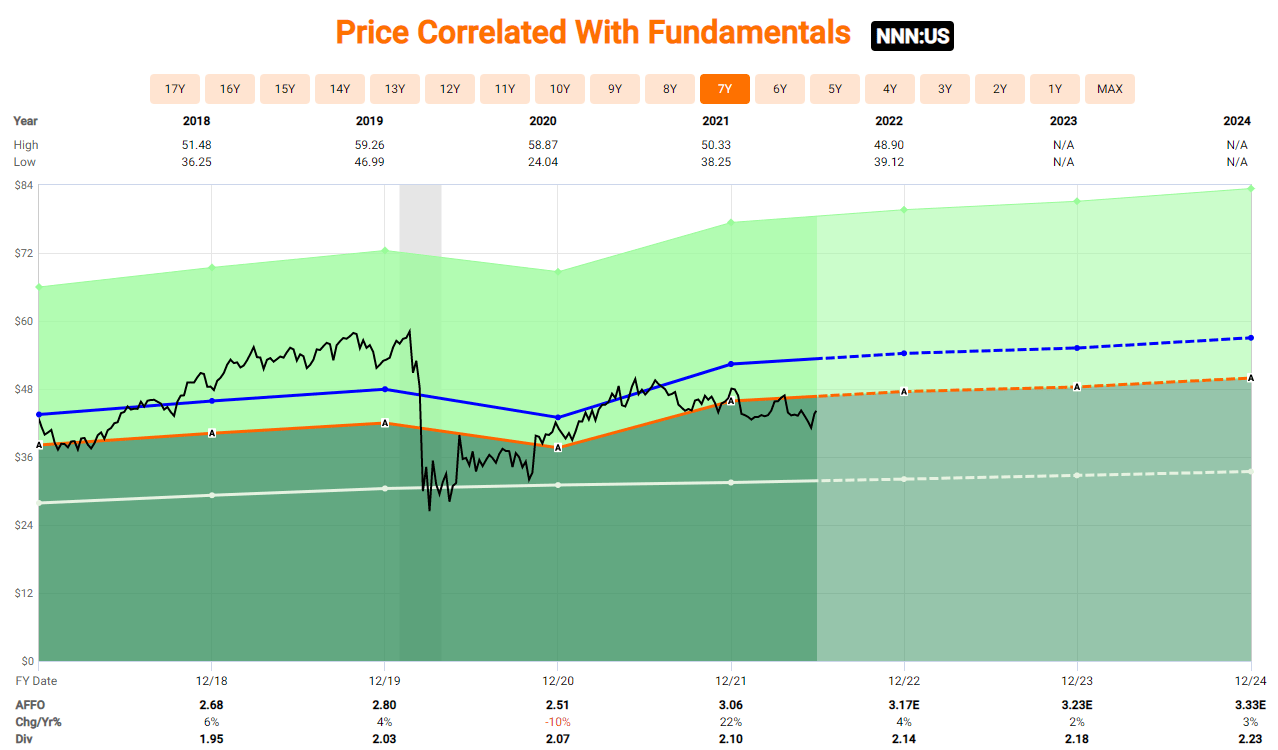
Be the first to comment