

Dilok Klaisataporn
Another EIA weekly oil storage report, and another horrible implied oil demand print. The data is so bad as to make even the most bearish person question the authenticity of the data.
EIA, HFIR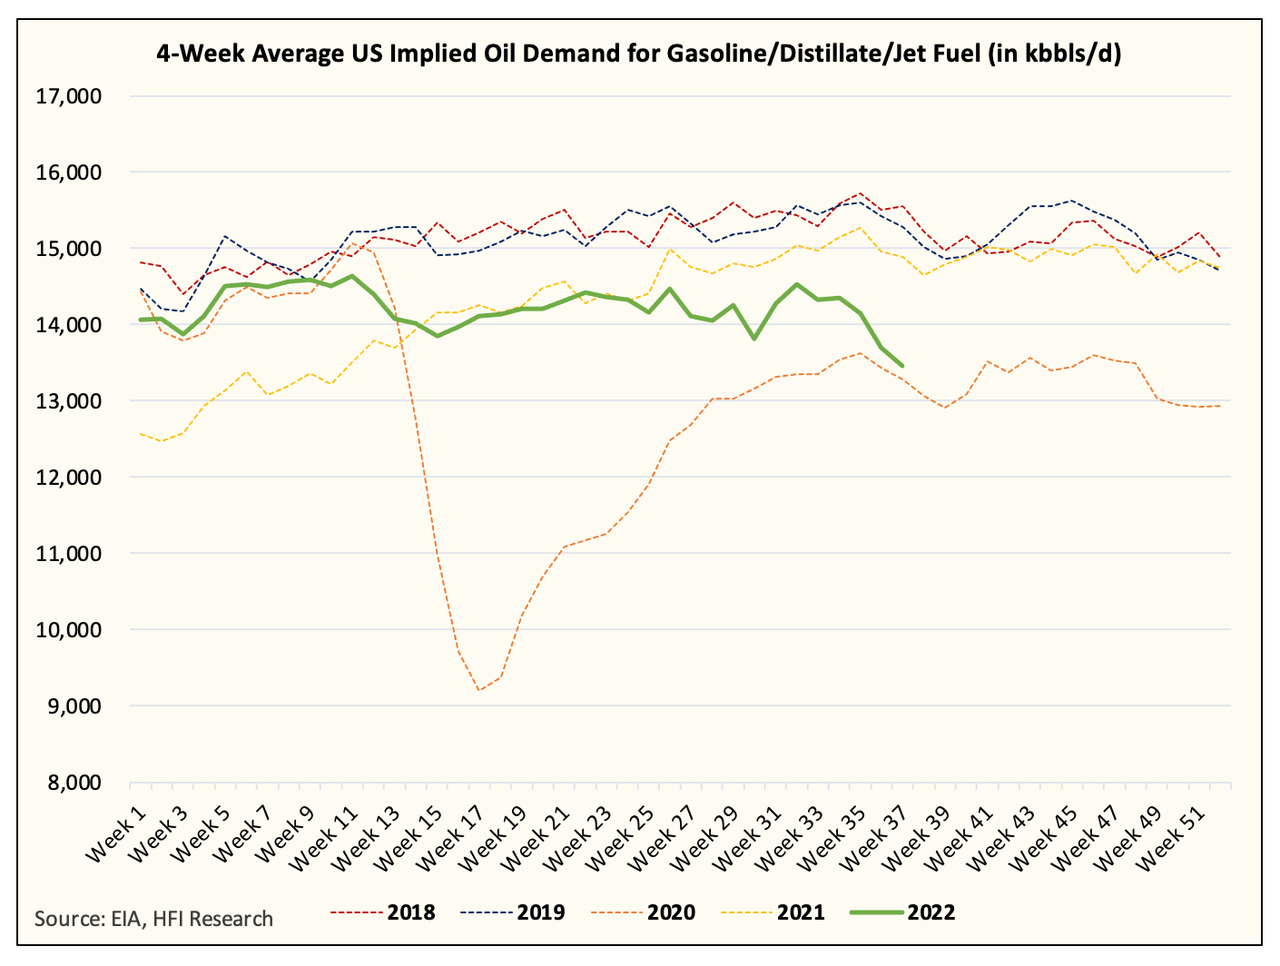
Here is a chart of the 4-week average implied weekly oil demand for gasoline, distillate, and jet fuel. As you can see, EIA’s weekly data is pegging this to be close to 2020.
While we always urge readers to be as empirical as possible, there comes a point when the data is just too glaringly obviously incorrect.
This is a chart of the monthly oil demand data for gasoline, distillate, and jet fuel.
EIA, HFIR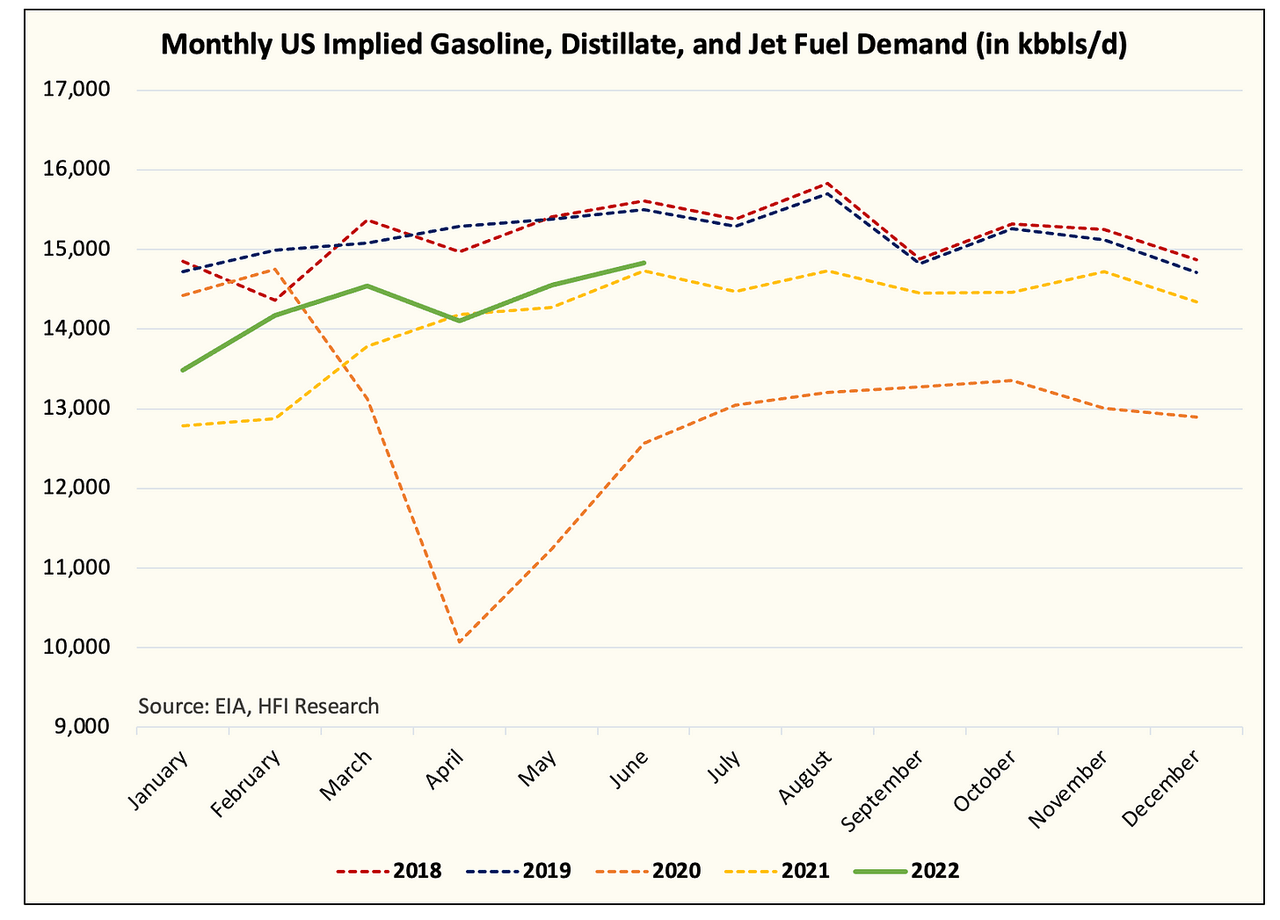
For the time being, we only have data till June 2022, but as you can see, we are nowhere near 2020. In addition, the monthly data is suggesting that we are still above 2021 for the core 3.
Here’s a comparison of the monthly data vs the weekly data YTD:
EIA, HFIR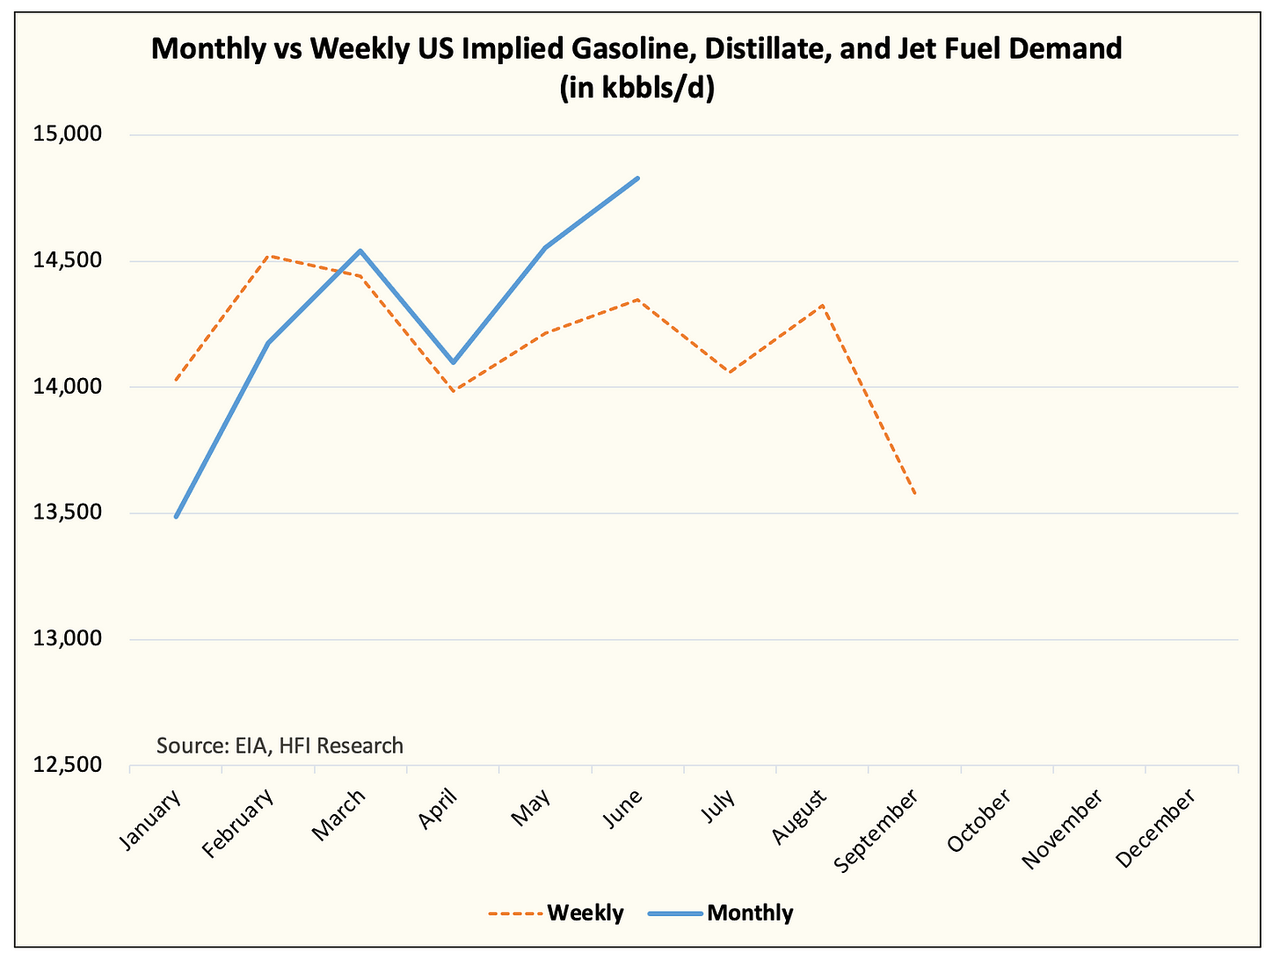
As you can see, the discrepancy became extremely large in June 2022. EIA underestimated the core 3 by ~480k b/d in June.
The same underestimation of demand is occurring in the total implied oil demand chart. We’ve already talked about this in our last article here, so please read it.
EIA, HFIR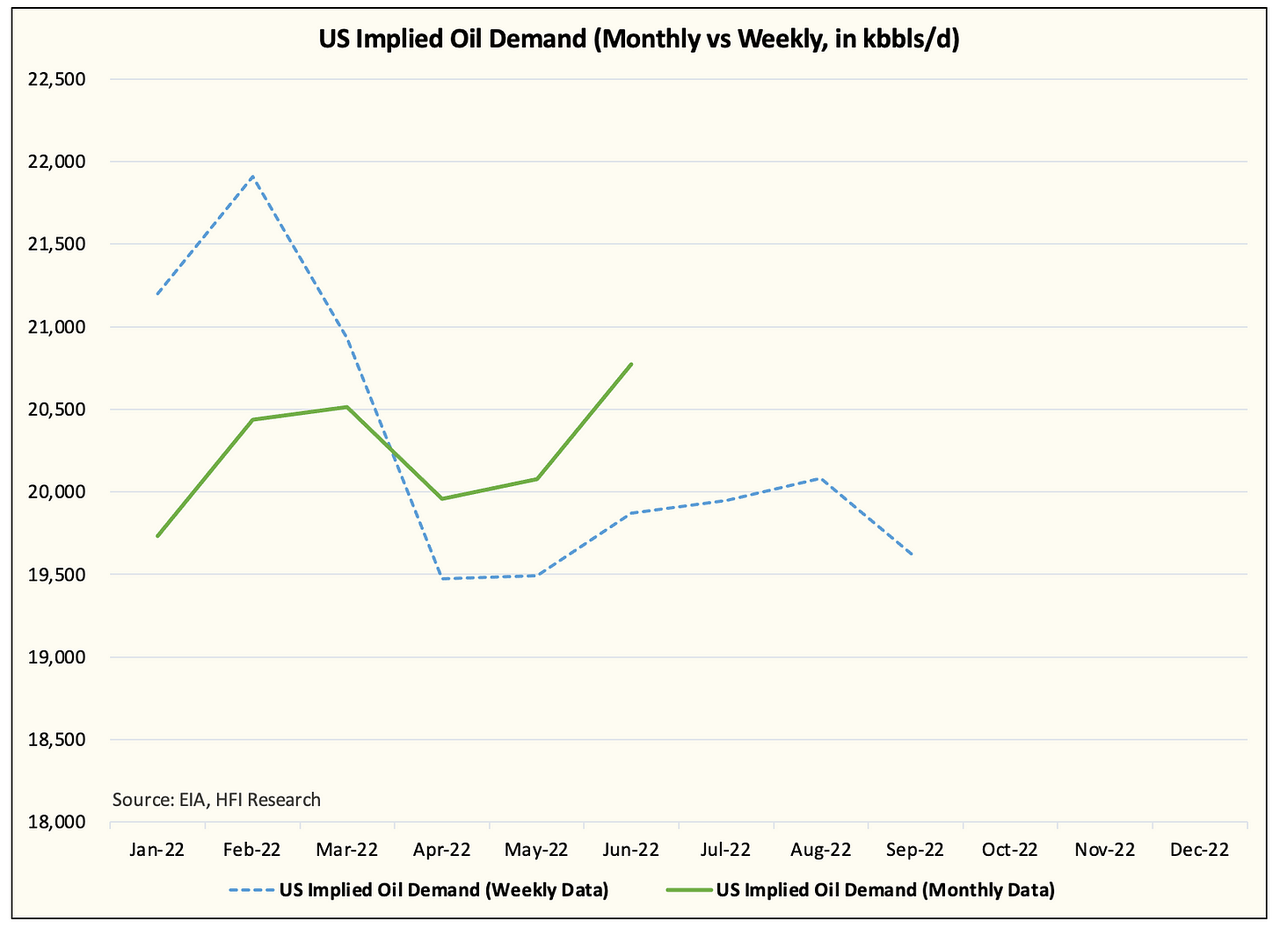
The problem right now is that the weekly data is the only thing the market has to judge the direction of where demand is headed.
EIA, HFIR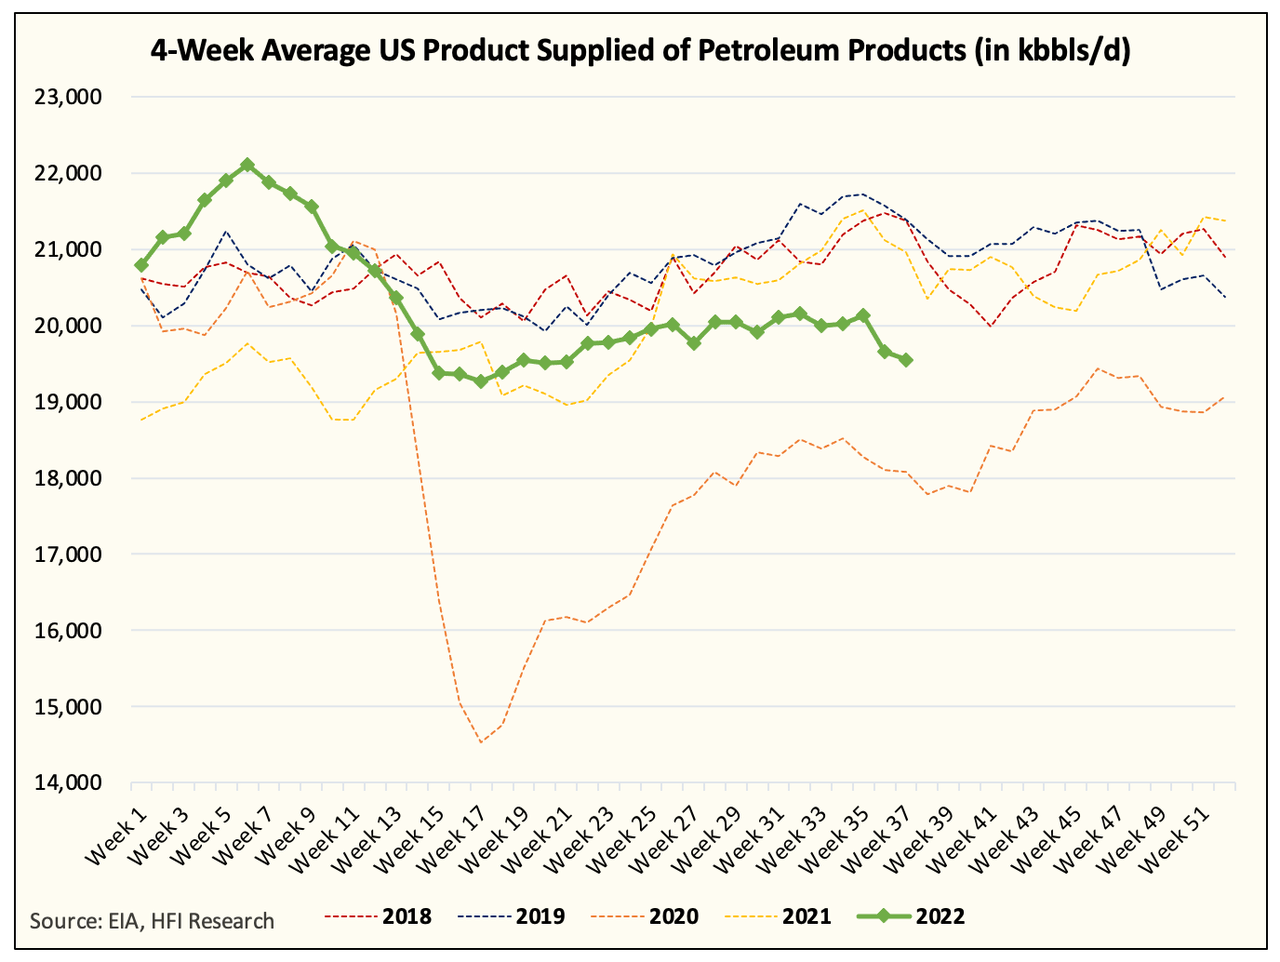
And by looking at this chart above, it is easy to say that we are already in a recession and oil demand is surprising to the downside. But again, we urge you to keep looking at the data.
As we wrote a month ago, the reason why EIA continuously understates the implied oil demand figure is that it is persistently overstating product exports. In addition, the weekly report is far from perfect as it only takes into account ~1,200 respondents of the total survey size (~3,000). As a result, the other ~1,800 could be reporting totally different figures.
EIA, Tim Dallinger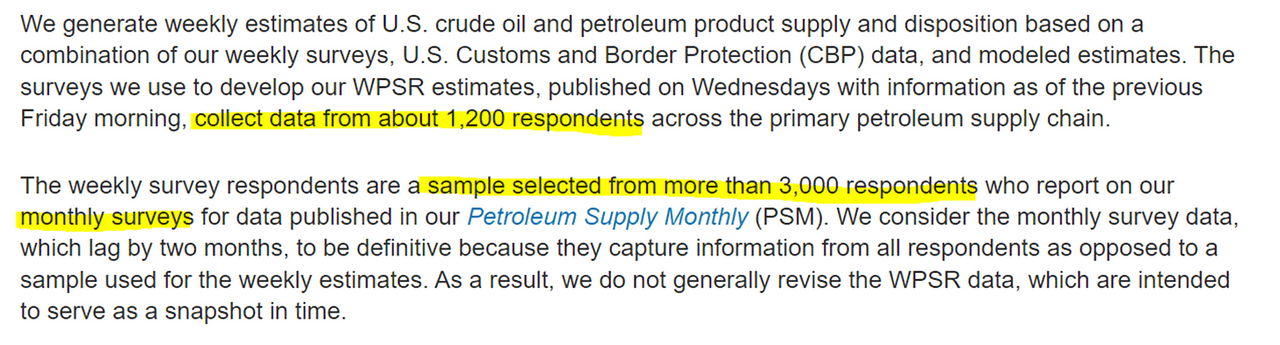
Here’s a comparison of the weekly gasoline, distillate, and jet fuel implied demand figure vs the export data:
EIA, HFIR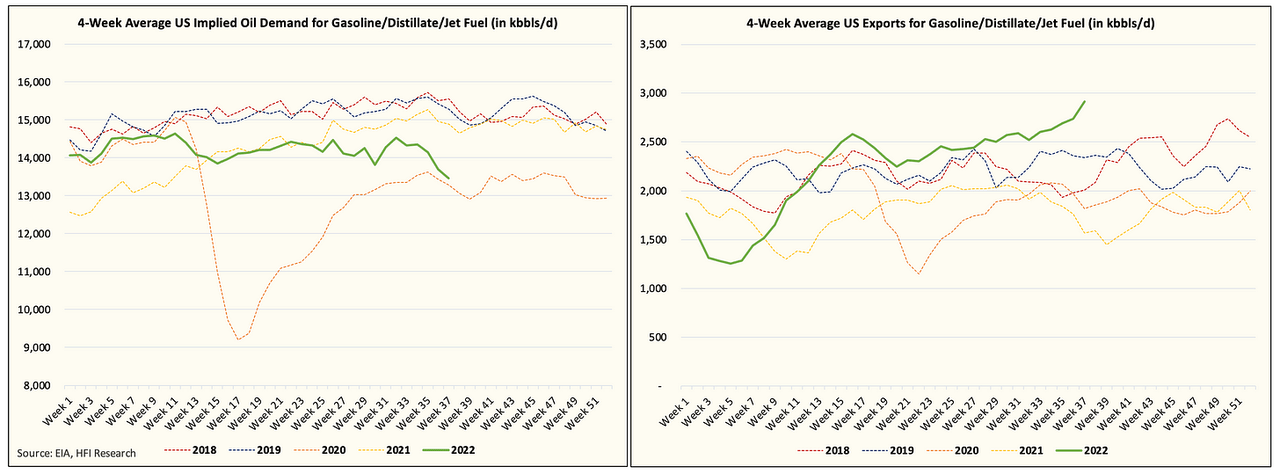
What’s the conclusion here?
It is a fact that EIA’s weekly oil demand figures have been way off year-to-date. This is not a conspiracy theory, it has been validated by the monthly demand data. As a result, it is very likely that when EIA reports July’s oil demand figures next week, it will show an upward revision to the weekly implied oil demand data.
The conclusion you should reach is that the weekly demand figure is far from perfect, and because of the persistent underestimation, demand is actually better than what’s being reported. But is demand doing great? No, but it is nowhere near 2020.
Why is this important for the oil market?
The perception of bad oil demand is weighing on prices and sentiment. Until the market sees more proof that the weekly data is indeed useless when used to gauge demand (likely more monthly data to prove the point), the market will keep using the weekly figures to guide its thinking.
For knowledgeable readers, you can use this edge to take advantage of the market being overly pessimistic. In addition, with OECD demand likely better than reported, implied oil balances toward the end of the year are skewed to the upside.
Be the first to comment