

Scott Olson
Q2 2022 Operating Earnings calculated by S&P Global (SPGI) for the S&P 500 dropped from record highs in Q1 2022 and are now lower than Core Earnings[1] for the first time since Q3 2020.
Stocks remain more expensive than they appear based on SPGI’s Operating Earnings, but the valuation disconnect is diminishing. Despite falling ~13% in 2022, the S&P 500’s current valuation requires more earnings growth than analysts expect, even after Operating Earnings fell in 2Q22.
Operating Earnings Rebound Comes to End in 2Q22
Figure 1 shows Operating Earnings for the S&P 500 understated Core Earnings for the first time since 3Q20.
In 2Q22, Operating Earnings are 1% lower than Core Earnings. Looking at an annual basis, we find that 2Q22 Core Earnings improved at a faster pace, rising 27% year-over-year (YoY), compared to Operating Earnings, which rose 17% YoY.
Figure 1: Trailing Twelve Month Earnings: Core Earnings vs. SPGI Operating Earnings: 4Q19 -2Q22
S&P 550 Operating Earnings vs. Core Earnings through 2Q22 (New Constructs, LLC)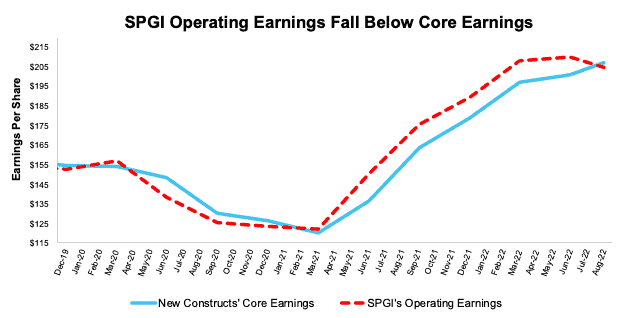
Sources: New Constructs, LLC, company filings, and S&P Global. Note: the most recent period’s data for SPGI’s Operating Earnings are based on consensus estimates for companies with a non-standard fiscal year.
More details on the Core Earnings calculation are available in Appendix I.
SPGI’s Operating Earnings do not exclude the unusual expenses that exaggerated the rebound in 2021 and make profits look worse in Q2 2022 than they are.
S&P 500 Is Still More Expensive than Operating Earnings Imply
At the end of 2Q22, Core Earnings for the S&P 500 reached new highs, surpassing previous records set in each of the past four TTM periods ended 1Q22, 2021, 3Q21, and 2Q21. The drop in Operating Earnings, along with the rebound in the S&P 500 price in 2Q22, has closed the gap between the S&P 500’s valuation measured by price-to-Operating Earnings and price-to-Core Earnings. However, by both measures, the market remains above historical levels. Without a significant improvement in Operating Earnings, which seems unlikely given the current macro environment, the S&P could have a long way to fall before it trades in line with historical levels.
Figure 2: Price-to-Core vs. Price-to-SPGI’s Operating Earnings: TTM as of 12/31/15 – 8/12/22
S&P 500 Valuation Operating Earnings vs. Core Earnings (New Constructs, LLC)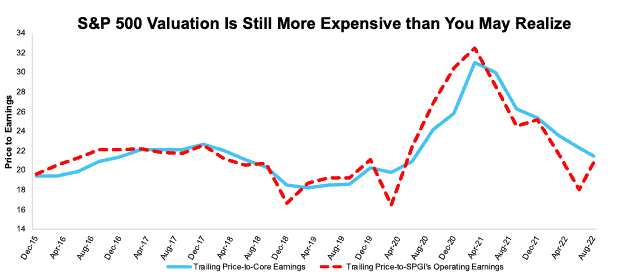
Sources: New Constructs, LLC, company filings, and S&P Global. Note: the most recent period’s data for SPGI’s Operating Earnings incorporates consensus estimates for companies with a non-standard fiscal year. Our Core Earnings P/E ratio is aggregating the TTM results for constituents through 6/30/13 and aggregating four quarters of results for the S&P 500 constituents in each measurement period thereafter. SPGI’s P/E is based on four quarters of aggregated S&P 500 results in each period. More details in Appendix II.
Figure 2 shows the S&P 500 trailing P/E ratios based on Core Earnings and SPGI’s Operating Earnings have fallen significantly from their peaks in March 2021, but P/E based on Operating Earnings significantly rose quarter-over-quarter (QoQ) through August 12, 2022. Prices have come down relative to earnings since valuations peaked in 2021, but the P/E ratio based on Operating Earnings (20.9) remains below the P/E using Core Earnings (21.5).
Core Earnings are Less Volatile and More Reliable
Figure 3 highlights the percentage changes in Core Earnings and SPGI’s Operating Earnings from 2004 to present (through 8/12/22). Flaws in legacy datasets that lead to a failure to capture unusual gains/losses buried in footnotes drive the difference between the two measures of earnings.
Figure 3: Core vs. SPGI’s Operating Earnings Per Share for the S&P 500 – % Change: 2004 – 8/12/22
S&P 500 Operating Earnings & Core Earnings % Change (New Constructs, LLC)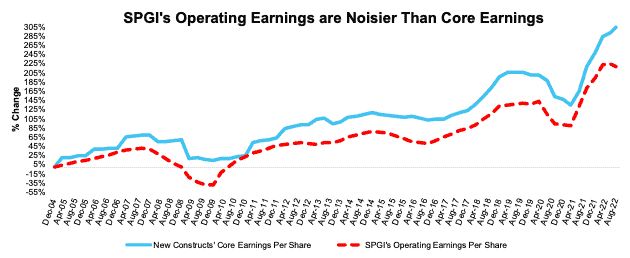
Sources: New Constructs, LLC, company filings, and S&P Global. Note: the most recent period’s data for SPGI’s Operating Earnings incorporates consensus estimates for companies with a non-standard fiscal year. Our Core Earnings analysis is based on aggregated TTM data through 6/30/13, and aggregated quarterly data thereafter for the S&P 500 constituents in each measurement period.
This article originally published on August 29, 2022.
Disclosure: David Trainer, Kyle Guske II, Matt Shuler, and Brian Pellegrini receive no compensation to write about any specific stock, style, or theme.
Appendix I: Core Earnings Methodology
In the figures above, we use the following to calculate Core Earnings:
While we prefer aggregated quarterly numbers, we have examined the potential impacts of the two methodologies and have found no material differences.
Appendix II: P/E Ratio Methodology for Core & SPGI’s Operating Earnings
In Figure 2 above, we calculate the price-to-Core Earnings ratio through 6/30/13 as follows:
- Calculate a TTM earnings yield for every S&P 500 constituent
- Weight the earnings yields by each stock’s respective S&P 500 weight
- Sum the weighted earnings yields and take the inverse (1/Earnings Yield)
We calculate the price-to-Core Earnings ratio for periods post 6/30/13 as follows:
- Calculate a trailing four quarters earnings yield for every S&P 500 constituent
- Weight the earnings yield by each stock’s respective S&P 500 weight
- Sum the weighted earnings yields and take the inverse (1/Earnings Yield)
We use the earnings yield methodology because P/E ratios don’t follow a linear trend. A P/E ratio of 1 is “better” than a P/E ratio of 30, but a P/E ratio of 30 is “better” than a P/E ratio of -15. In other words, aggregating P/E ratios can result in a low multiple due to the inclusion of just a few stocks with negative P/Es.
Using earnings yields solves this problem because a high earnings yield is always “better” than a low earnings yield. There is no conceptual difference when flipping from positive to negative earnings yields, as there is with traditional P/E ratios.
By using quarterly data as soon as it’s available, we better capture the impact of changes to S&P 500 constituents on a quarterly basis. For example, a company could be a constituent in 2Q18, but not in 3Q18. This method captures the continuously changing nature of the S&P 500 constituency.
For all periods in Figure 2, we calculate the price-to-SPGI’s Operating Earnings ratio by summing the preceding 4 quarters of Operating Earnings per share and, then, dividing by the S&P 500 price at the end of each measurement period.
[1] Our Core Earnings research is based on the latest audited financial data, which is the calendar 2Q22 10-Q in most cases. Price data as of 8/12/22. Operating Earnings from S&P Global are based on the same time frame.
Be the first to comment