The Phoenix-based Freeport-McMoRan (NYSE:FCX), the world’s largest publicly-traded copper company, released its third quarter of 2022 results on October 20, 2022.
Note: This article is an update of my preceding article, published on April 27, 2022. I have been following Freeport-McMoRan since Sept. 2019.
1 – Third quarter 2022 results snapshot
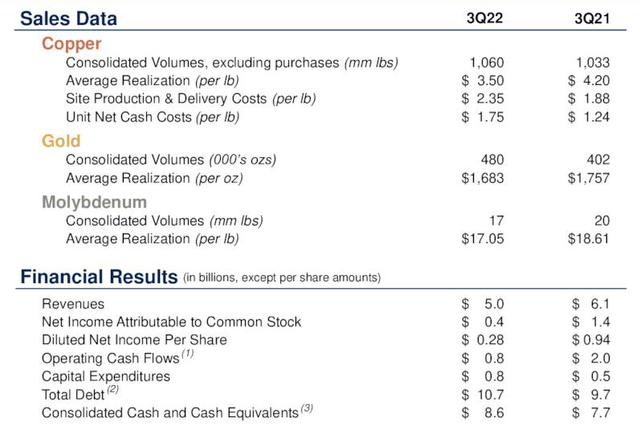
Freeport-McMoRan posted a quarterly profit of $404 million or $0.28 per share, missing analysts’ expectations. The adjusted earnings per share came in at $0.26 per share. Below are the results and production snapshot for 3Q22.
FCX Financial highlights 3Q22 (FCX Presentation)
Revenues fell 17.8% year over year to $5,003 million. Lower commodity prices hurt Freeport-McMoRan results in 3Q22.
Consolidated production totaled 1.056 billion pounds of copper, 448 thousand ounces of gold, and 19 million pounds of Molybdenum in the third quarter of 2022. Unit cash cost per Cu Lbs was $1.75 in 3Q22, up 41% YoY.
Consolidated sales from mines increased 3% year over year to 1,060 million pounds of copper. The company sold 480K ounces of gold and 17 million pounds of Molybdenum in the third quarter.
The macroeconomic situation is driven by the strength of the U.S. dollar, the Fed and central banks tightening, concerns about China dealing with COVID in this property section and then the serious problems in Europe coming out of the Ukraine situation and how that’s affecting energy prices and economic outlook. All those things are realities we have to face up with, but we continue to work to position our company to deal with these situations.
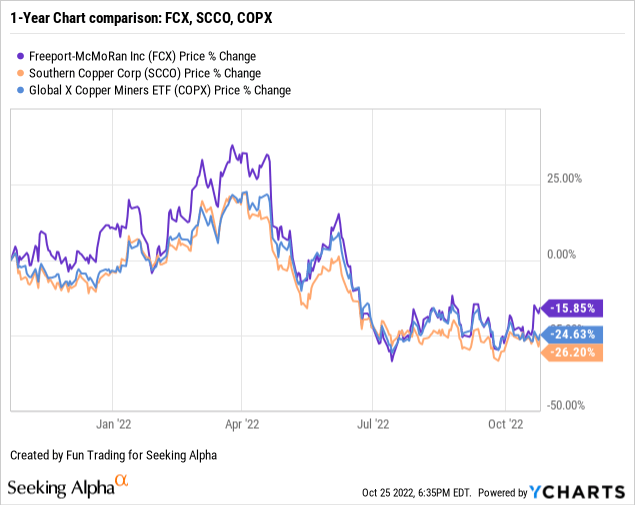
2 – Stock performance
Freeport-McMoRan has slightly outperformed most of its peers. However, the copper industry is facing some headwinds in 2022, and FCX is now down 16% in one year.
The investment thesis has remained the same for many years. If you believe copper as I do, it is essential for the world economy, and investing in FCX long-term makes sense. Thus, I have owned a long-term position for many years and continue to recommend investing in FCX.
Freeport-McMoRan offers the best business model from a long-term investment perspective relative to gold and copper mining. The company is one of the most prolific producers of copper and produces a significant amount of gold.
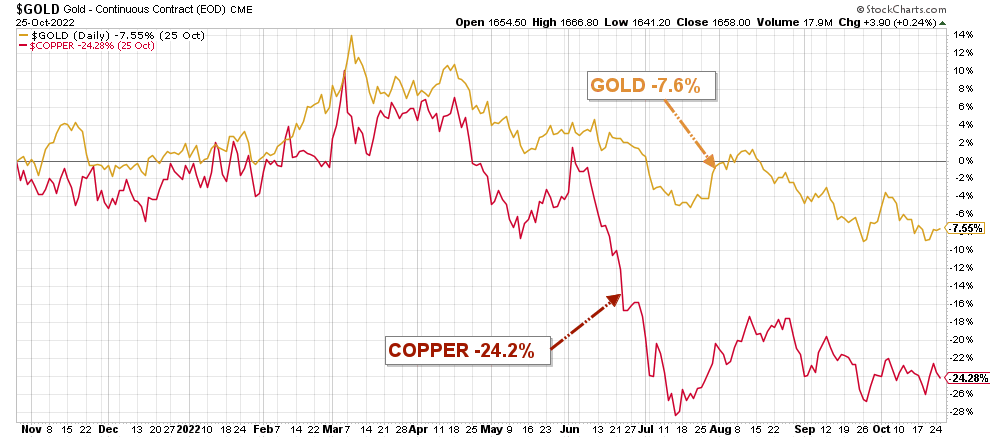
However, in U.S. dollar terms, the prices of most commodities, including copper and gold, have declined from their recent peaks amid concerns of an impending global recession.
FCX: Gold and Copper Comparison 1 Year chart (Fun Trading, StockCharts)
FCX is highly correlated to copper and gold prices. Hence, FCX is dropping at the same pace.
The strategy that I recommend is to trade 40% LIFO of your total position. It will let you keep a core long-term position for higher ground and enjoy a secure dividend which hopefully will be higher in 2023. By trading LIFO, you always sell the most recent purchases, whereas your core long-term is not affected.
Freeport-McMoRan – 3Q22 – Balance Sheet and Trend – The Raw Numbers
Analysis: Revenues, Free Cash Flow, Mineral Reserves, and Copper/Gold/Molybdenum Production
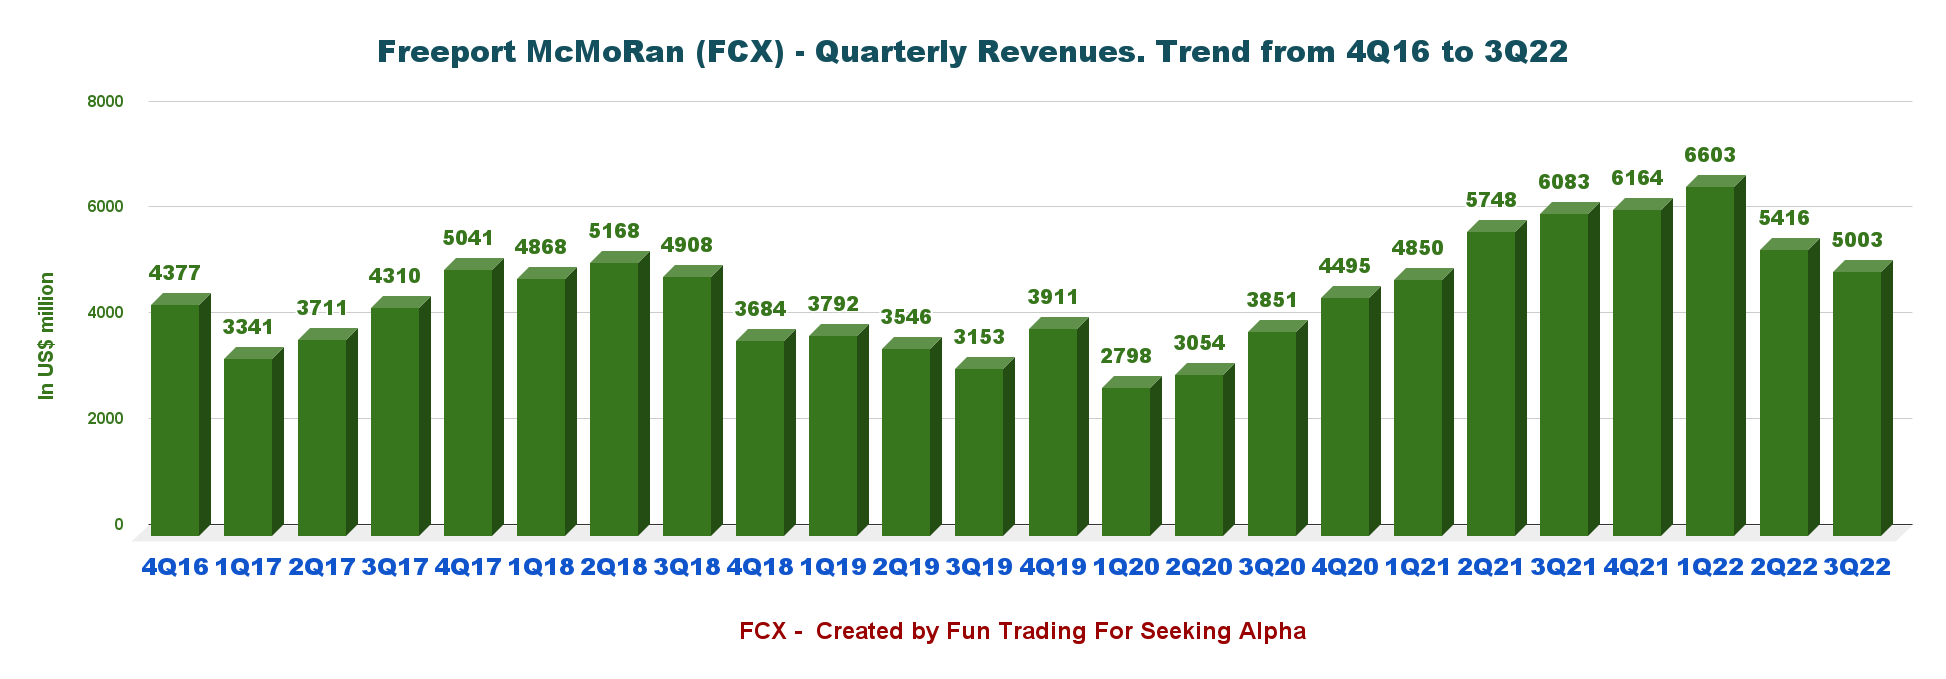
1 – Revenues were $5.00 billion for the third quarter of 2022
FCX Quarterly Revenues history (Fun Trading)
The third quarter of 2022 revenue was $5.003 billion, down 17.8% from the same quarter a year ago and down 7.6% sequentially.
The net income was $404 million or $0.28 per diluted share, compared to $1,399 million or $0.94 per diluted share the same quarter a year ago. The adjusted earnings per share were $0.26 per share. It was a weak quarter due to falling commodity prices.
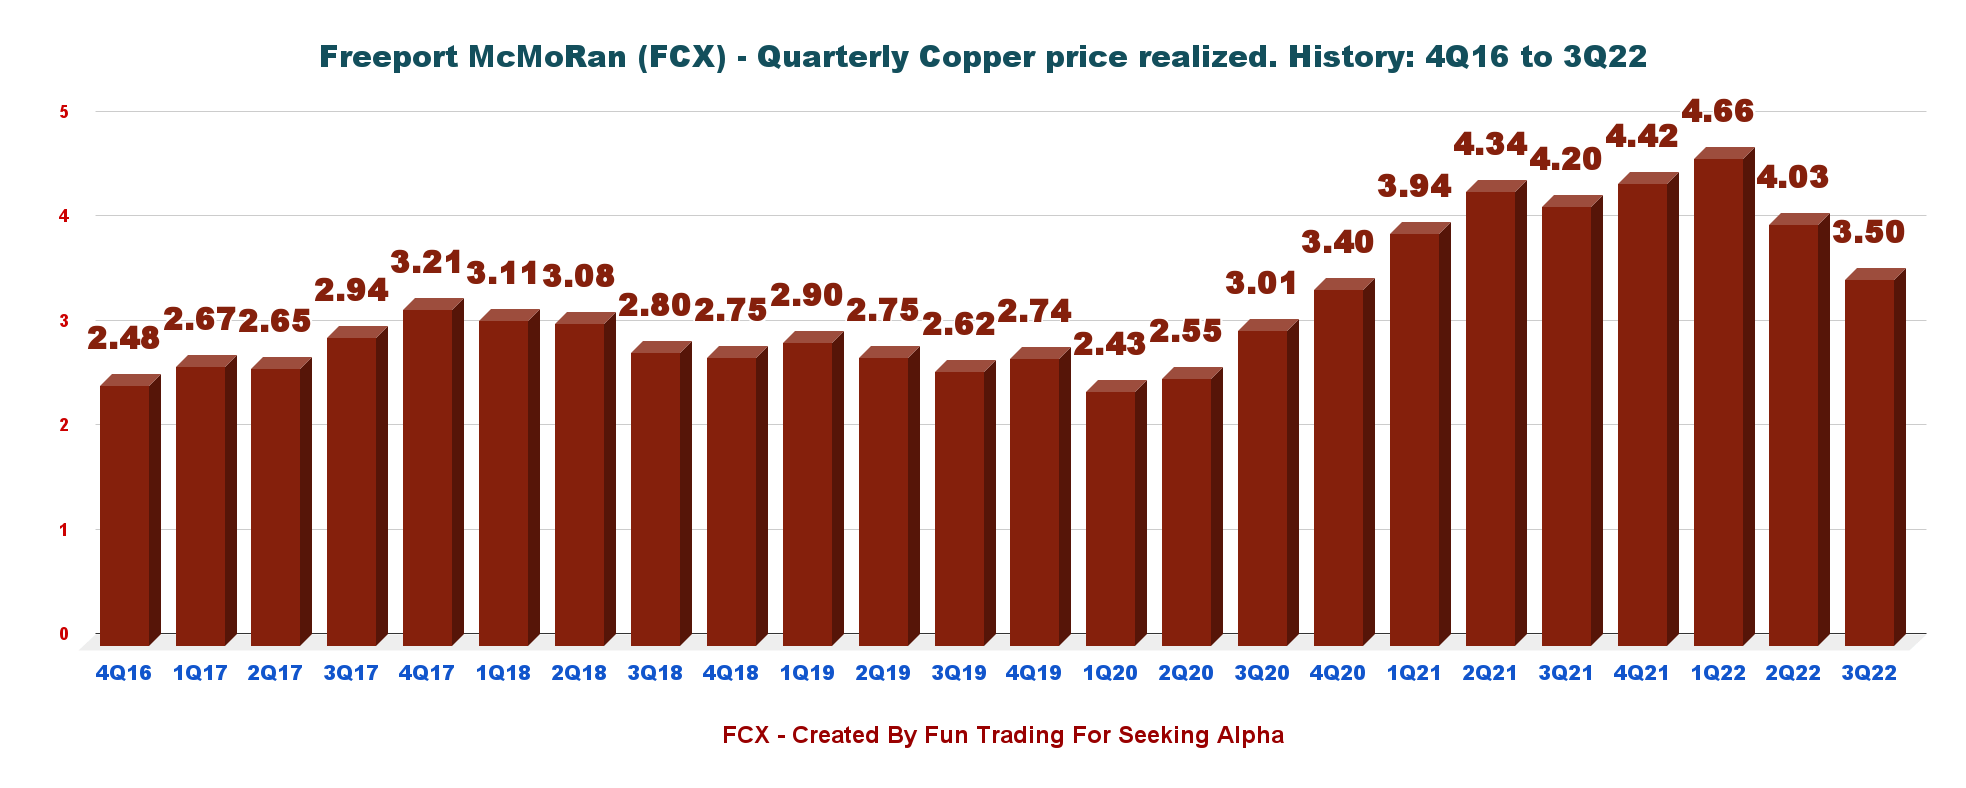
One crucial element is that the copper price has fallen significantly since 1Q22, with an average of 3.50 per pound, down 16.7% year over year.
FCX Quarterly Copper Price History (Fun Trading)
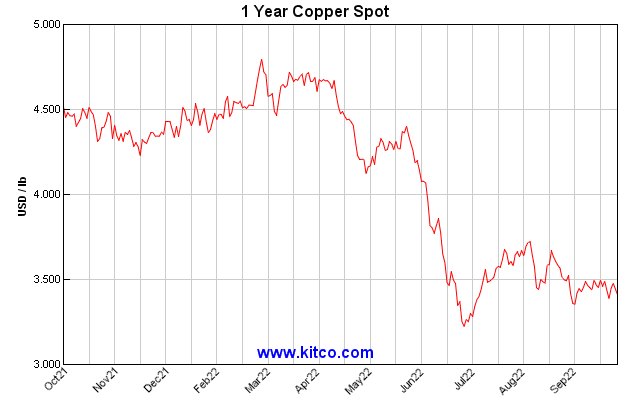
However, the copper price has dropped significantly since the end of April and is now below $3.50 per pound. However, the copper price seems to have found lower support at around $3.40 per pound.
FCX 1-Year Copper Price (KITCO)
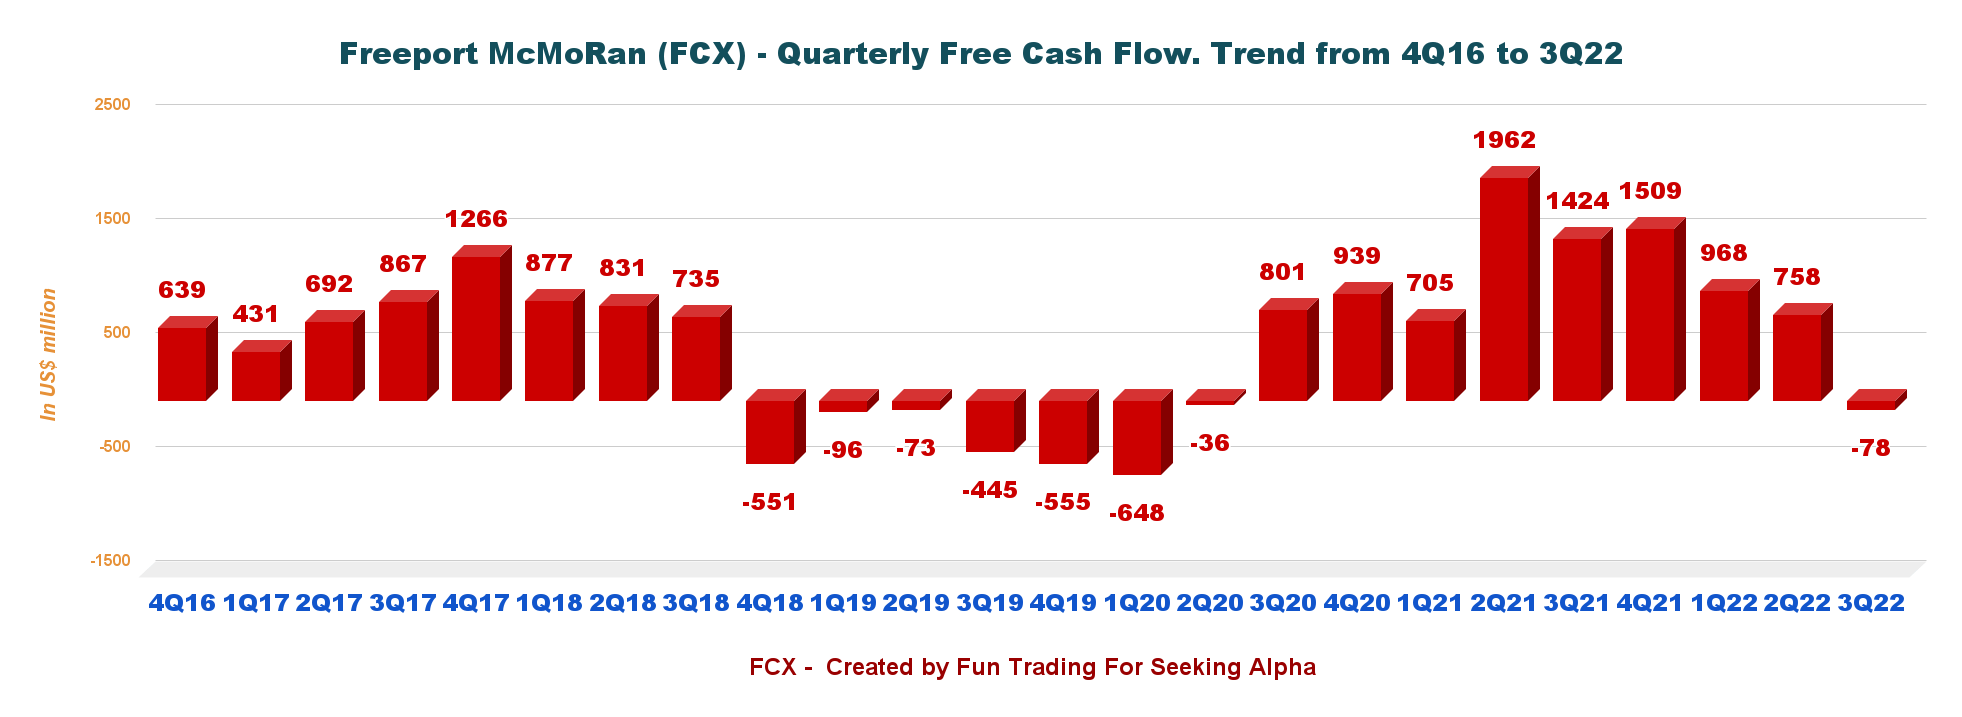
2 – Free cash flow was a loss of $78 million in the third quarter of 2022
FCX Quarterly Free Cash Flow History (Fun Trading)
Note: I calculate the generic free cash flow using the Cash from operating activities minus CapEx.
Trailing 12-month free cash flow was $3,157 million, with a loss of $78 million in 3Q22. Despite a negative free cash flow this quarter, the company maintained a quarterly dividend of $0.15 per share in 3Q22 and continued to buy back shares, which is not what I think is the best use of the Cash.
In July 2022, the Board authorized an increase in the share repurchase program up to $5.0 billion. No shares have been purchased since July 11, 2022. FCX has acquired 47.9 million shares of its common stock for a total cost of $1.8 billion ($38.35 average cost per share) under its share repurchase program, including 35.1 million shares for a total cost of $1.3 billion ($38.36 average cost per share) during 2022.
The total cash cost for the dividend is now $861 million a year based on a quarterly dividend of $0.15 per share (including variable dividend) – representing a dividend yield of 1.89%, which I consider inadequate considering the free cash flow level.
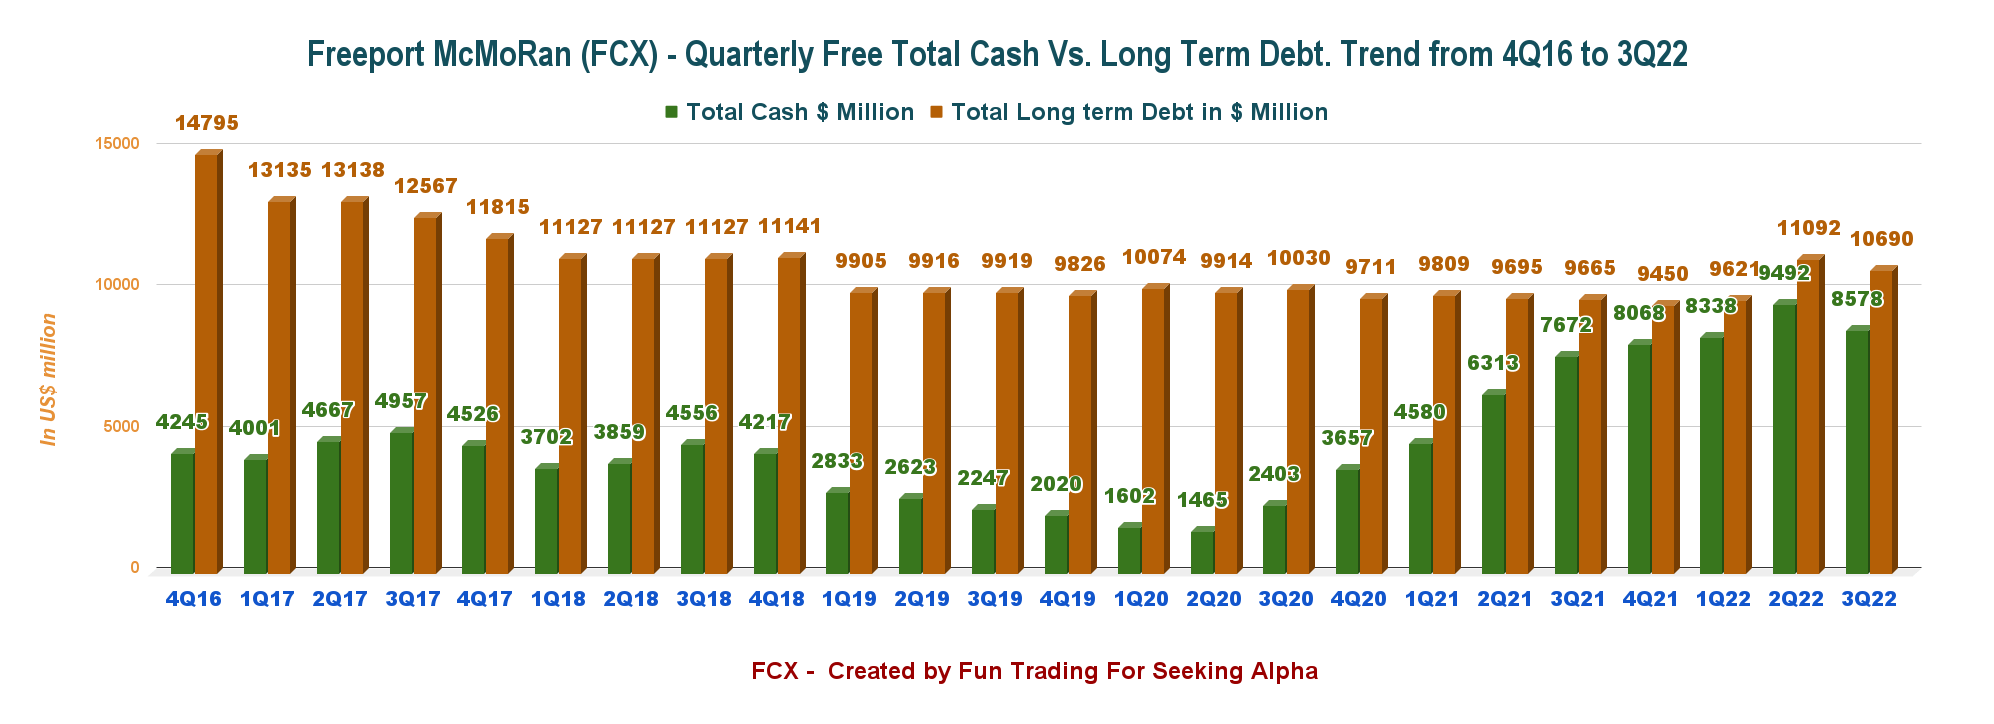
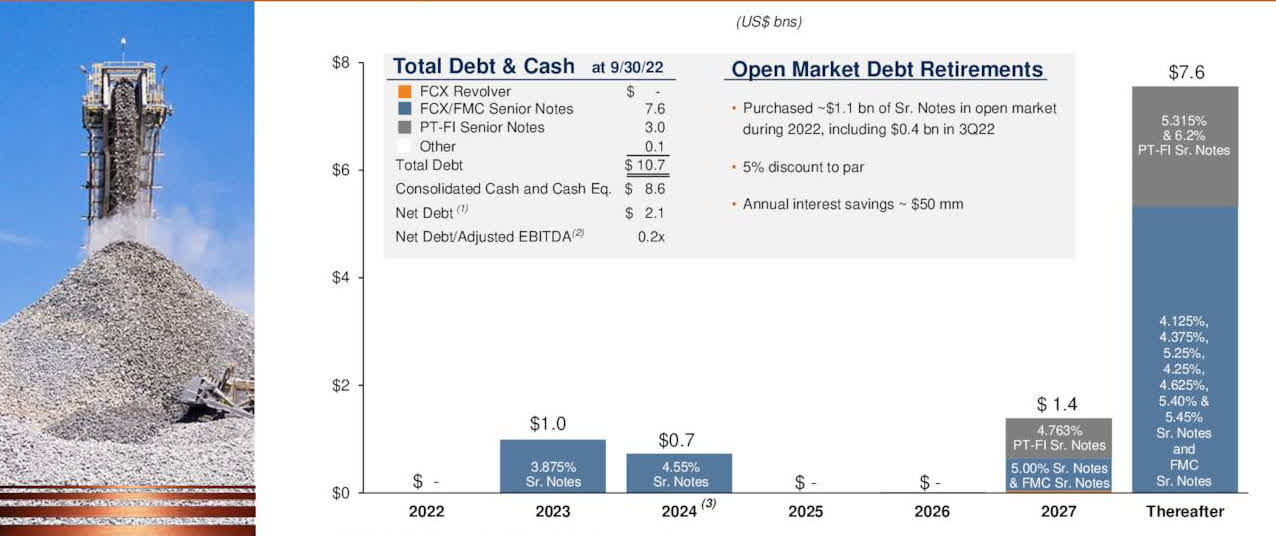
3 – Net debt is down to $2.112 billion in 3Q22
FCX Quarterly Cash Versus Debt History (Fun Trading)
At the end of the third quarter, cash equivalents were $8,578 million, up 11.8% year over year. The company’s long-term debt was $9,658 million (excluding current, which was $1,032 million in 3Q22), up around 10.6% year over year. In the press release:
FCX has purchased approximately $1.1 billion aggregate principal amount of its senior notes in openmarket transactions during 2022 (through October 19, 2022) for a total cost of $1.0 billion (including $402 million aggregate principal amount in third-quarter 2022).Approximately $3.2 billion remains available under FCX’s $5.0 billion share repurchase program. During 2022, 35.1 million shares have been repurchased for $1.3 billion, with no shares repurchased since July 11, 2022. Future share repurchases will be funded with available cash flow pursuant to FCX’s established financial policy.
FCX Balance Sheet 3Q22 (FCX Presentation)
The company’s cash position is solid, as shown in my chart above, and it is vital to start repaying the debt. I consider it a priority for FCX even before any shares buyback that I believe is a pure waste of precious cash. The company repurchased $1.8 billion worth of shares at $38.35 per share, which could have been used to reduce debt.
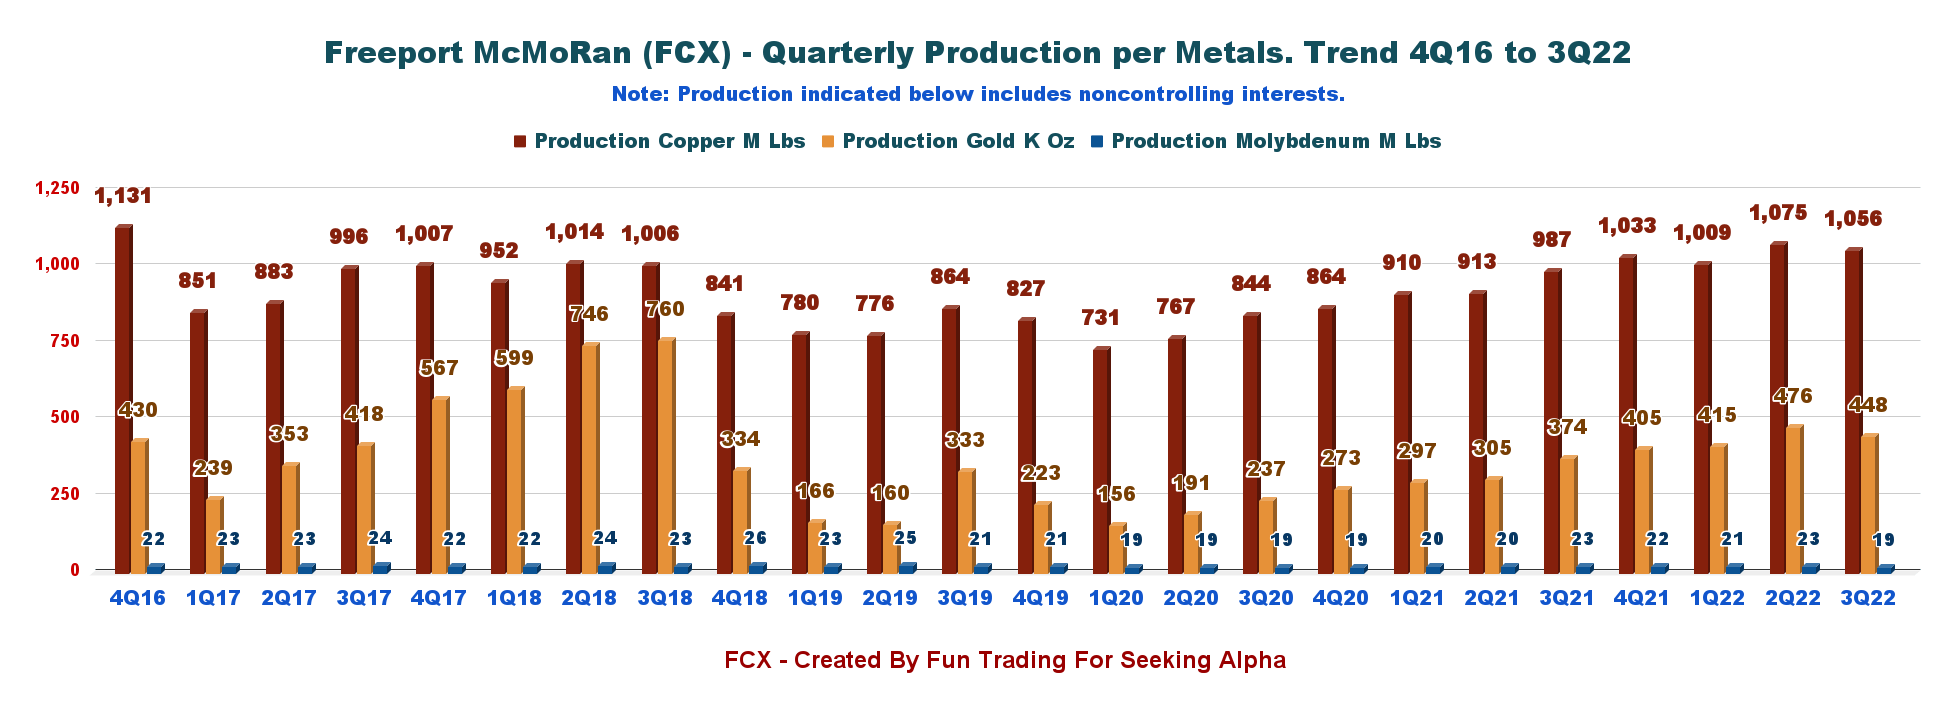
4 – Metal Production Analysis – Copper/Cu, Gold/Au, and Molybdenum/Mo
4.1 Gold and Copper Production
FCX Quarterly Production Per Metal History (Fun Trading)
Production increased 7% to 1,056 million pounds (net 842 million pounds) from 987 million pounds in the same quarter a year ago (see chart above).
The gold production increased to 448K oz (net 365K ounces), and 19 M lbs of Molybdenum were produced (net 17 M lbs).
Below are the copper, gold, and molybdenum prices received by Freeport-McMoRan over the past five quarters:
Price
3Q21
4Q21
1Q22
2Q22
3Q22
Copper price realized – Cu per pound
4.20
4.42
4.66
4.03
3.50
Gold price Realized – Au per ounce
1,757
1,808
1,920
1,827
1,683
Molybdenum price realized – Mo
18.61
19.42
19.30
19.44
17.05
Source: Fun Trading
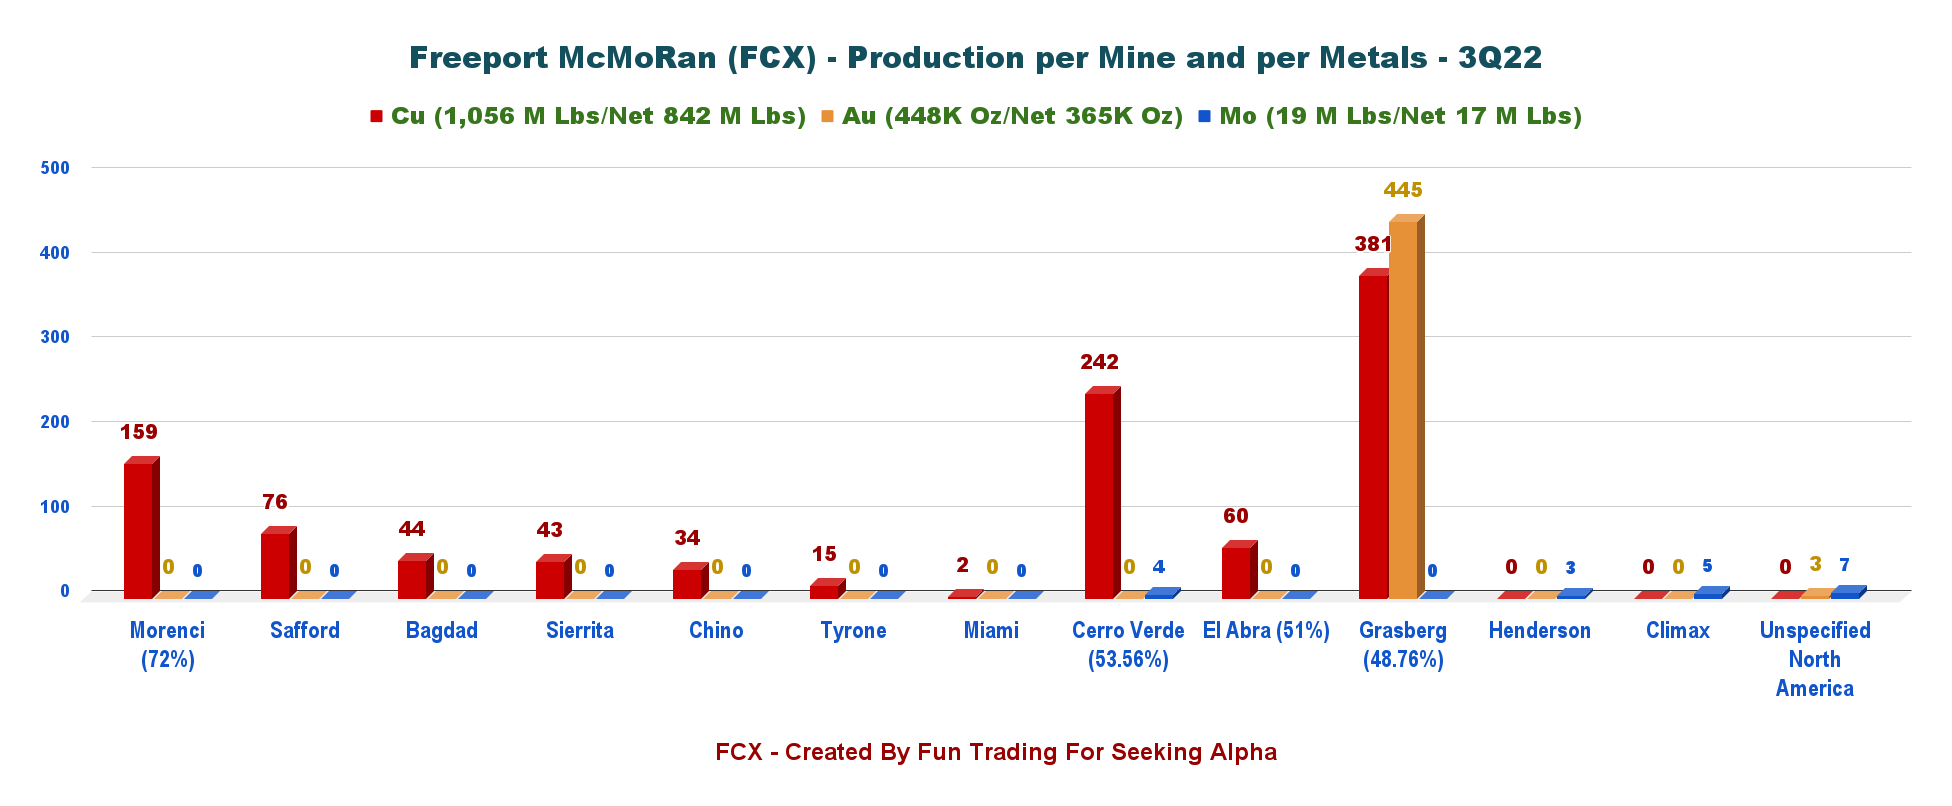
4.2 Production of Copper, Gold, and Molybdenum per mine in 3Q22
FCX Quarterly Production per Metal per Mine 3Q22 (Fun Trading)
Note: The average net cash costs were $1.75 per pound of copper in the third quarter of 2022. Unit net cash costs are expected to average $2.20 per pound of copper in 2022.
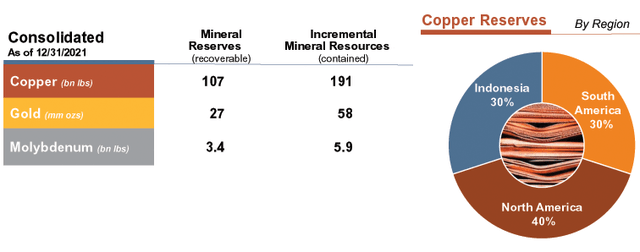
4.3 Reserves situation as of 12/31/2021
FCX Reserve As Of Dec. 2021 (FCF Previous Presentation)
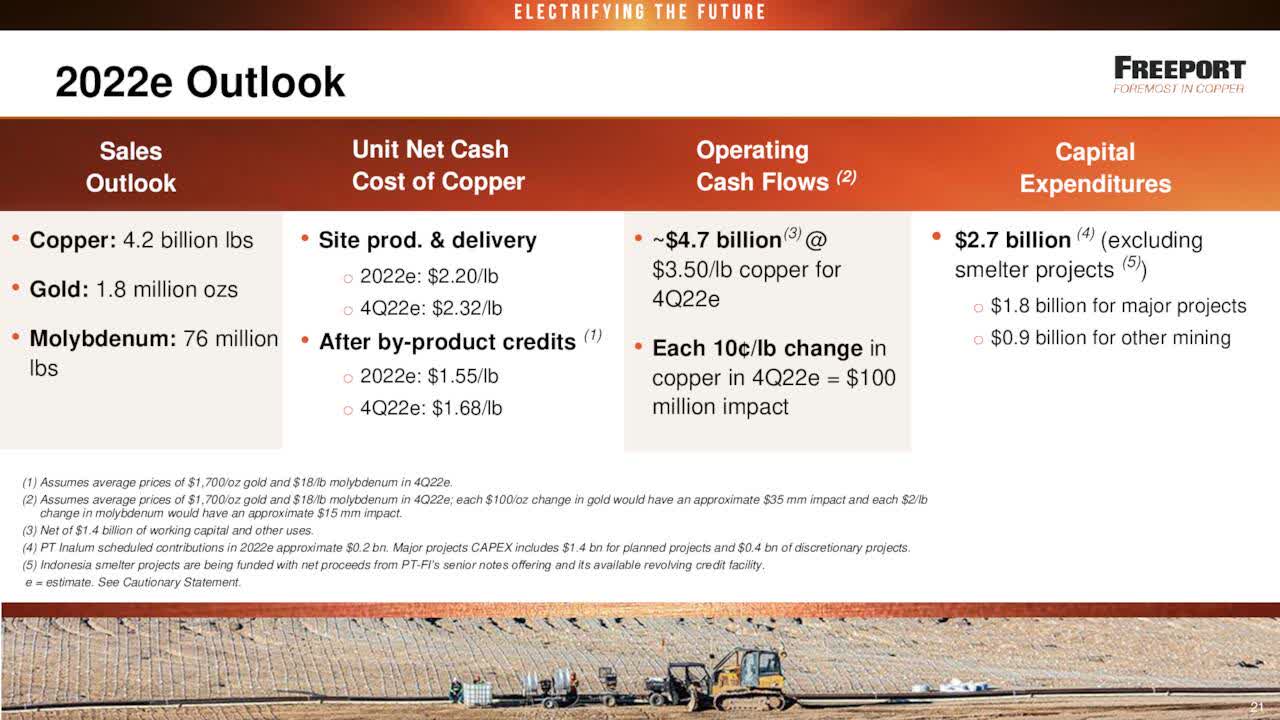
5 – Production outlook for 2022 and other data
Production for 2022 is expected to be 4.2 billion pounds of copper, 1.8 Moz of Gold, and 76 Mlbs of Molybdenum at a unit net cash cost of $2.20 per pound.
CapEx for 2022 is expected to be $2.7 billion.
FCX 2022 Outlook (FCX Presentation)
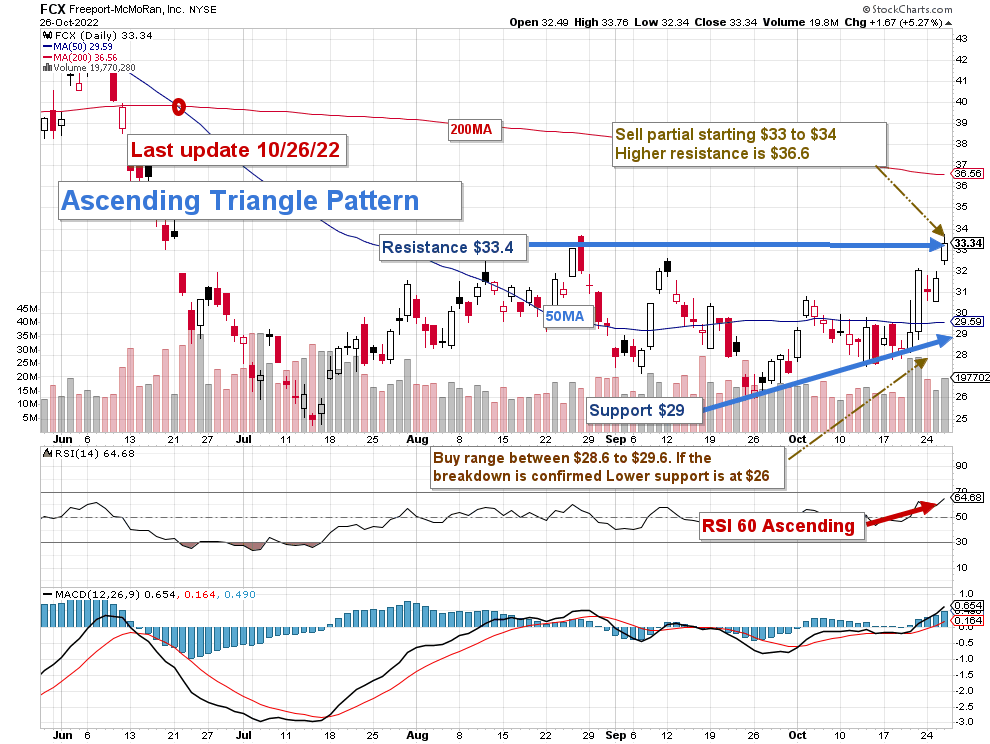
Technical Analysis (short-term) and Commentary
FCX TA Chart Short-Term (Fun Trading, StockCharts)
Note: The chart is adjusted for the dividend.
FCX forms an ascending triangle pattern with a resistance of $33.4 and support at $29.
Ascending triangle patterns are considered continuing patterns which means that FCX may potentially cross the resistance and retest the 200MA at $36.60. However, the market is highly volatile and news-driven, which could significantly alter the technical analysis.
The trading strategy that I recommend is to trade LIFO for about 40% of your FCX position. I suggest selling partially in the range of $33 and $34 and waiting for a retracement below $28.6-$29.6 (50MA) with possible lower support at $26.
The copper price is weak and below $3.50 per pound due to a risk of recession in 2023 or even sooner. The gold price is also struggling and closed today at $1,665 per ounce. The price outlook is negative, assuming that the Fed will probably hike interest by 75 points again on November 2.
Thus, FCX could quickly drop below $29 to its possible lower support, which I see at $26.
Note: The LIFO method is prohibited under International Financial Reporting Standards (IFRS), though it is permitted in the United States by Generally Accepted Accounting Principles (GAAP). Therefore, only US traders can apply this method. Those who cannot trade LIFO can use an alternative by setting two different accounts for the same stock, one for the long term and one for short-term trading.
Warning: The TA chart must be updated frequently to be relevant. It is what I am doing in my stock tracker. The chart above has a possible validity of about a week. Remember, the TA chart is a tool only to help you adopt the right strategy. It is not a way to foresee the future. No one and nothing can.
Author’s note:If you find value in this article and would like to encourage such continued efforts, please click the “Like” button below to vote for support. Thanks.
Please note that foreign exchange and other leveraged trading involves significant risk of loss. It is not suitable for all investors and you should make sure you understand the risks involved, seeking independent advice if necessary.


Be the first to comment