

JHVEPhoto/iStock Editorial via Getty Images
The investment thesis
Over the past 10 years, Thermo Fisher Scientific Inc. (NYSE:TMO) posted a total return of 768.9% (22.6% CAGR), compared to the S&P 500 index (SPY) with a total return of 224.5% (8.4% CAGR). This outperformance is the result of excellent financial execution. While part of this is attributable to organic sales growth, acquisitions have played a major role in the growth trajectory of the company. Management has shown that it masters the M&A approach by acquiring great businesses and successfully integrating them into the core business.
In this article, I will show how acquisitions have fueled Thermo Fisher’s growth story, and why I think that the stock is currently a hold despite the recent fall in share price.
Thermo Fisher in short
It is rather difficult to describe Thermo Fisher in a few sentences as company offers a very, very wide variety of products of services – in the most recent 10-K, seven and a half pages are used to go through all (sub-)segments.
In short, Thermo Fisher provides the essential picks and shovels to customers in biotech and pharmaceutical companies, hospitals, clinical labs, universities, and government agencies. Throughout the past decades, Thermo Fisher has reached an unmatched scale and market reach by continuously expanding its product and service offerings. The total business is separated into four different operating segments, as shown in the following infographic.
Business overview (Thermo Fisher Investor Day 2022)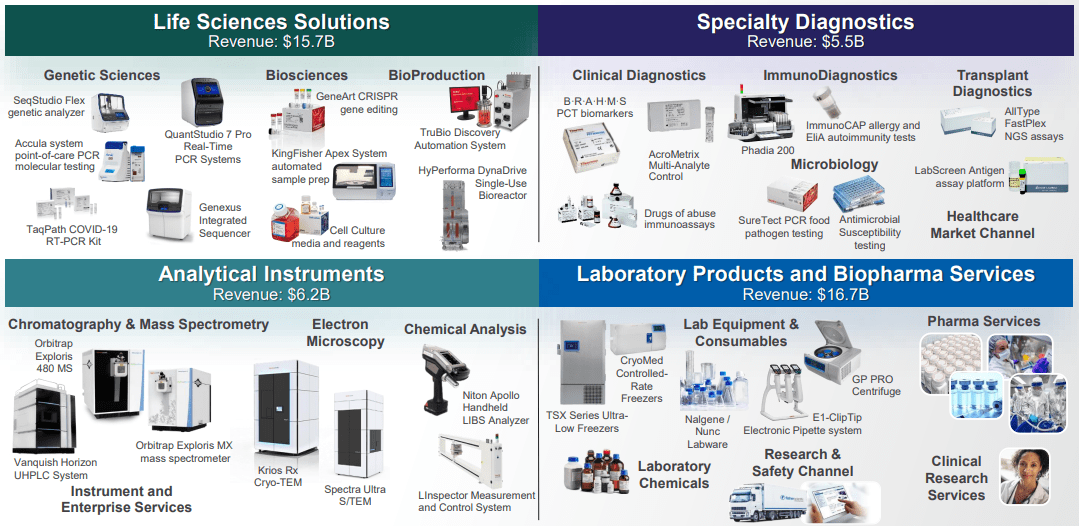
The advantage of having such a broad portfolio is that Thermo Fisher can act as the single vendor for customers by providing products and services for each step of their workflows, from drug discovery to manufacturing. For example, a biopharmaceutical company like Johnson & Johnson (JNJ) can turn to Thermo Fisher for laboratory supplies but also gain access to its clinical trial and drug manufacturing services. If Thermo Fisher can serve more of the customer needs, this deepens the customer relationships. The customer benefits from a more efficient procurement process and they can outsource their drug development and manufacturing, while Thermo Fisher further strengthens its market position.
Another aspect that increases customer stickiness for Thermo Fisher is the regulatory requirement for consistency in the development and production of drugs. Biopharmaceutical companies are required to include the manufacturing site and process in their regulatory filing to get an approval for their drug. If the biopharmaceutical company would switch to another partner, the FDA would have to reauthorize the manufacturing site and process, which could take months.
Interestingly, instruments are not the main revenue driver for Thermo Fisher. During the most recent Investor Day on May 18th, management showed that in Q1 of FY2022 82% of revenue consisted of consumables and services, while only 18% of total revenue was generated by selling instruments. During the development and manufacturing process of a drug, a continuous flow of single-use consumables is required. Because instruments have a lifetime of multiple years, Thermo Fisher is able to lock in enormous recurring revenue streams.
Growing through an M&A-based approach
Thermo Fisher develops many of its technology and products in-house, but acquisitions have also played a major role in the growth of the company. If Thermo Fisher detects a gap in its product and service offerings or opportunities to expand into new markets, it is sometimes most efficient to just acquire a business in that specific area. I think that the M&A strategy is best described by the flywheel effect. After closing a deal, Thermo Fisher integrates the acquired business into its core business, enhancing its financial and operational performance. The acquired business shows margin increases and organic growth, increasing overall company cash flows. These can be used to make more acquisitions, gain further market share, print even larger cash flows, acquire even more business, etc.
As of today, Thermo Fisher has built an impressive track record. According to Morningstar Inc., the company has deployed more than $50 billion on M&A since 2010. Especially during the previous fiscal year, we could observe some aggressive M&A action as it invested $1.4 billion in R&D and nearly $20 billion was used for strategic acquisitions.
M&A spending history
Because acquisitions are such an important aspect of Thermo Fisher’s growth model, I think it is interesting to make an inventory of M&A spending over the past years. The graph below shows that the company has been mainly accumulating business, while only divesting some sub-segments in fiscal year 2014 and 2019. Acquisition spending exceeded $5 billion in fiscal year 2014, 2016, 2017, and the most recent fiscal year 2021.
Overview M&A spending (Graph by the author; data from company filings)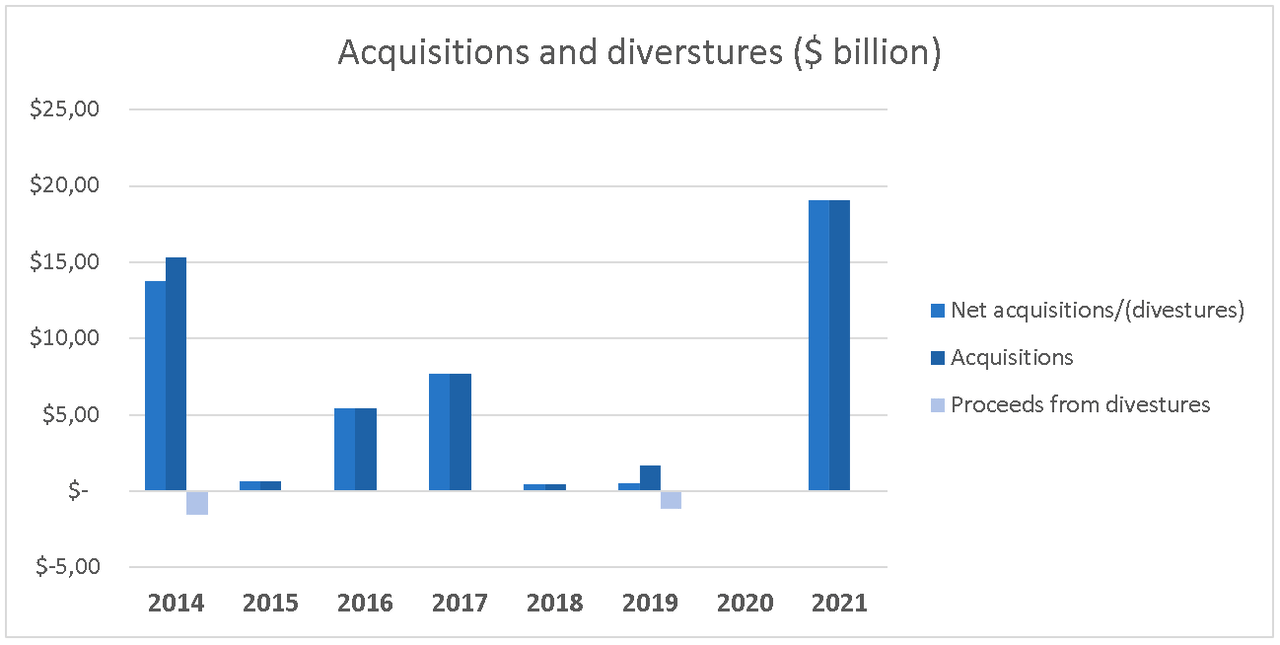
In the next table, I listed the most significant acquisitions with a value above $1.0 billion.
|
Year |
Company name |
Acquisitions value ($ billion) |
Business segment |
|
2014 |
Life Technologies Corporation |
$15.30 billion |
Life Science Solutions |
|
2016 |
Affymetrix, Inc. |
$1.34 billion |
Life Science Solutions |
|
2016 |
FEI Company |
$4.08 billion |
Analytical Instruments |
|
2017 |
Patheon N.V. |
$7.36 billion |
Laboratory Products and Biopharma Services |
|
2019 |
Brammer Bio |
$1.67 billion |
Laboratory Products and Biopharma Services |
|
2021 |
PPD, Inc. |
$15.99 billion |
Laboratory Products and Biopharma Services |
|
2021 |
PeproTech, Inc. |
$1.86 billion |
Life Sciences Solutions |
Source: Company filings
It is remarkable that most larger acquisitions contributed to the Life Science Solutions and Laboratory Products and Biopharma Services business segments. I think that management has been focussing on these segments because they want more presence to the fast-growing pharma & biotech end-markets. During the Investor Day in September 2021, management showed that revenue exposure to the pharma & biotech end-market has grown from 31% in FY2016 to 56% in FY2021. The segments that mainly serve pharmaceutical and biotech companies are the Life Science Solutions and Laboratory Products and Biopharma Services segments (plus partly Analytical Instruments). So, this nicely show how management uses M&A to gain more presence to end-markets that will offer the best growth prospects for the business.
Impact of acquisitions on revenue growth
The following graph shows the impact of acquisitions on total revenue growth for each fiscal year.
Revenue growth breakdown (Graph by the author; data from company filings)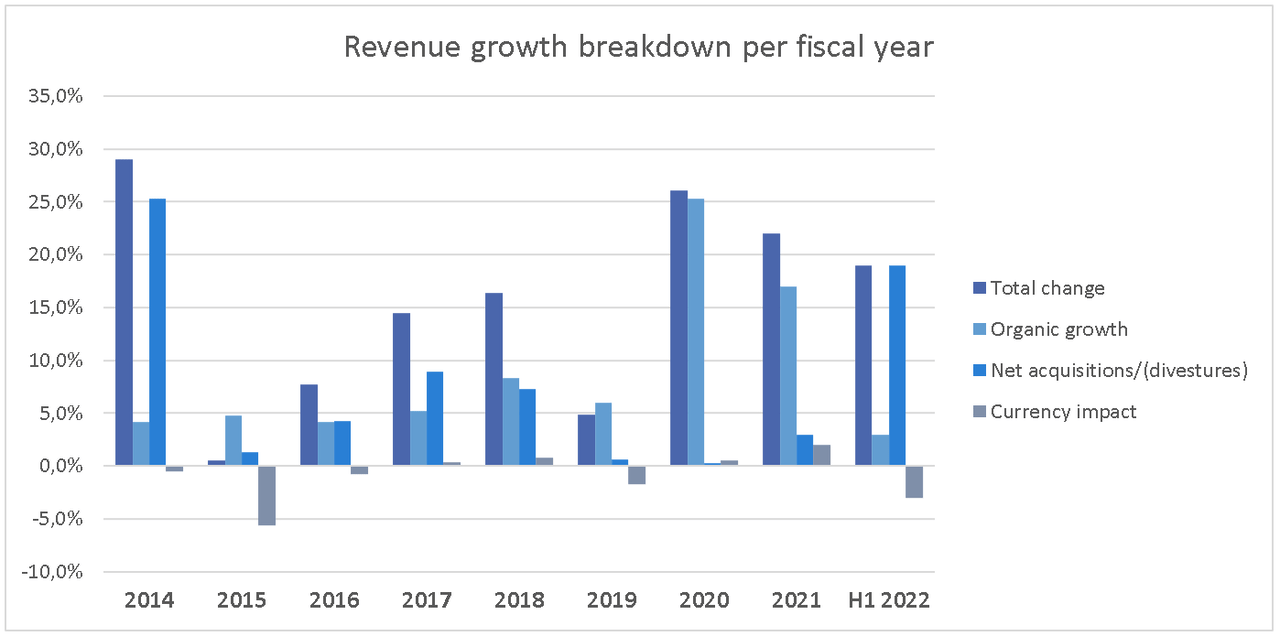
In fiscal years 2014, 2016, 2017, and the first half of 2022, revenue change due to acquisitions has even been larger than growth through core operations.
Revenue change in fiscal years 2019, 2020, and 2021 was mainly attributable to organic growth. During fiscal year 2018 and 2019, only $536.0 million and $1.84 billion were used to acquire new businesses, while during fiscal 2020 Thermo Fisher did not make any acquisitions at all. Moreover, the increases in organic sales during 2020 and 2021 are mainly related to the COVID-19 response ($9.23 billion and $6.63 billion in 2021 and 2020, respectively). I think that COVID-related revenue will eventually subside, which was already visible during H1 of 2022. Sales of products related to COVID-testing were $2.31 billion and $3.87 billion in the first six months of 2022 and 2021, respectively.
All in all, Thermo Fisher’s M&A approach has been essential for growing the overall business. But, we should not forget that ultimately organic growth is the most important measure to assess the success of the company strategy. The years after a business is acquired, revenue growth from that business is recognized as organic growth. Between fiscal year 2014 and 2019, the average organic revenue growth was 5.5%. This is well above the mid-point of the long-term market average, and Thermo Fisher believes that organic growth from the core business is only expected to accelerate.
Overall financials of Thermo Fisher
The combination of organic growth and M&A has resulted in outstanding financial results (see following table). Sales grew with a double-digit CAGR over the considered period, and margin expansion resulted in a CAGR of 18.1% and 22.1% for EBITDA and net income. Despite the aggressive acquisition strategy of the company, management kept the number of shares outstanding roughly flat. Thus, earnings per share have grown alongside net income with a 22.4% CAGR.
Note that COVID has really boosted financial results in fiscal years 2020 and 2021. But even during the 2014-2019 period, revenue has grown with an 8.6% CAGR and earnings per share with a 14.3% CAGR. I think there will be a short-term drop in earnings and margins while the COVID tailwinds subside, but after that the long-term growth story will continue.
|
Fiscal year |
2014 |
2015 |
2016 |
2017 |
2018 |
2019 |
2020 |
2021 |
7Y CAGR |
|
Sales ($ billion) |
$16.9 |
$17.0 |
$18.3 |
$20.9 |
$24.4 |
$25.5 |
$32.2 |
$39.2 |
12.8% |
|
EBITDA ($ billion) |
$4.0 |
$4.2 |
$4.6 |
$5.3 |
$6.1 |
$6.5 |
$10.2 |
$12.8 |
18.1% |
|
EBITDA margin (%) |
23.7% |
24.7% |
25.1% |
25.4% |
25.0% |
25.5% |
31.7% |
32.7% |
|
|
Net income ($ billion) |
$1.9 |
$2.0 |
$2.0 |
$2.2 |
$2.9 |
$3.7 |
$6.4 |
$7.7 |
22.1% |
|
Net margin (%) |
11.2% |
11.8% |
10.9% |
10.5% |
11.9% |
14.5% |
19.8% |
19.6% |
|
|
Shares outstanding (# million) |
402.3 |
402.0 |
397.0 |
398.0 |
406.0 |
403.0 |
399.0 |
397.0 |
-0.2% |
|
EPS ($) |
$4.71 |
$4.93 |
$5.10 |
$5.59 |
$7.24 |
$9.17 |
$15.96 |
$19.46 |
22.4% |
Source: Seeking Alpha Financials
The acquisitions have not impacted the number of shares outstanding, so let’s see how the balance sheet is holding up. The following table shows that during fiscal year 2021, net debt skyrocketed as the company spent a record amount on acquisitions. As a result, net leverage more than doubled. But, I think this will not be an issue for Thermo Fisher. First of all, a 2.4x net leverage ratio is quite low compared to historical numbers. Management is targeting a 2.75x year-end leverage ratio for the 2023-2025 period.
Moreover, the company has shown that it can deleverage very fast if management decreases the acquisition volume. The leverage ratio was 3.7x at the end of fiscal year 2017. I have shown earlier in this article that the acquisition volume was relatively low from 2018 through 2020. As a result, net leverage dropped to 1.1x at the end of fiscal year 2020. S&P Global agrees that the balance sheet looks healthy, as they upgraded Thermo Fisher’s credit rating from a BBB+ to an A- last June.
|
Fiscal year |
2014 |
2015 |
2016 |
2017 |
2018 |
2019 |
2020 |
2021 |
|
Cash & Cash equivalents ($ billion) |
$1.3 |
$0.5 |
$0.8 |
$1.3 |
$2.1 |
$2.4 |
$10.3 |
$4.5 |
|
Short-term & current debt ($ billion) |
$2.2 |
$1.1 |
$1.3 |
$2.1 |
$1.3 |
$0.7 |
$2.6 |
$2.5 |
|
Long term debt ($ billion) |
$12.4 |
$11.4 |
$15.5 |
$19.0 |
$17.8 |
$17.1 |
$19.1 |
$32.1 |
|
Net debt ($ billion) |
$13.3 |
$12.0 |
$16.0 |
$19.8 |
$17.0 |
$15.4 |
$11.4 |
$30.1 |
|
EBITDA ($ billion) |
$4.0 |
$4.2 |
$4.6 |
$5.3 |
$6.1 |
$6.5 |
$10.2 |
$12.8 |
|
Net leverage |
3.3x |
2.9x |
3.5x |
3.7x |
2.8x |
2.4x |
1.1x |
2.4x |
Source: Seeking Alpha Financials
Risks to consider
Before I discuss the valuation of Thermo Fisher stock, I will first mention a few bearish arguments. Investors should always consider the risks that might affect the long-term growth story.
- Reliance on track record of management: While Thermo Fisher has shown healthy organic growth, acquisitions have played a major role in the long-term financial performance. Until now, management has been very successful in its M&A approach. On the other hand, studies have shown that the failure rate of mergers and acquisitions lies somewhere between 70% and 90%. So for future success, investors heavily rely on the experience of Thermo Fisher’s management to continue the execution of the M&A strategy.
- Higher interest rates hurt M&A returns: Over the past decade, Thermo Fisher has been able to finance its acquisitions by borrowing capital against low interest rates. However, with interest rates on the rise, the costs of financing debt increase. As a result, it become harder to generate high returns on acquisitions. Lower returns and/or lower acquisition volumes could decelerate top and bottom line growth.
- The law of large numbers: Especially with the sales boost by COVID, Thermo Fisher has reached a very large revenue base which makes it harder to continue growing at historical rates. This is a very common phenomenon for blue chip companies. Maintaining a certain growth rate requires more and more revenue every year. I think that this risk mainly relates to acquisition-related growth, as it requires more and/or larger deals to materially impact the top and bottom line.
Valuation
To calculate the intrinsic value of a company, I often use the Discounted Cash Flow (or DCF) Analysis. It is very hard to predict the exact future growth rate, so in the following I will start with determining a bandwidth for the free cash flow growth rate.
I will consider the 2014-2019 period as a historical reference to exclude the COVID effects. Free cash flow has grown from $2.2 billion in fiscal 2014 to $4.1 in fiscal 2019 with a 13.0% CAGR. I don’t think that Thermo Fisher will be able to maintain this rate, as the impact of acquisitions on revenue growth will decrease with the increasing revenue base.
During the Investor Day in May 2022, management said that they are aiming at a 7%-9% core business growth rate. This is 300 bps higher than overall market growth, so management thinks that Thermo Fisher will continue to take market share. Besides, they assume 40-50 bps core margin expansion. On top of that, Thermo Fisher will deploy $48 billion of capital between 2023-2025, from which approximately 65% will be used for M&A and 35% for buybacks and dividends. As a result, EPS is expected to grow with a mid-teens CAGR through 2025 and free cash flow is expected to grow in-line with EPS.
With this is mind, I will assume a 9.0%-13.0% free cash flow CAGR bandwidth for the next 10 years. The mid-point growth rate is lower than during the pre-COVID period, and it assumes growth deceleration after 2025. The perpetuity growth rate is typically between historical inflation (2-3%) and historical GDP growth rate (4-5%). I therefore think that 2.5%-4.5% is a suitable range for the perpetuity growth rate. This results in the following inputs:
|
Input |
Value |
|
First year of projections |
2022 |
|
Personal Required rate of Return |
10.0% |
|
Number of shares outstanding |
0.391789 billion |
|
Base free cash flow (fiscal year 2021) |
$6.8 |
|
Net borrowings ($ billion) |
$24.8 billion |
|
Free cash flow growth rate for next 10 years |
9.0% / 10.0% / 11.0% / 12.0% / 13.0% |
|
Growth rate in perpetuity |
2.5% / 3.0% / 3.5% / 4.0% / 4.5% |
The intrinsic values from the DCF analysis are presented for every growth rate combination in the table below. At the mid-point assumptions, I get a fair value of $450.13. Therefore, Thermo Fisher stock is richly valued at the current share price ($505.01). If you think that my assumptions are too conservative and the free cash flow rate growth will remain 13.0%, the stock could be a decent buy. But, I personally like a margin of safety. For me, a stock is attractively valued if it will return at least 10.0% in a conservative scenario. This is however not the case for Thermo Fisher as of now.
DCF analysis with different growth rates (Author)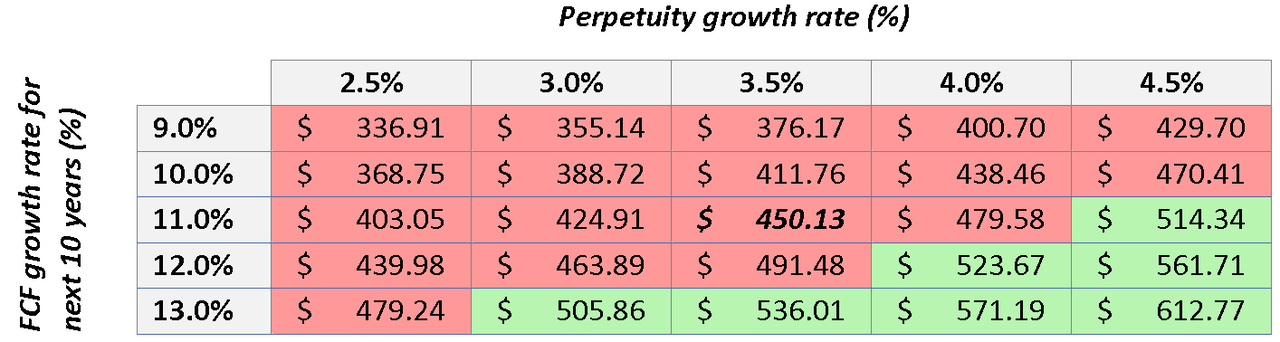
Final thoughts
Thermo Fisher is a great company and an essential player in the healthcare industry. In my opinion, this company does not get the attention it deserves. It carries a wide moat due to its product and service offerings, the regulatory oversights in the industry, and strong customer relationships. As Thermo Fisher continues to expand its portfolio, I think that the moat will continue to grow wider and wider.
The combination of organic growth with an M&A-based strategy has resulted in outstanding financial performance over the past decade. The question is if past performance will continue in the future. I personally think that given the current interest rate situation and increasing revenue base, total growth will slow down. Still, double-digit bottom line growth will be very well possible if management achieves their objectives and continues to build out their M&A track record.
All in all, I think that Thermo Fisher could be an excellent addition to any long-term focused portfolio. However, I advise investors to keep this stock on their watchlists for the time being and wait for better opportunities. If the share price falls towards the mid-$400s, this stock will be a great buy.
Editor’s Note: Thermo Fisher Scientific announced its Q3 2022 earnings pre-market on Oct. 26. An earnings preview can be seen here.
Be the first to comment