

Gold, XAU/USD, US Dollar, Treasury Yields, US Housing Data, Industrial Production – Talking Points:
- Gold prices climbed as the US Dollar and Treasury yields fell
- Disappointing US housing data boosted economic woes ahead
- Outside of BoJ, XAU/USD is eyeing US industrial production
Gold prices climbed over the past 24 hours, extending gains ever since this week’s Federal Reserve rate decision. On the chart below, the anti-fiat yellow metal can be seen rising as the US Dollar and 2-year Treasury yields weakened throughout Thursday’s trading session. When the latter two move in the same direction, whether it is up or down, it tends to produce the most conviction for XAU/USD.
The DXY Dollar Index tumbled one percent on Thursday, the most since May. A closer look reveals that the markets pared back Federal Reserve rate hike expectations in one year. This can be seen by looking at Federal Funds Futures, with the implied yield of the generic 12th contract falling to 3.73% from 4% earlier in the week. That might explain the drop in the 2-year Treasury yield.
This followed relatively disappointing economic data from the US. Housing starts and permits gained 1.55 and 1.69 million in May versus 1.69m and 1.77m expected respectively. Initial jobless claims also clocked in at 229k against the 217k consensus. Meanwhile, the probability of a recession in the US in 1 year is on the rise. Data from Bloomberg has odds of one at 31.5%, which is up from 20% earlier this week.
Heading into the weekend, the economic docket is looking quieter. Outside of the Bank of Japan today, US industrial production is due at 13:15 GMT. A weakening to 0.4% m/m is seen from 1.1% prior. A much softer print could continue compounding rising economic woes. Gold could gain if markets accelerate pricing out rate hikes in one year, but the broader fundamental picture remains tough for XAU/USD as central banks continue tightening policy around the world.
Fundamental Divers Over the Past 24 Hours
Chart Created Using TradingView
Gold Technical Analysis
On the daily chart, gold remains in a consolidative state ever since XAU/USD seemingly established support between 1787 and 1810. A falling trendline from March seems to have emerged. Prices are nearing this falling line. Immediate resistance also seems to be the 1869 – 1879 range. Gold’s next big move could occur after a breakout outside of these boundaries. Until then, the road ahead may remain choppy.
XAU/USD Daily Chart
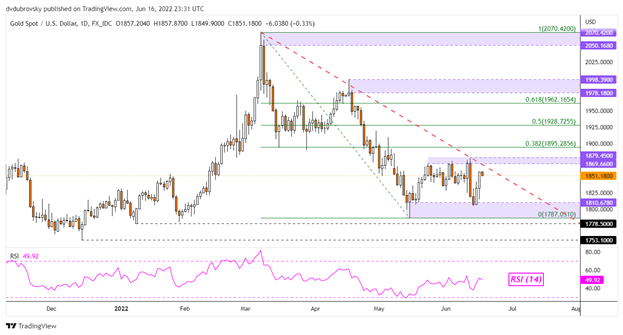
Chart Created Using TradingView
–— Written by Daniel Dubrovsky, Strategist for DailyFX.com
To contact Daniel, use the comments section below or @ddubrovskyFX on Twitter
Be the first to comment