

ismagilov/iStock via Getty Images
In the ever-increasingly difficult macroeconomic environment that we are finding ourselves in, generating positive stock market returns does seem to have become a far-stretching goal for many. Ongoing conflicts, surging inflation, wrecked supply chains, and upcoming rate hikes have created a difficult-to-get-out liquidity crunch that is sucking the market dry.
At the peak of fear and panic in the market, we present to you our alternative trading strategy that is built around one of the most interesting phenomena in stock market history, the infamous retail investing forum WallStreetBets. By reverse engineering the CNN’s Fear and Greed index, which is measuring the general investor sentiment, we have created a mechanism that allowed us to track the sentiment among the investors in the WSB subreddit. In today’s article, we will explain how monitoring the spread between the two sentiments can allow for creation of alternative quantitative strategies based on the most often discussed stock picks within the subreddit, and how that approach has a potential to deliver alpha on the market.
Measuring the WallStreetBets Sentiment
The world-famous CNN’s fear and greed index has been measuring overall market sentiment for years. The theory behind the concept is basing itself on the logic that excessive fear usually tends to drive down share prices, and that too much greed tends to cause the opposite effect, injecting liquidity into the markets. By reverse-engineering the design, we have applied the same philosophy to the infamous retail investing forum, creating a fear and greed index measuring the retail investor subreddit sentiment towards the stock market.
WallStreetBets & CNN Fear and Greed Index (Quiver Quantitative)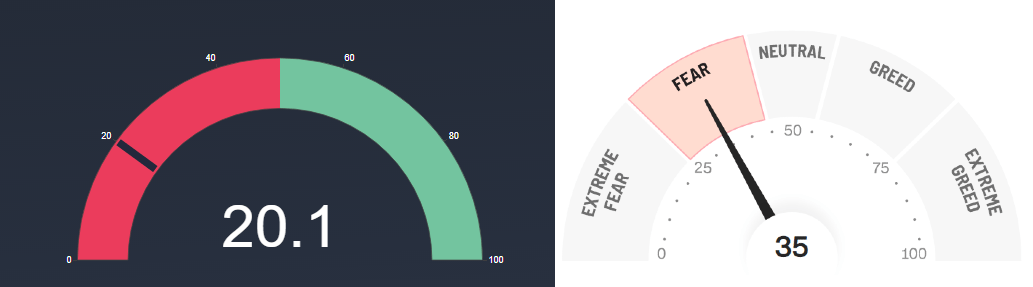
The WallStreetBets fear and greed index shows us that we are currently undoubtfully in the deep fear territory. The index fell off the cliff in late January of this year, racing downwards and finally bottoming up at the 7.7 mark at the end of May, with sentiment only slightly recovering to the 20.1 mark we have on record as of today.
Historically speaking, as far back as the index is measured, we had only two instances of higher fear sentiment being recorded. The first time occurred at the end of December 2018 when the sentiment meter hit rock bottom, while the second time occurred during the height of the pandemic when the sentiment meter briefly touched the 4.5 mark.
CNN and WSB Index Compared (Quiver Quantitative)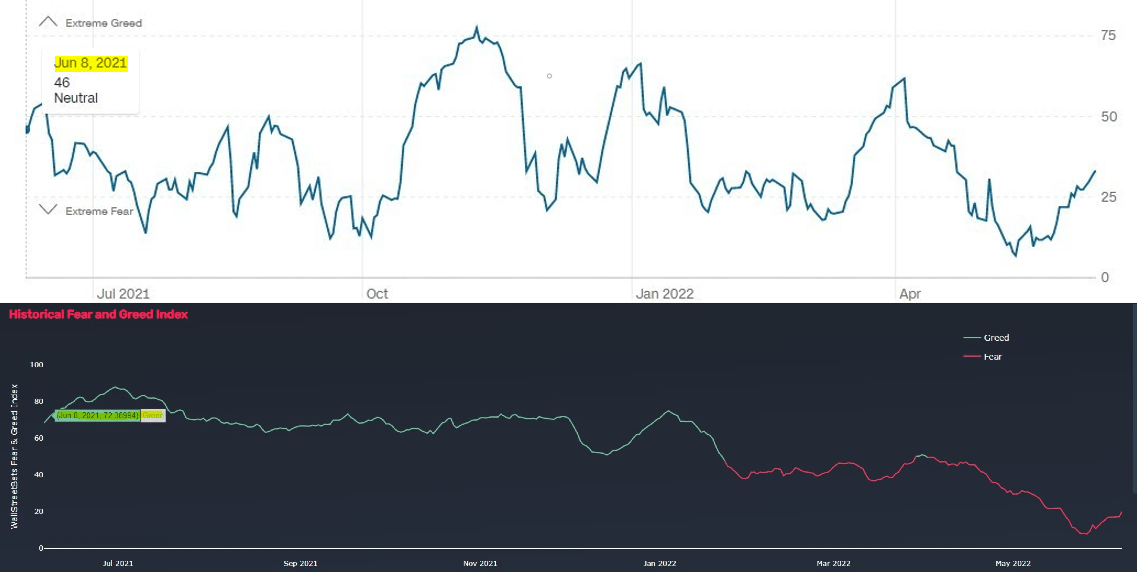
Further to the point, we believe that cross-comparing and referencing the two fear and greed indexes can also yield very interesting results. Historical data has clearly shown the tendency of WallStreetBets to usually be more greedy during the bullish periods while having the opposite effect during the bearish periods. With CNN’s fear and greed index set at the 34-point mark, there is a clear difference between the two indexes, possibly indicating that the interest for “meme” stocks is at all-time lows, with liquidity being sucked out of them.
We also utilize our datasets to keep track of momentum swings in popularity of particular individual stocks at the famous forum, which represents a far more interesting approach to the data. Throughout the years, we have kept daily data on the number of particular stock mentions and the sentiment within the subreddit discussions. While WallStreetBets remains best known for their borderline outlandish stock picks, having been mainly focused on what is often referred to as “meme stocks”, the most discussed stock ideas on the retail investing forum might come off as a surprise for many. Here is our data on the most popular WallStreetBets stocks of 2022:
GameStop (GME)
-
QQ’s WSB Ranking: #1
-
WallStreetBets Total Yearly Mentions: 34,973
-
WallStreetBets Average Daily Mentions: 221
-
Percentage of Total Mentions: 11.77%
- YTD Performance: -4.15%
GameStop QQ Report (Quiver Quantitative)
Tesla (TSLA)
-
QQ’s WSB Ranking: #2
-
WallStreetBets Total Yearly Mentions: 33,365
-
WallStreetBets Average Daily Mentions: 211
-
Percentage of Total Mentions: 11.23%
- YTD Performance: -40.27%
Tesla QQ Report (Quiver Quantitative)
Meta (META)
-
QQ’s WSB Ranking: #3
-
WallStreetBets Total Yearly Mentions: 14,362
-
WallStreetBets Daily Mentions: 91
-
Percentage of Total Mentions: 4.83%
- YTD Performance: -42.21%
Meta QQ Report (Quiver Quantitative)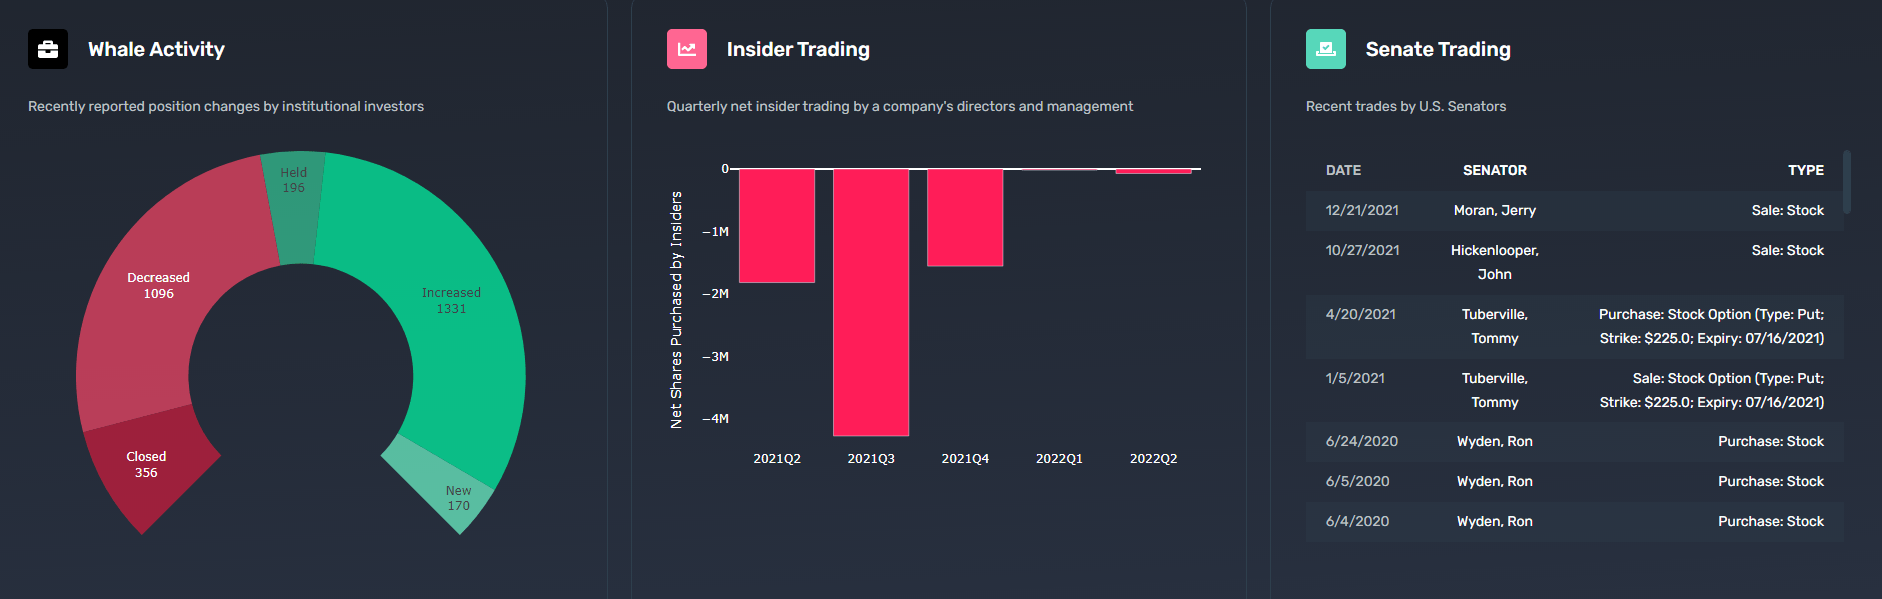
Advanced Micro Devices (AMD)
-
QQ’s WSB Ranking: #4
-
WallStreetBets Yearly Mentions: 13,728
-
WallStreetBets Daily Mentions: 86
-
Percentage of Total Mentions: 4.62%
- YTD Performance: -29.93%
AMD QQ Report (Quiver Quantitative)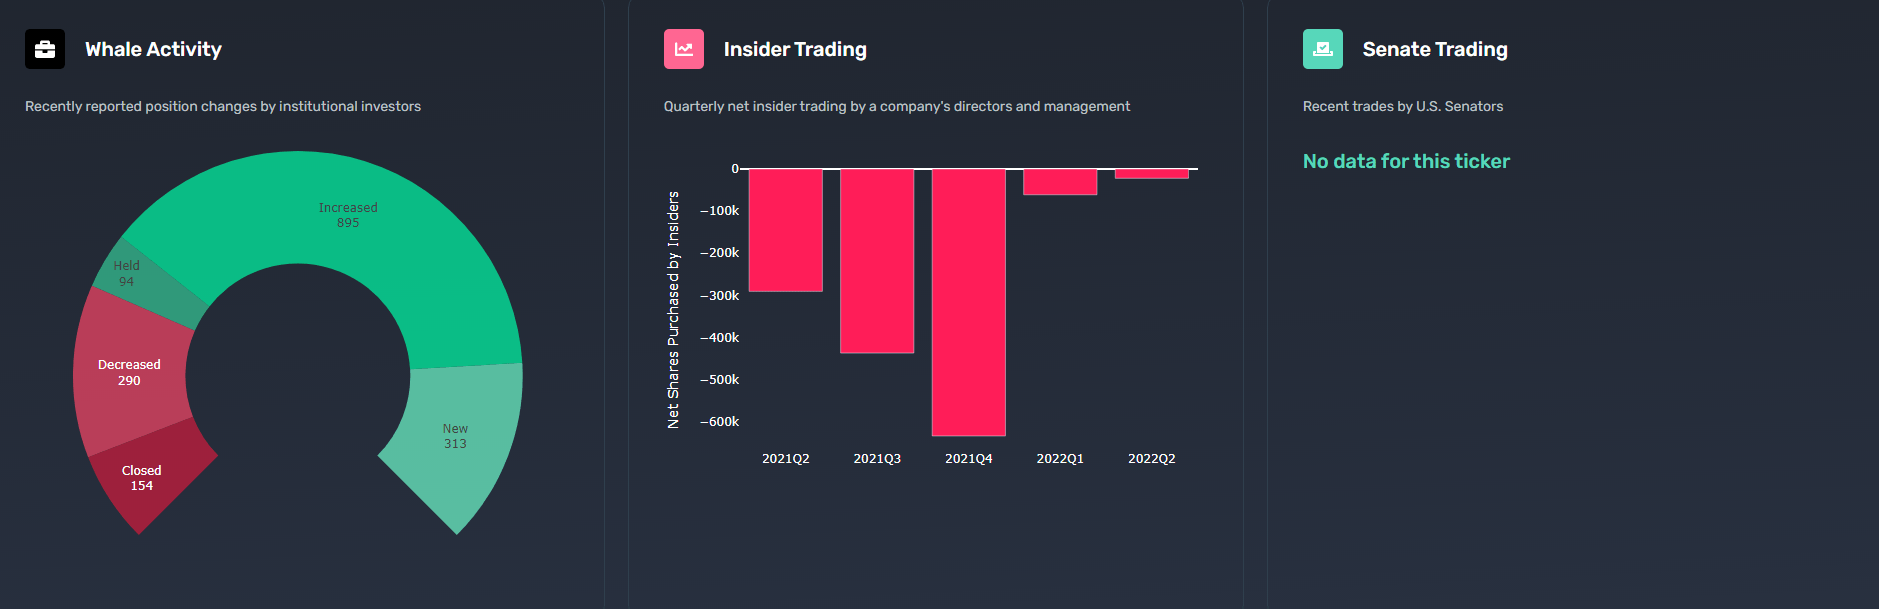
NVIDIA (NVDA)
-
QQ’s WSB Ranking: #5
-
WallStreetBets Yearly Mentions: 11,695
-
WallStreetBets Daily Mentions: 74
-
Percentage of Total Mentions: 3.93%
- YTD Performance: -37.18%
NVIDIA QQ Report (Quiver Quantitative)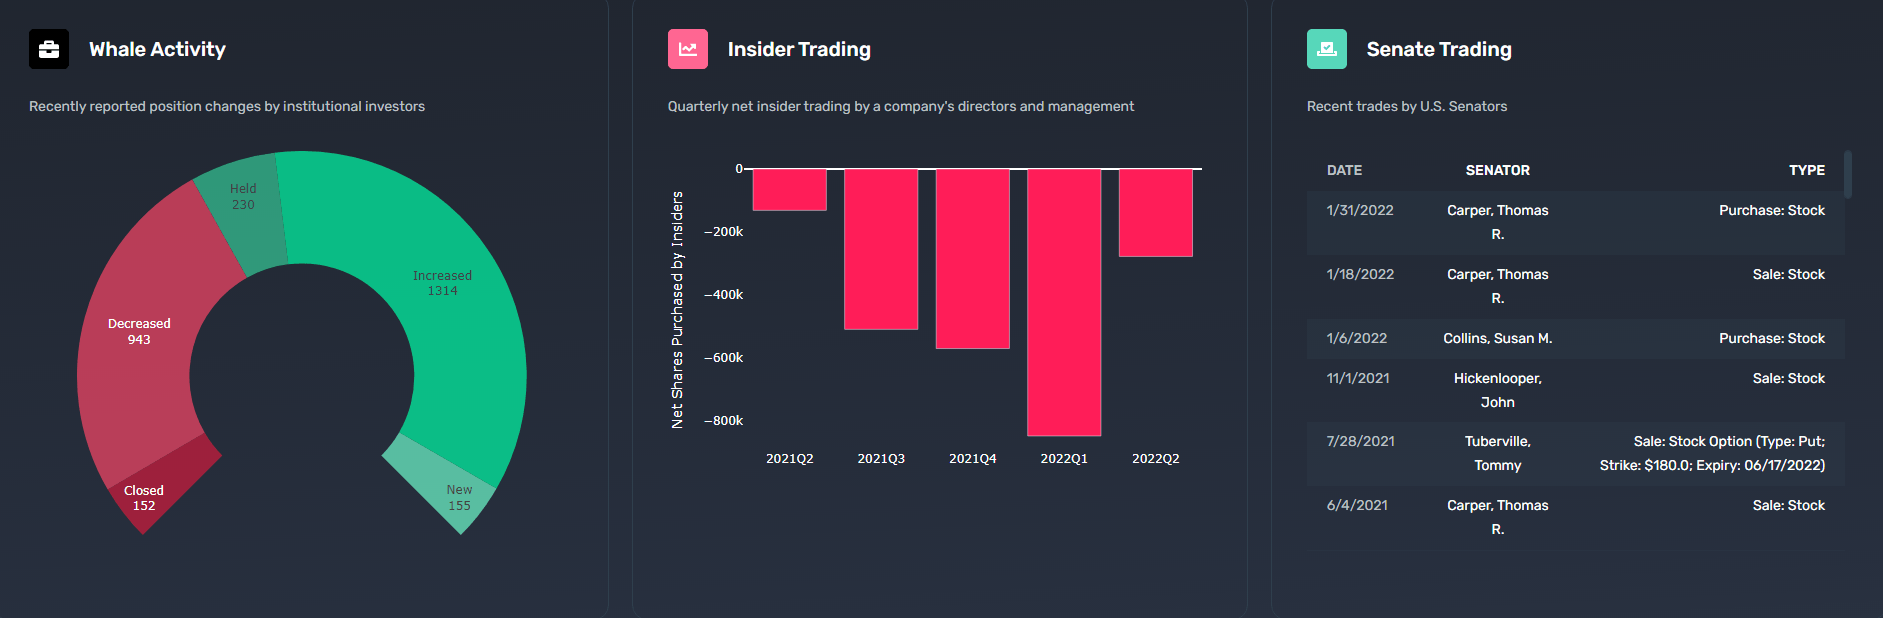
Apple (AAPL)
-
QQ’s WSB Ranking: #6
-
WallStreetBets Yearly Mentions: 9494
-
WallStreetBets Daily Mentions: 60
-
Percentage of Total Mentions: 3.19%
- YTD Performance: -18.30%
Apple QQ Report (Quiver Quantitative)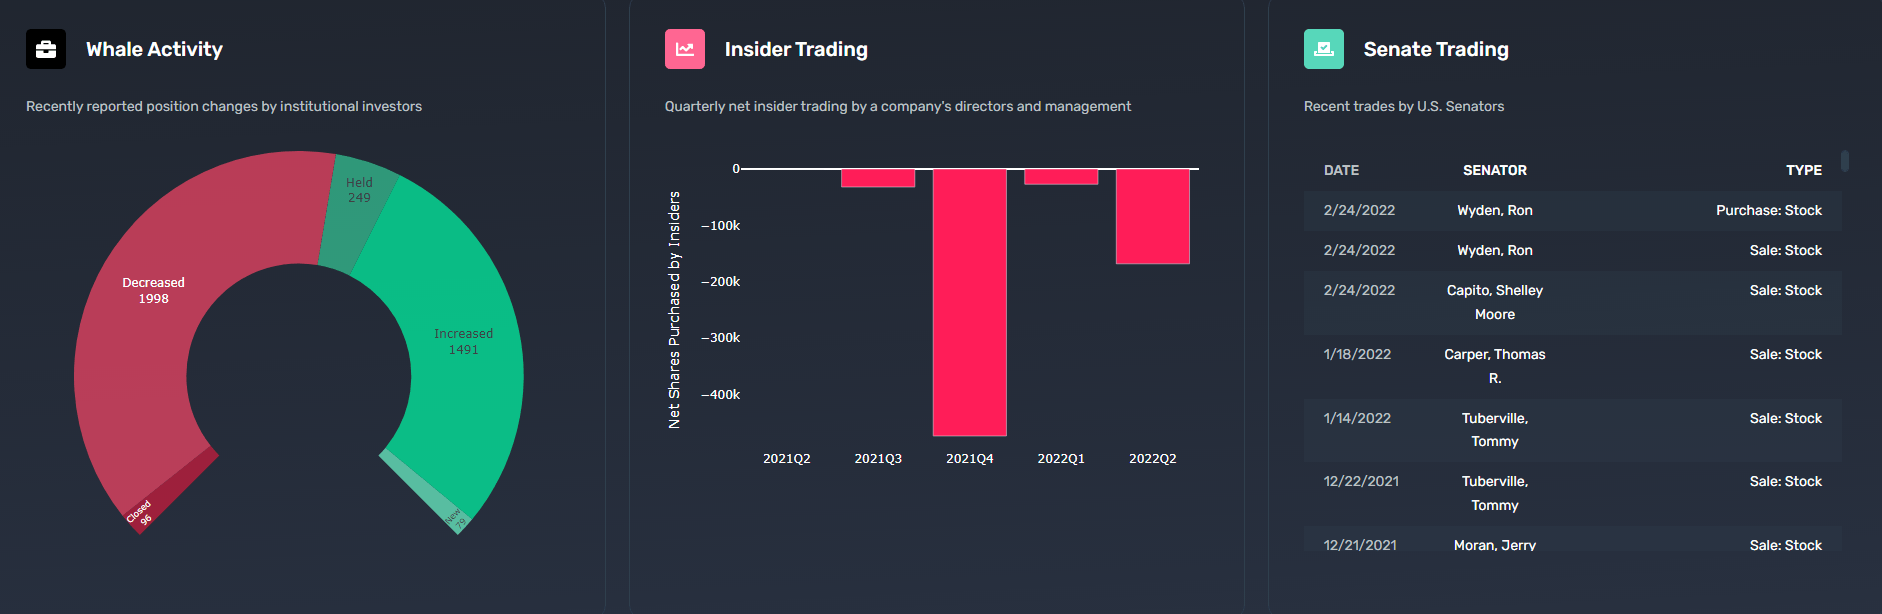
Amazon (AMZN)
-
QQ’s WSB Ranking: #7
-
WallStreetBets Yearly Mentions: 9181
-
WallStreetBets Daily Mentions: 58
-
Percentage of Total Mentions: 3.09%
- YTD Performance: -27.79%
Amazon QQ Report (Quiver Quantitative)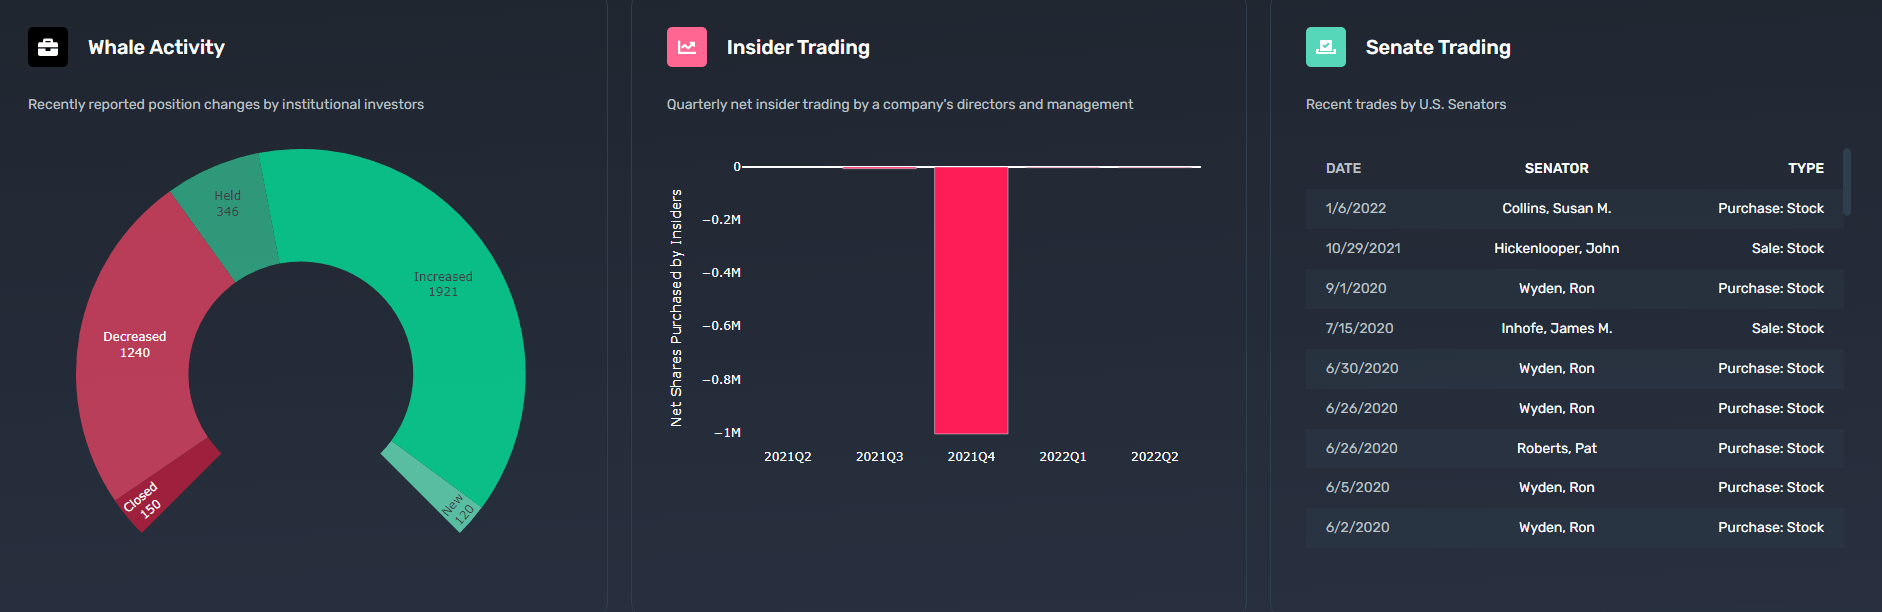
AMC Entertainment (AMC)
-
QQ’s WSB Ranking: #8
-
WallStreetBets Yearly Mentions: 8308
-
WallStreetBets Daily Mentions: 52
-
Percentage of Total Mentions: 2.79%
- YTD Performance: -50.72%
AMC QQ Report (Quiver Quantitative)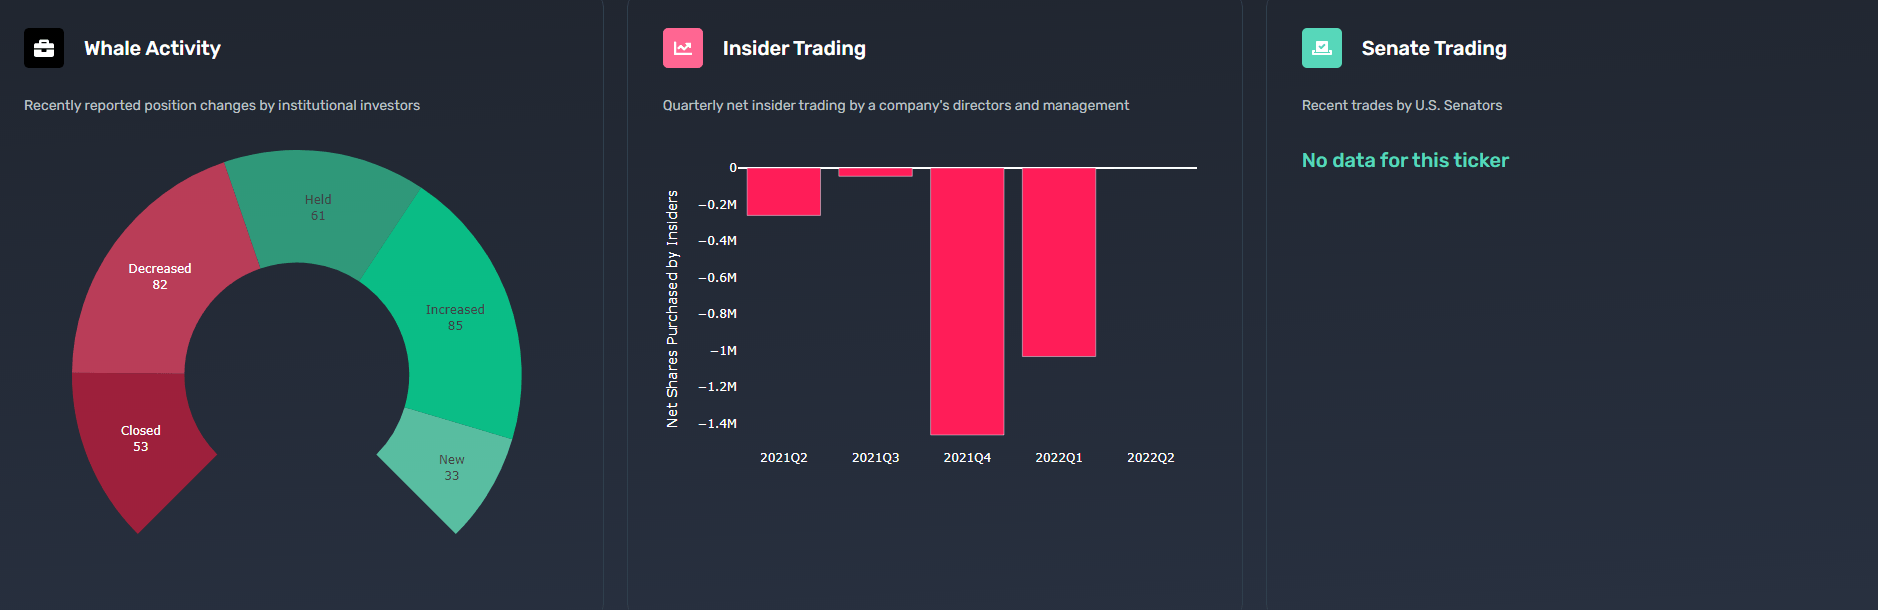
Microsoft (MSFT)
-
QQ’s WSB Ranking: #9
-
WallStreetBets Yearly Mentions: 7857
-
WallStreetBets Daily Mentions: 49
-
Percentage of Total Mentions: 2.64%
- YTD Performance: -18.60%
Microsoft QQ Report (Quiver Quantitative)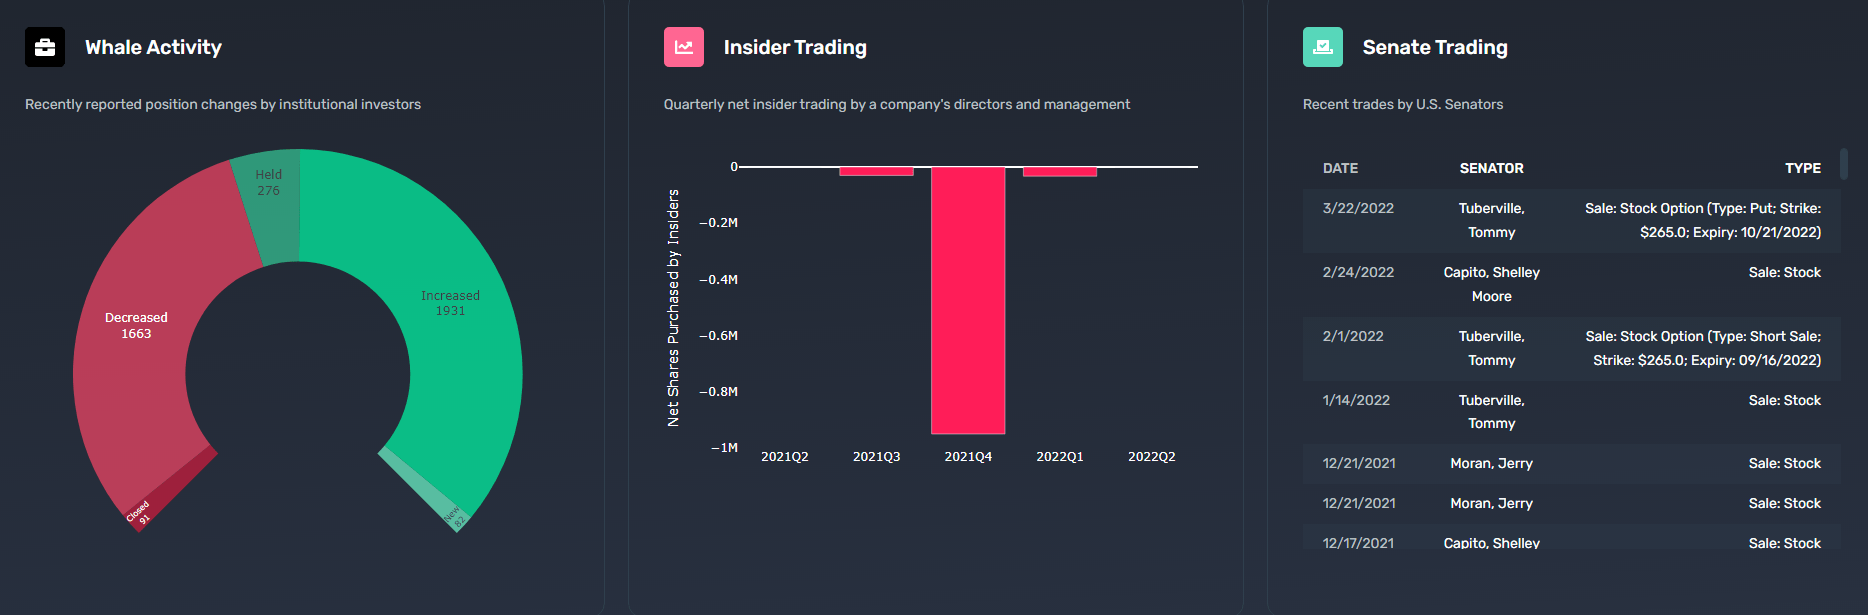
Netflix (NFLX)
-
QQ’s WSB Ranking: #10
-
WallStreetBets Yearly Mentions: 5762
-
WallStreetBets Daily Mentions: 46
-
Percentage of Total Mentions: 1.94%
- YTD Performance: -71.39%
Netflix QQ Report (Quiver Quantitative)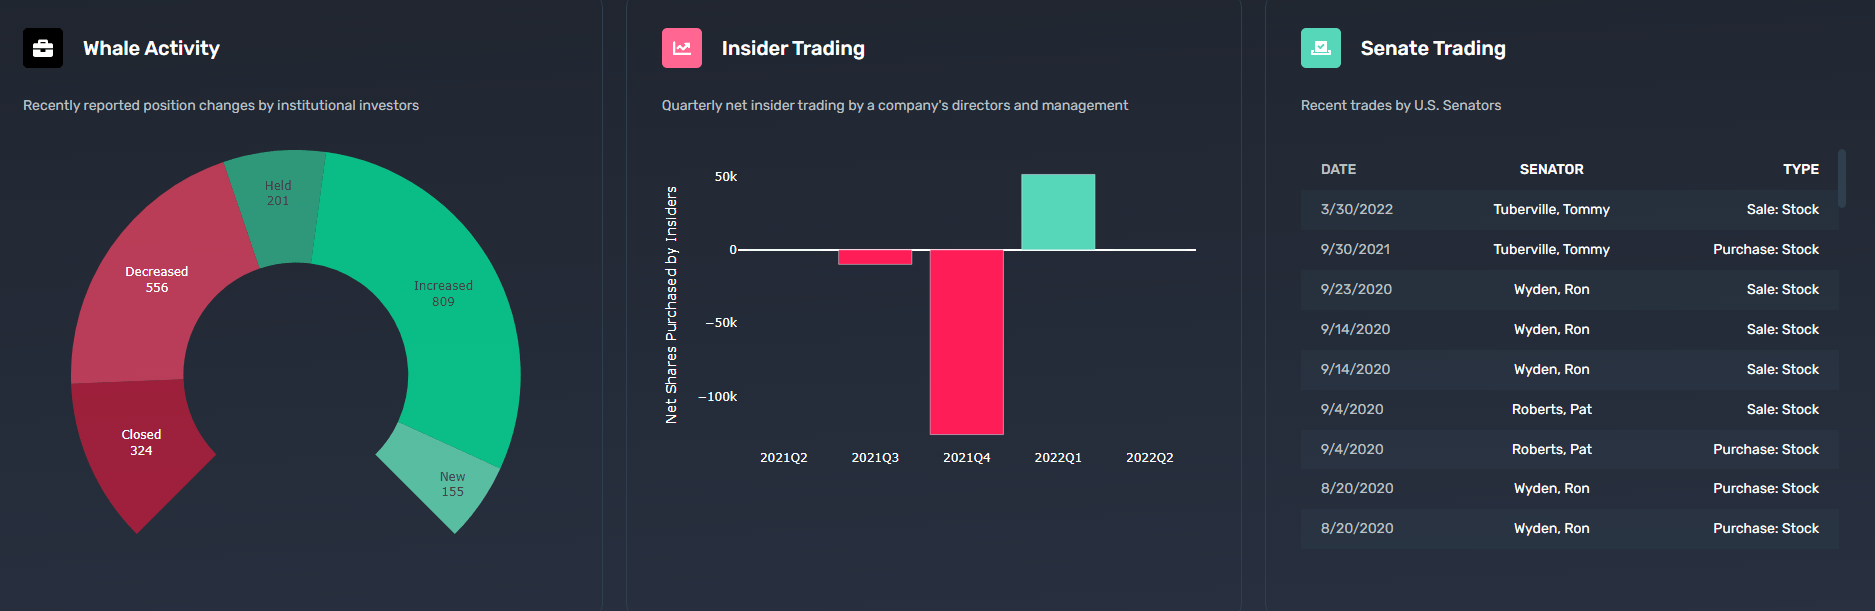
Considering that the FAANG stocks remain in general the most popular and often discussed stocks within all investing communities, not being limited to only WallStreetBets, including them within the list might not end up being all that fair. If we are to exclude the FAANG stocks from the top 10 list, that would effectively free up space for the following companies: Palantir Technologies (PLTR), Alibaba Group (BABA), Robinhood Markets (HOOD), Twitter (TWTR), and SoFi Technologies (SOFI).
Other notables that have garnered significant attention within the WallStreetBets subreddit, but failed to make the list were: Snap (SNAP), Peloton Interactive (PTON), Tilray (TLRY), Roblox (RBLX), Rivian Automotive (RIVN), Digital World Acquisition (DWAC), Disney (DIS), Alphabet (GOOG), Lucid Group (LCID), PayPal Holdings (PYPL), Ryder System (R), Visa (V), Shopify (SHOP), ContextLogic (WISH), Coinbase Global (COIN), NIO (NIO), Block (SQ), Bed Bath & Beyond (BBBY), Exxon Mobil (XOM), DraftKings (DKNG), S&P (SPX), Invesco QQQ (QQQ), ProShares SQQQ (SQQQ), and others.
Is WallStreetBets beating the market?
While this covers the most popular stocks over at WallStreetBets, we still do not have an idea of how well their favorite stock picks carried themselves against the recession-headed market of 2022.
We have created two indexes for performance measuring purposes:
- WallStreetBets Popular Index – Most discussed companies on the WSB subreddit, being weighted by popular demand.
- WallStreetBets Equal Index – The most discussed companies on the WSB subreddit, weighted equally.
Index Performance (Author Index)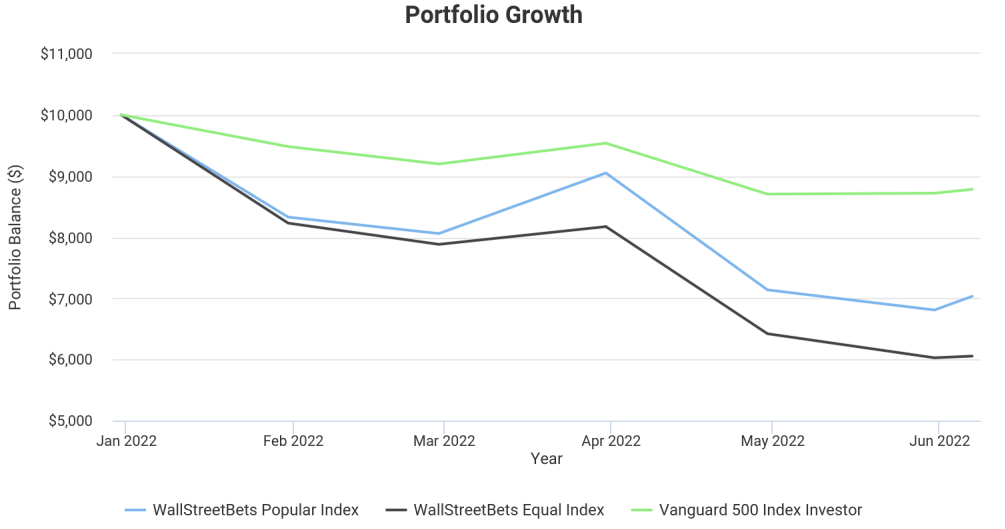
As can be seen from the chart, WallStreetBet’s most popular stock picks have had a terrible year in the markets, with both of our indexes significantly underperforming the market. Our WallStreetBets Popular Index has generated a negative -29.68% return, underperforming the market by 16.42%. The WallStreetBets Equal Index, on the other hand, has generated an extraordinary negative -39.45% return, getting beaten by the market by almost 26.19%.
An interesting observation here is that our popular weighted index where Tesla and GameStop make up almost 40% of the index weight seems to have fared much better than the rest of the bunch. The results themselves explain to an extent how our WallStreetBets fear and greed index started signaling more fear than the general market fear and greed index, which was already at a very low point.
WallStreetBets Popular Index (Quiver Quantitative)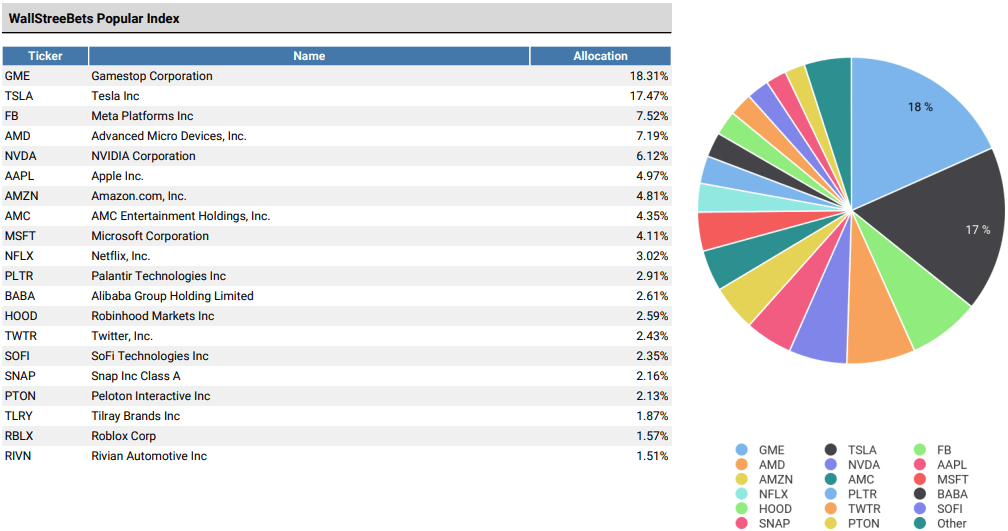
The worst-performing position in the index is Rivian Technologies, which managed to generate an extraordinary -71.07% year-to-date performance. Shares of the electric vehicle automaker could have been acquired for $102.72 per share at the beginning of the year, while they are selling for only $29.72 as of today. The leader is closely followed by Roblox Corp, which is down -69.52% since the beginning of the year. Shares of the video game developer could have been bought for $98.81 per share in January, while the average investor needs to pay out only $31.44 per share as of today. The close third was none other than Netflix, which returned a negative 67.03% year-to-date. The FAANG stock was trading as high as $597.37 in January, already down 13.60% from its all-time highs. Today, a position in the former streaming giant can be opened for as little as $198.61 per share.
WallStreetBets Equal Index (Quiver Quantitative)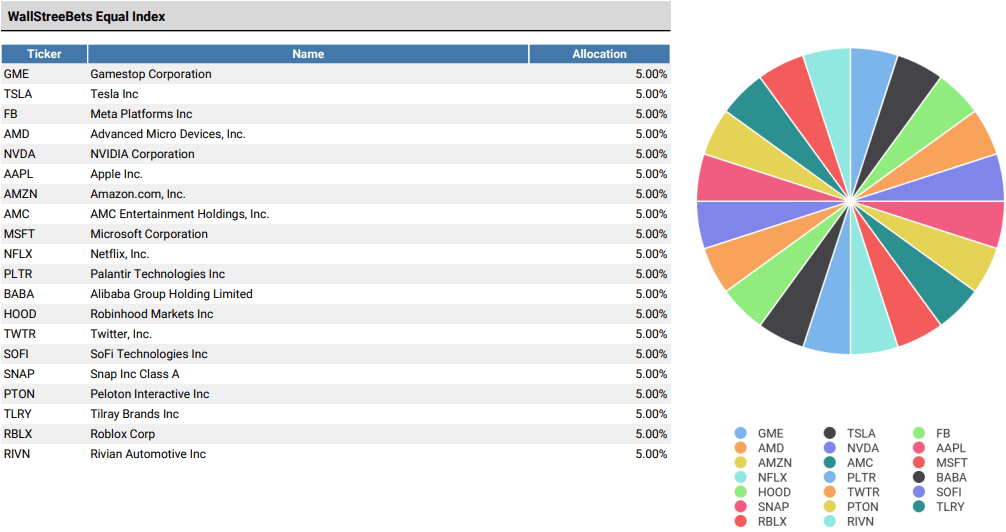
As none of the stocks within the WallStreetBets index generated positive returns since the beginning of the year, it remains difficult to discuss best-performing positions, but the chart is being led by none other than GameStop. The very symbol of WallStreetBets has generated a 9.11% alpha on the market. The brick-and-mortar retailer king had a rock-solid performance, returning only a negative 4.15% year-to-date. The second-best performing position on the WallStreetBets index is Twitter, which is finding itself in the middle of an acquisition saga by Tesla’s Elon Musk. Musk’s newest target has generated a negative 5.96% year-to-date performance, no doubt thanks to the announced acquisition. The third best performer of the index is the already heavily beaten down Alibaba Group, which generated a negative 13.34% year-to-date return. The fall from grace of the Chinese e-commerce giant has been a tragic story of politics and crackdowns getting in the way of good business. Alibaba shares can be bought for $104.32 per share, a long way to go from its all-time highs back in 2020 when the company’s shares have been reaching a price of more than $300 per share.
Our approach and strategies
A rather simplistic approach to measuring their performance against the current bear-headed market tells us that WallStreetBets picks have delivered subpar results this year. However, it is only by backtesting the data is when can get a full picture of how investor sentiment plays into the story. For the purposes of backtesting the datasets, we have created the “WallStreetBets Momentum Strategy” and “WallStreetBets Top 10 Strategy”, which approach the same data in two slightly different ways.
WallStreetBets Momentum Strategy tracks what we refer to as the “momentum” factor of stocks that are most often discussed on the WSB subreddit. The momentum factor is expressed through a score measured by the daily increase in mention of a given stock ticker. As individual tickers gain more traction, they gain a higher momentum score and thereby end up as part of our momentum strategy portfolio. The strategy uses an equal-weighted portfolio, with implemented daily rebalancing.
WSB Momentum Strategy (Quiver Quantitative)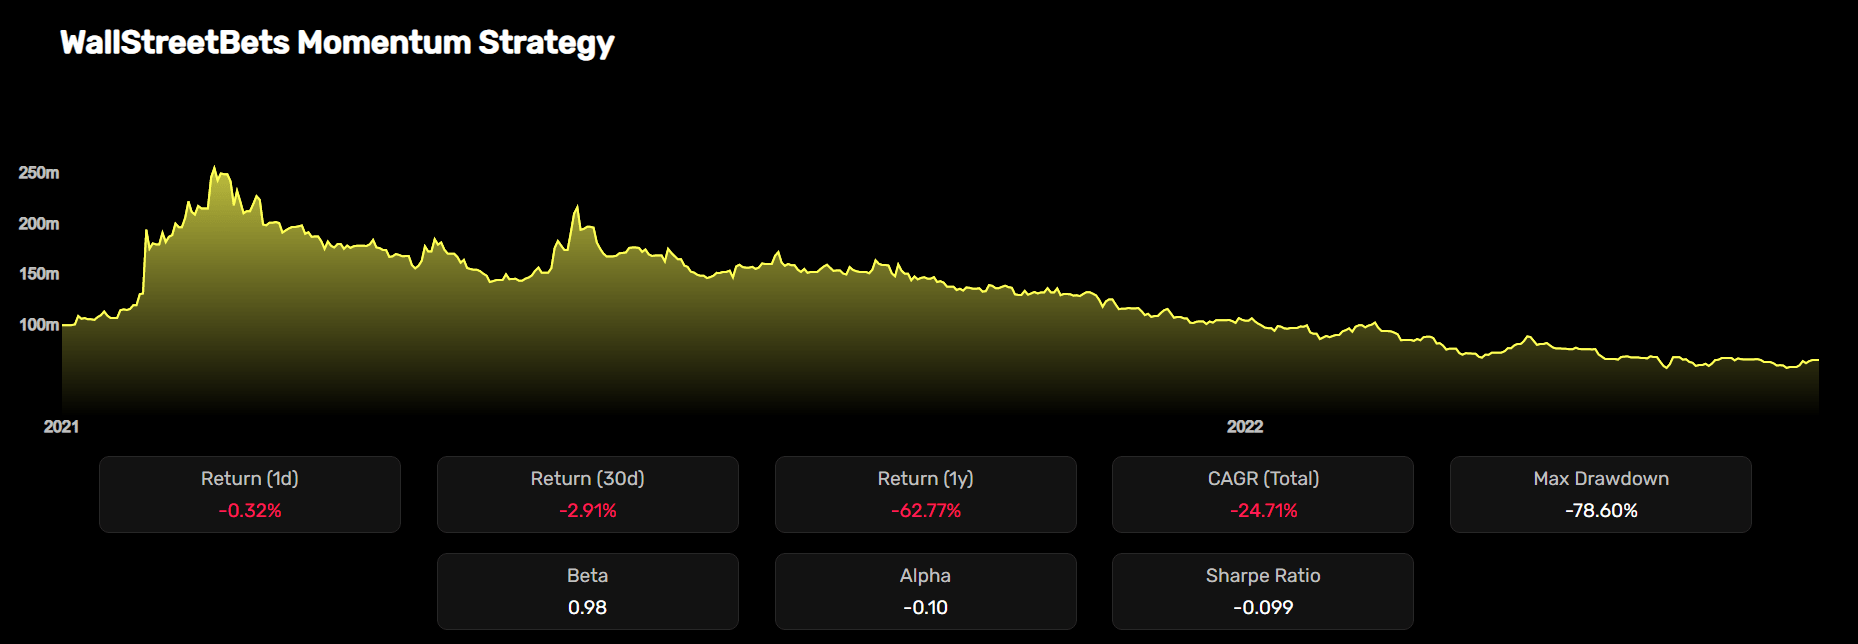
WallStreetBets Top 10 Strategy tracks what we refer to as the “popularity” factor of stocks that are most often discussed on the infamous subreddit. Only the consistently most popular stocks end up a part of this strategy, while an equal-weighted portfolio with daily rebalancing is utilized here as well.
WSB Top 10 Strategy (Quiver Quantitative)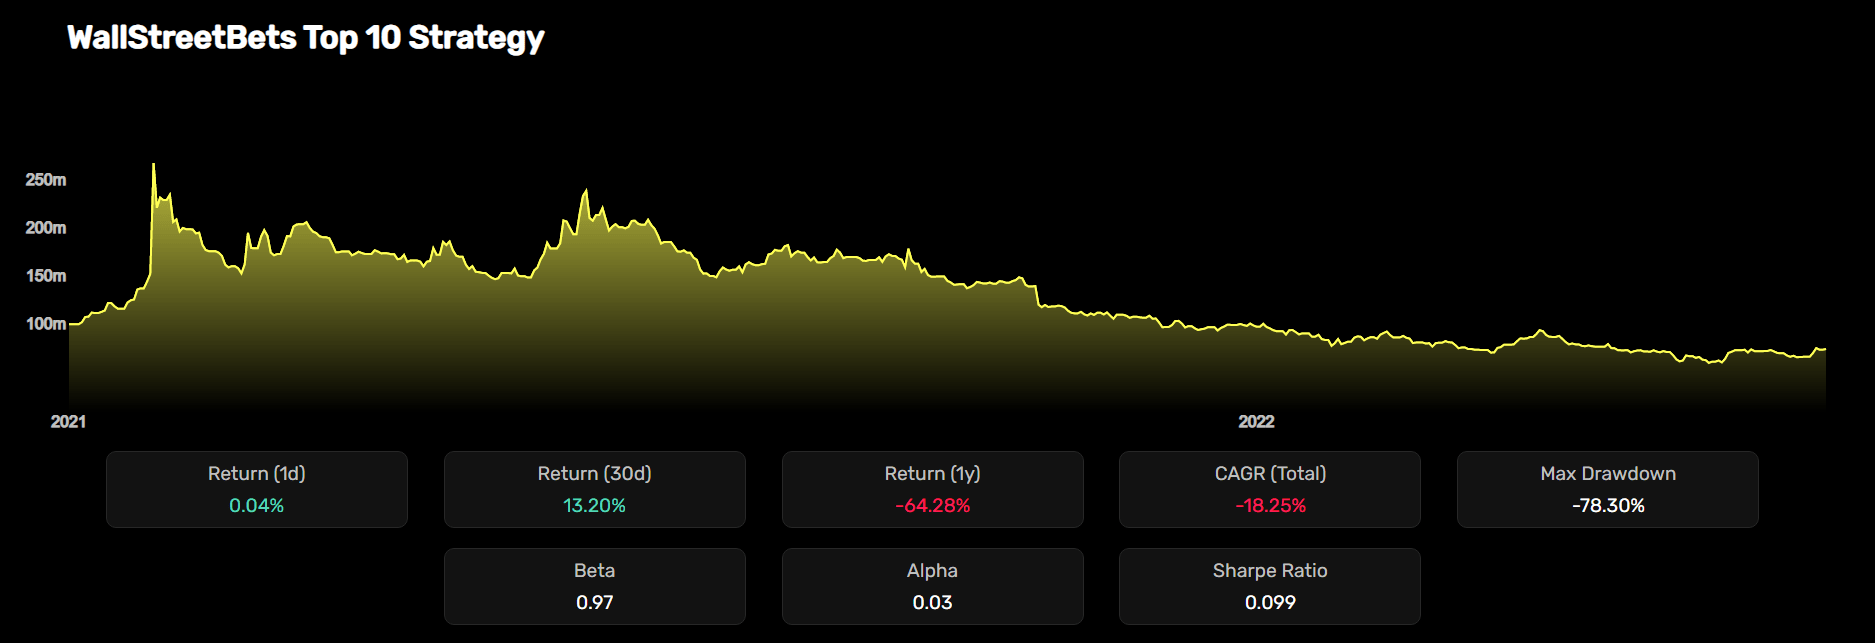
In hindsight, both strategies end up underperforming the market and delivering subpar results. However, there is something extremely interesting that is to be observed when looking at the historical performance of the two strategies. During the peak of the “meme stock mania”, when the WSB sentiment was hitting all-time highs, the strategies were delivering significant alpha on the market. In the same manner, once the fear factor outgrew the overall market sentiment, the strategies started underperforming the market by a similar margin.
This is exactly the sort of thinking process that has led us to decide to go on a path of creating an investment strategy that is going to allow us to inverse the WallStreetBets momentum and popular stock picks, which is currently in the process. The investment premise here is that we are taking a long position in WallStreetBets momentum and popular stocks once the WallStreetBets measured sentiment rises above the overall market sentiment, while the opposite approach is to be used once WSB sentiment starts dropping below the overall market sentiment.
Final thoughts and conclusions
As fear and panic are spreading through the market, generating alpha is becoming a more difficult task by the day for the average retail investor. An in-depth look into the WallStreetBets index showcases that retail investing group sentiment is undoubtedly in the deep fear territory, with their favorite stocks experiencing tremendous down-pressure in the markets. Stock picks that were flying high during the “meme stocks period” are experiencing an immensely difficult time adapting to the new normal and are significantly underperforming the market in 2022.
There is value to be had in measuring the sentiment of retail investing groups such as the WallStreetBets subreddit. Positive sentiment swings in the WSB community are able to signal early liquidity injections in their favorite stock picks. In the same manner, once the WSB sentiment begins falling behind the general market sentiment, the same stocks might begin to experience issues on the trading floor. This presents us with an interesting investment thesis that we are able to exploit by monitoring the sentiment spread between the overall market and the WallStreetBets forum. We stand firm by the belief that the average investor should remain open to the idea of utilizing alternative data during their due diligence process in order to level the playing field between himself and the institutional investor.
Be the first to comment