

bankrx/iStock via Getty Images
In this article we assess the stock market technicals at the monthly, weekly, and daily-scales.
The technical measures are indicating that the lower-boundary of the fractal trading-range has been reached (green-ovals) and that the trend is now positive; the market will grind its way higher for the rest of the year.
Trading-ranges (ANG Traders, stockcharts.com)
At the monthly-scale, the SPX continues to rise with the Raff mid-line, and the technicals are starting to turn positive.
Monthly (ANG Traders, stockcharts.com)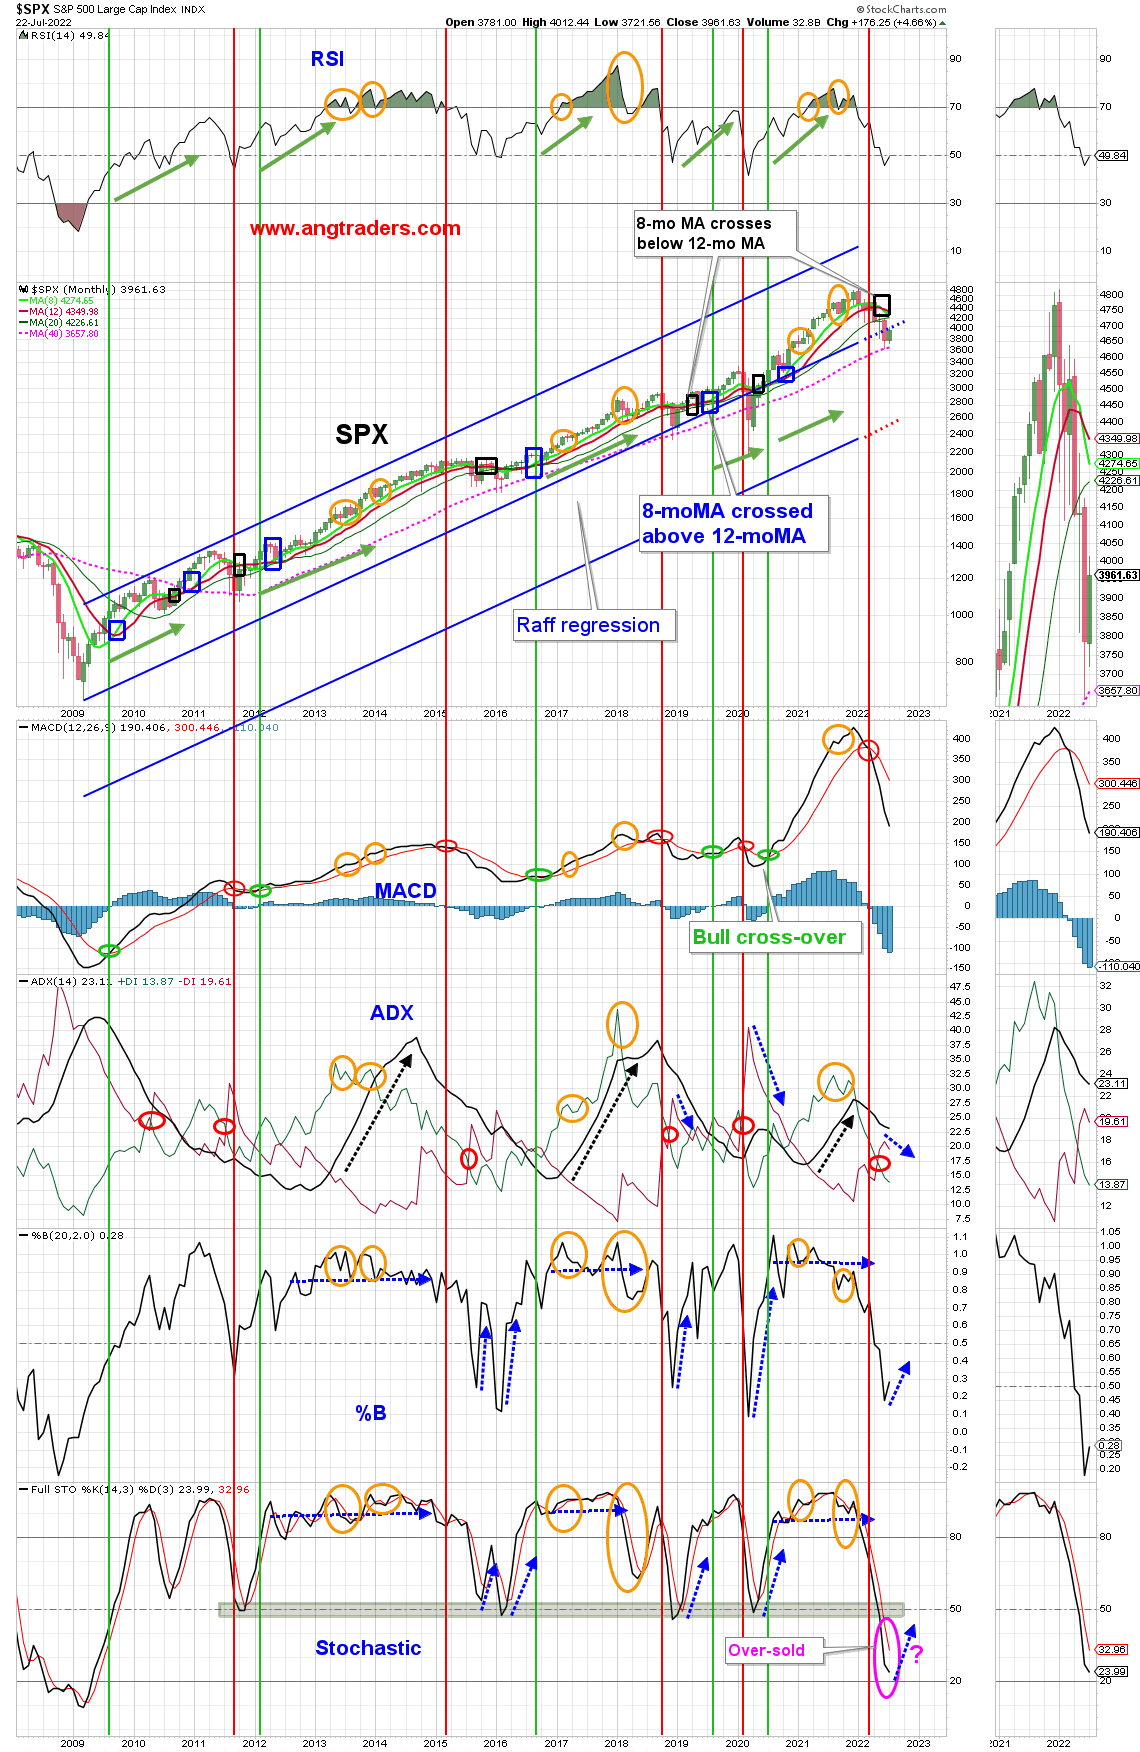
At the weekly-scale, the technicals are confirming the bottom (green ovals).
Weekly (ANG Traders, stockcharts.com)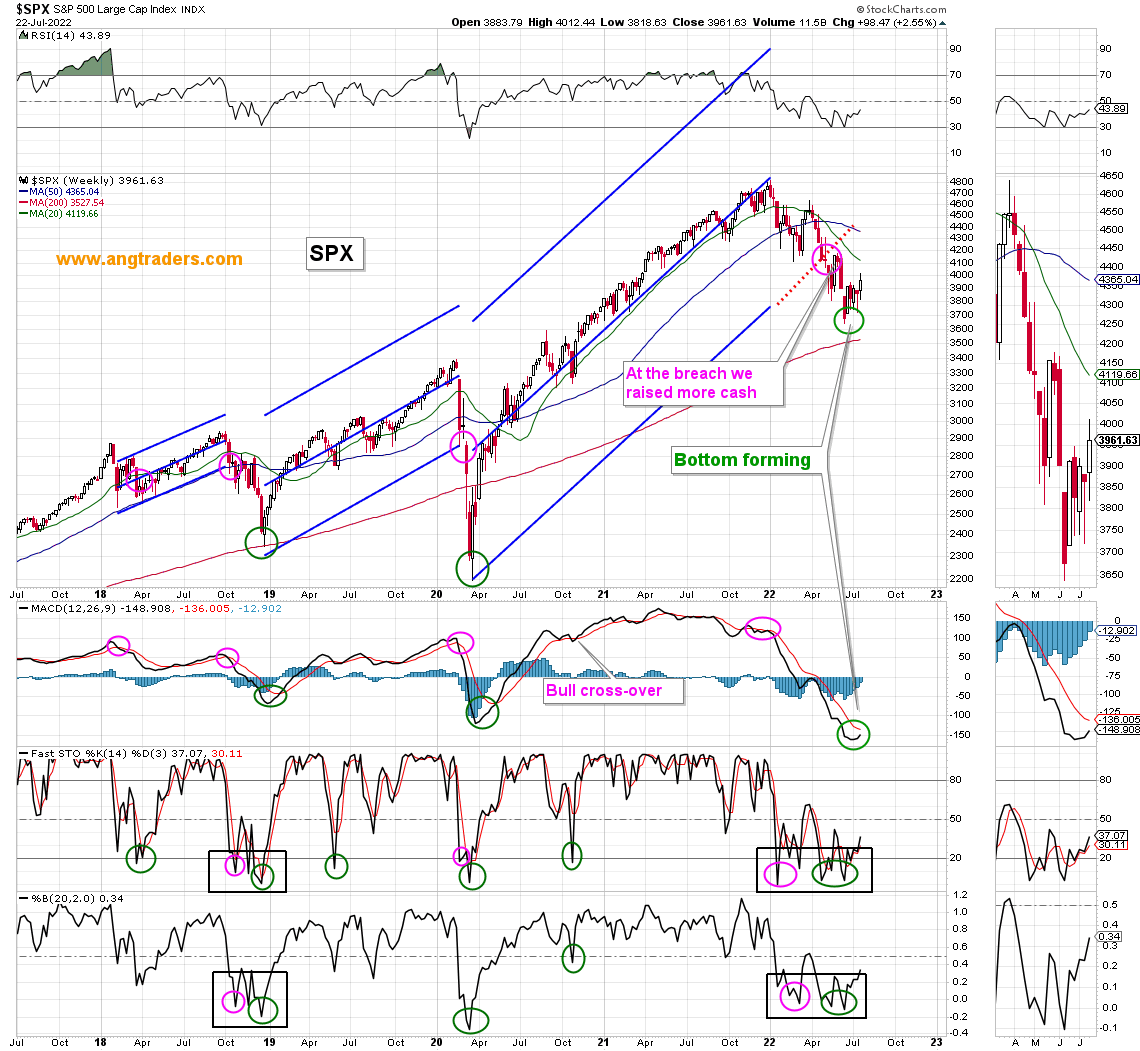
At the daily-scale, the SPX, the QQQ, and the IWM have all been turned back from resistance levels. There is support not far below, which means the weakness will be a short-lived buying opportunity (three charts below).
Daily SPX (ANG Traders, stockcharts.com)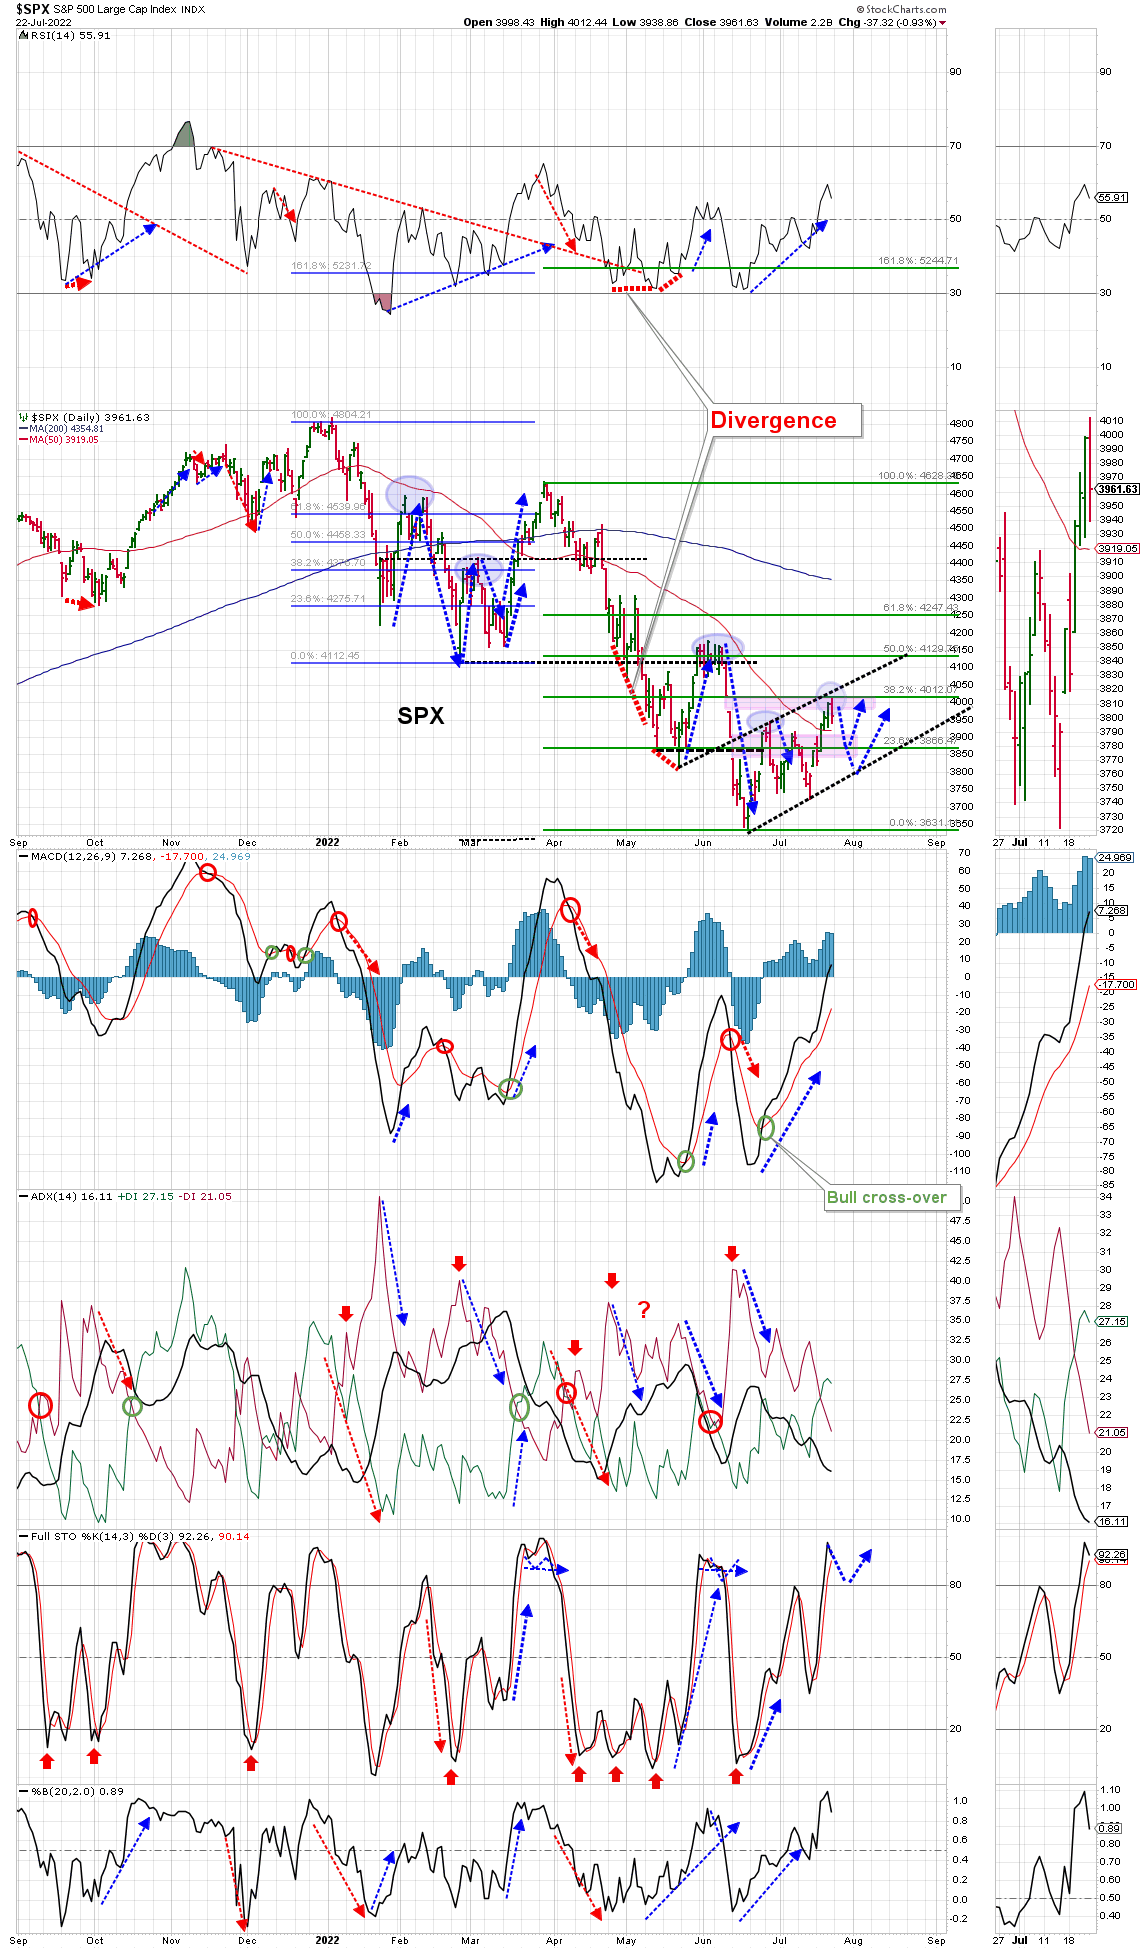
Daily QQQ (ANG Traders, stockcharts.com)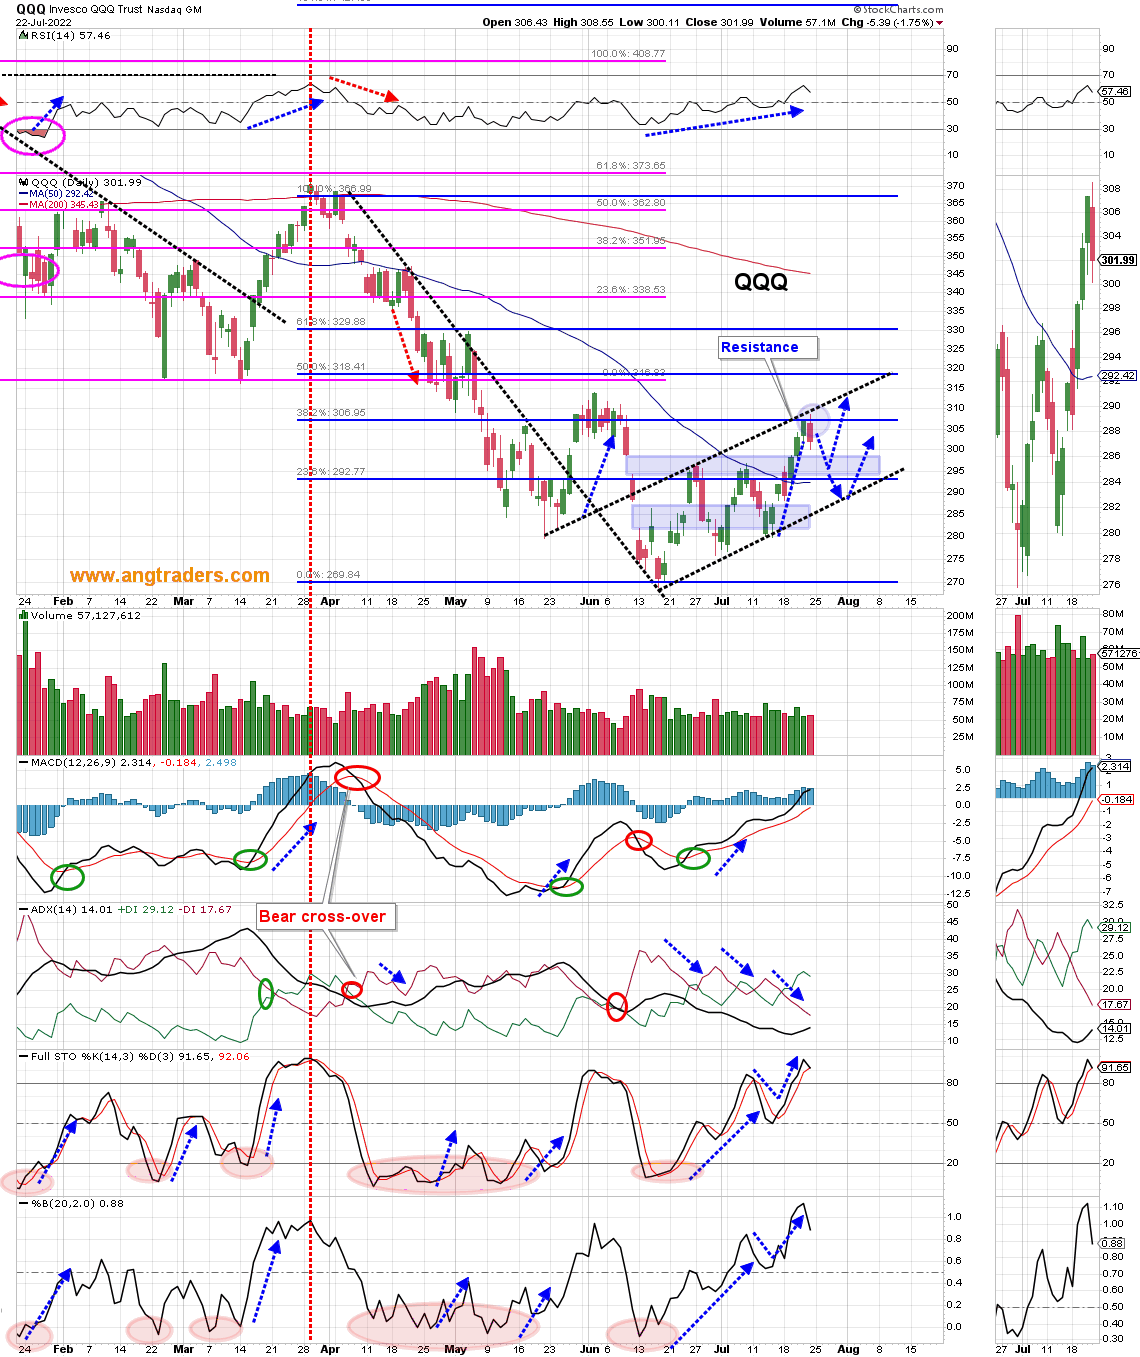
Daily IWM (ANG Traders, stockcharts.com)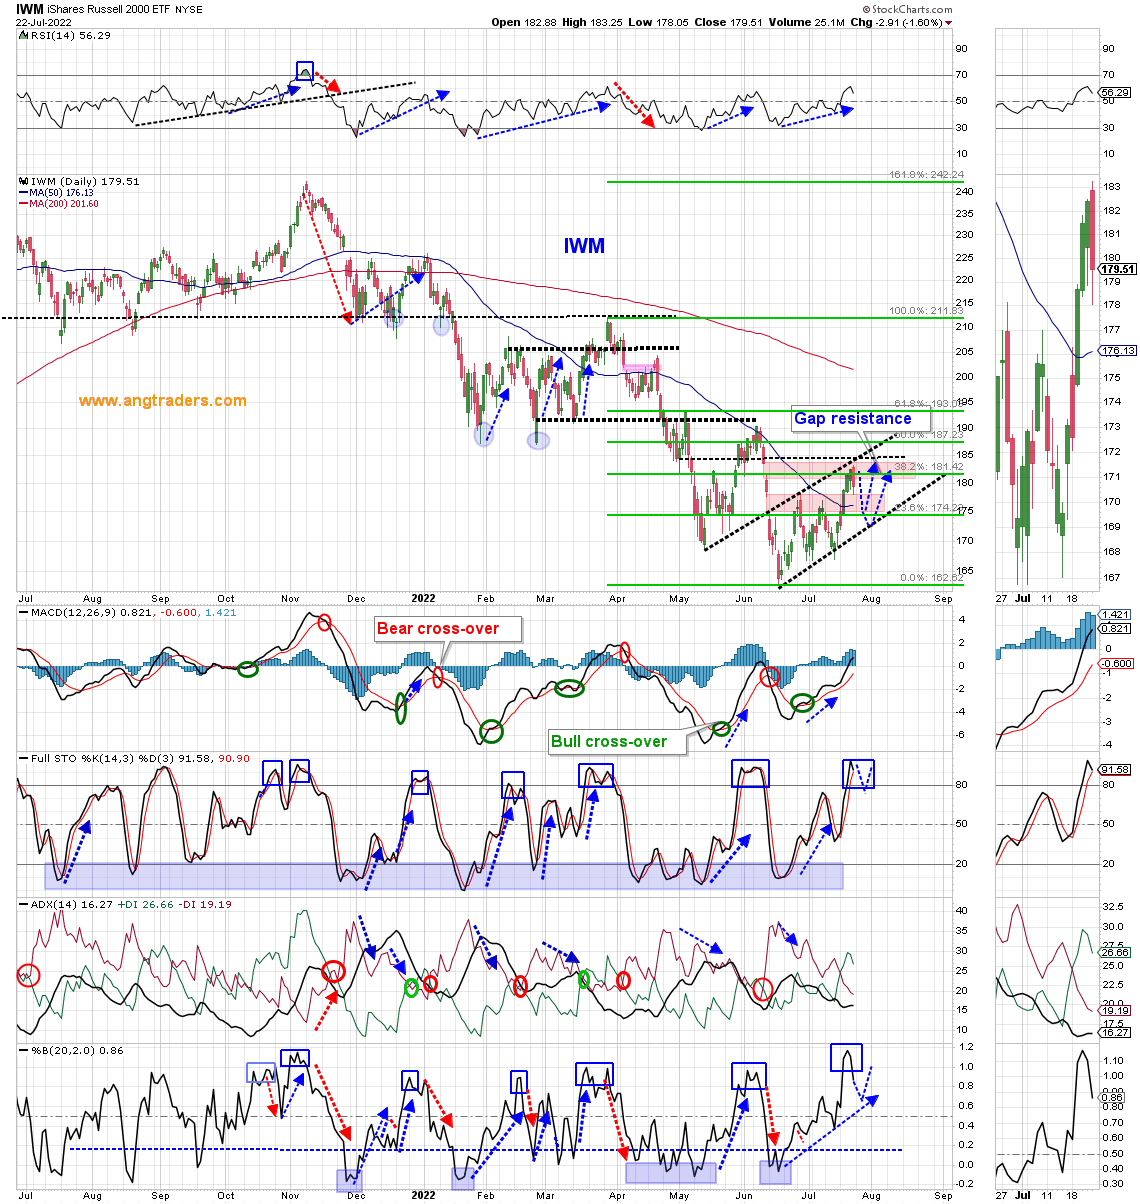
The Value:tech ratio has the SPX falling in the short-term, but it shouldn’t last beyond a couple of more days.
Value:Tech (ANG Traders, stockcharts.com)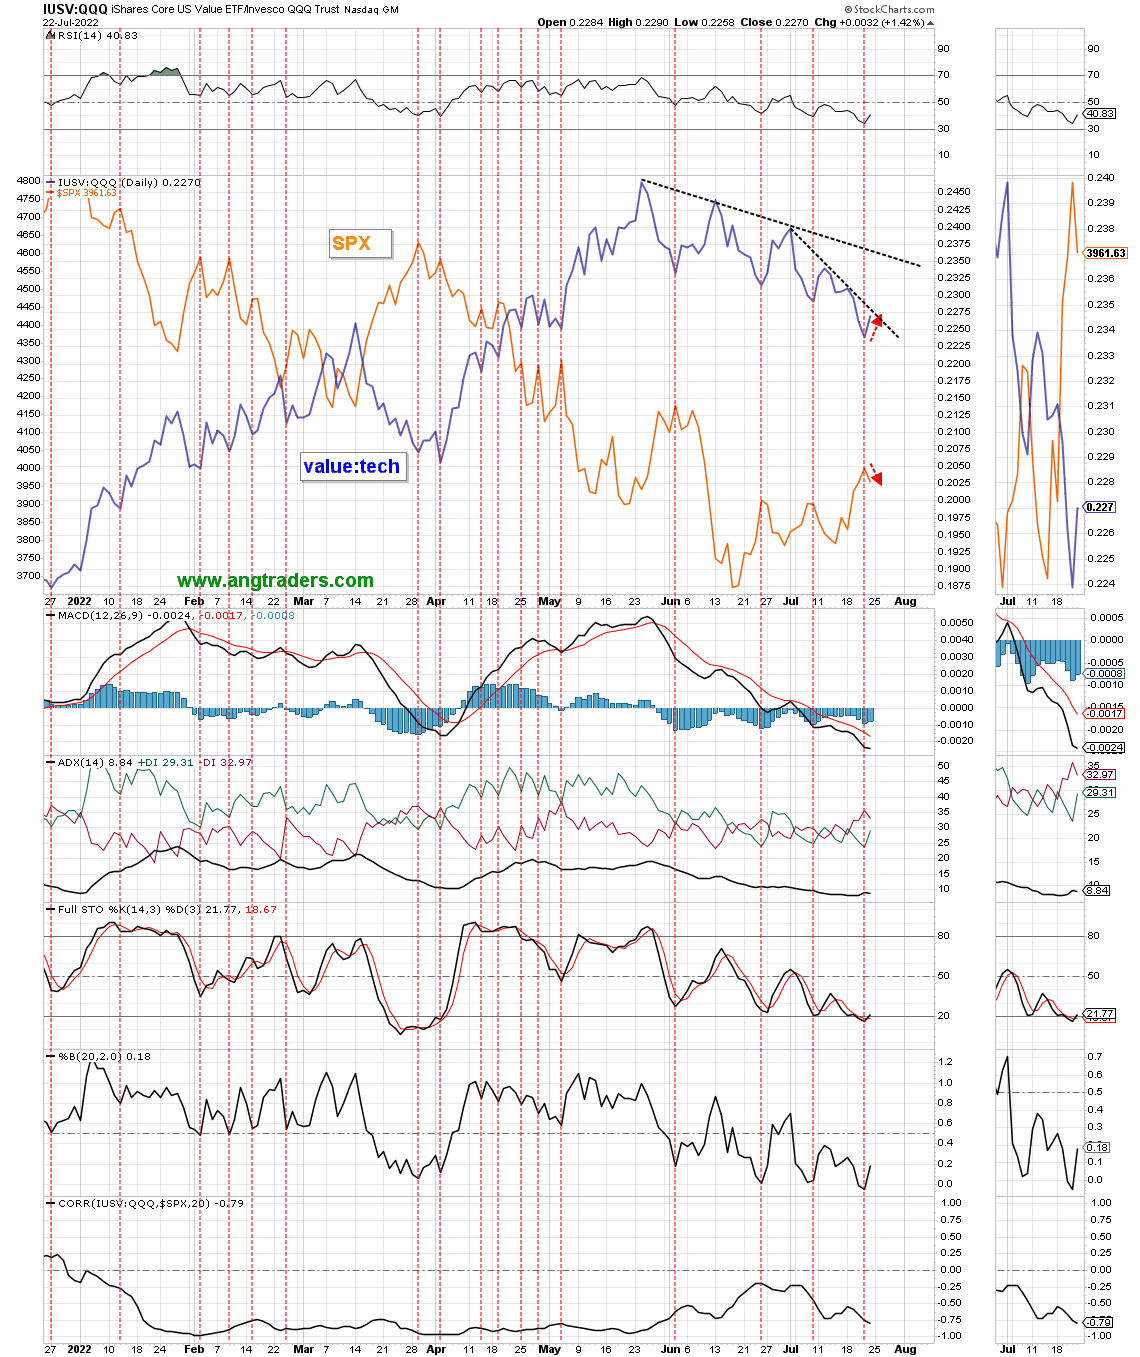
The hi-lo differential is pausing its ascent, but it will move above zero soon.
Hi-Lo (ANG Traders, stockcharts.com)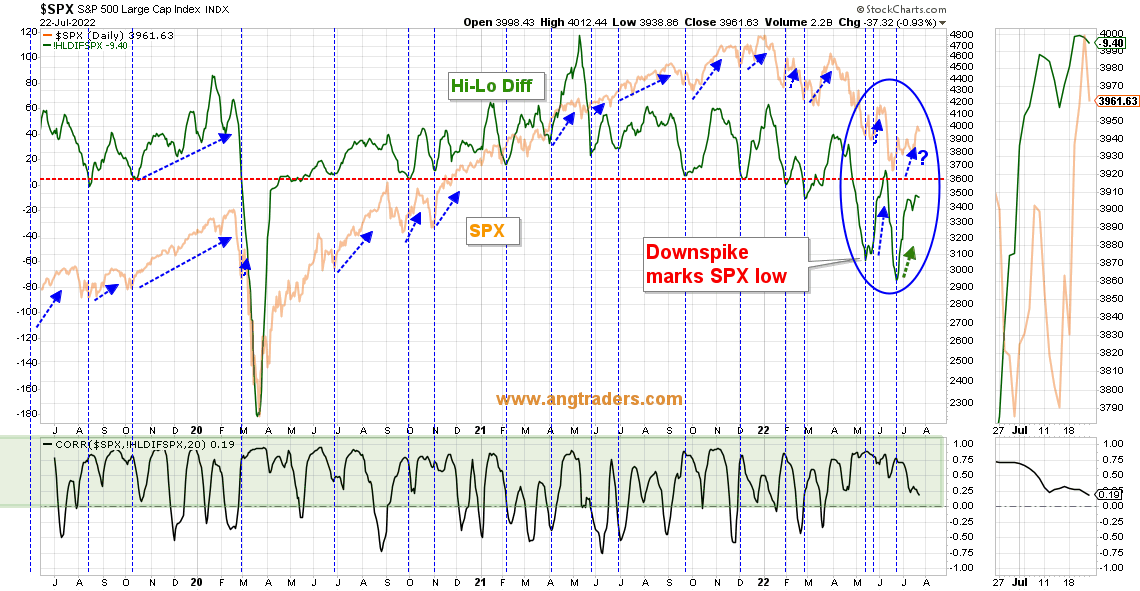
Thrust has room to move higher, but not in a straight line; it will zig-zag its way into the blue topping zone.
Thrust (ANG Traders, stockcharts.com)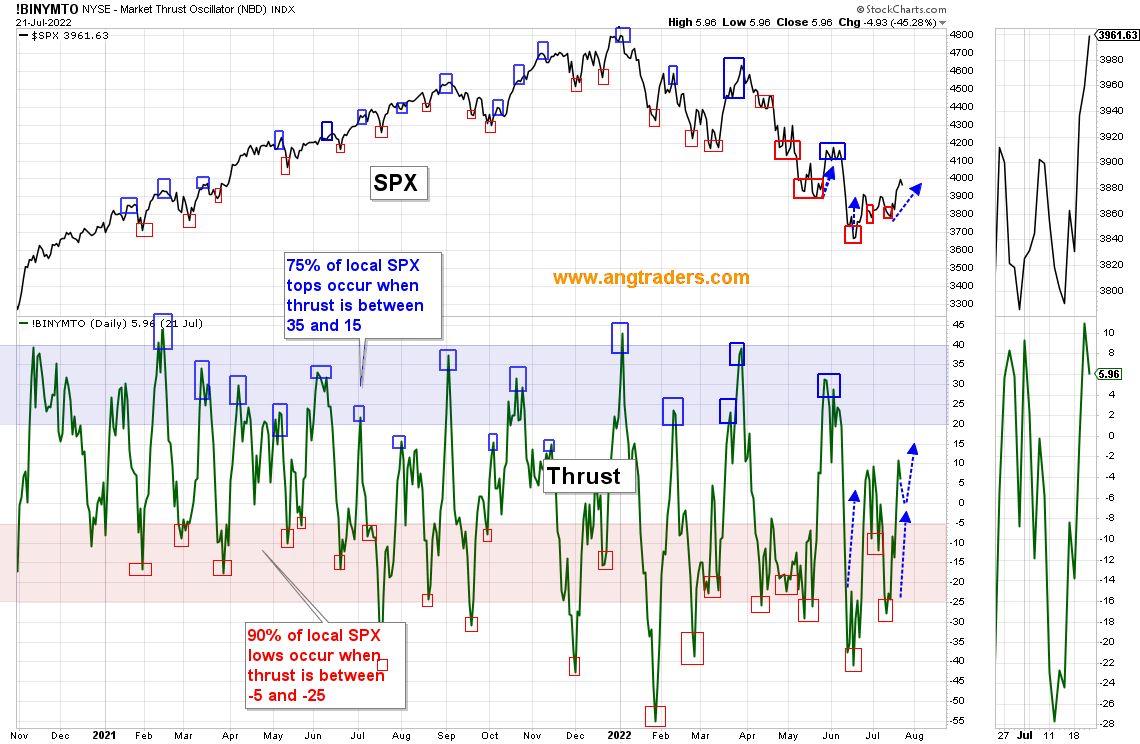
The Beckman BB-width model is in a down-phase because the indicator spiked while the %B was above 50% (red-square). This type of weakness is usually short-lived.
Beckman BB-Width (ANG Traders, stockcharts.com)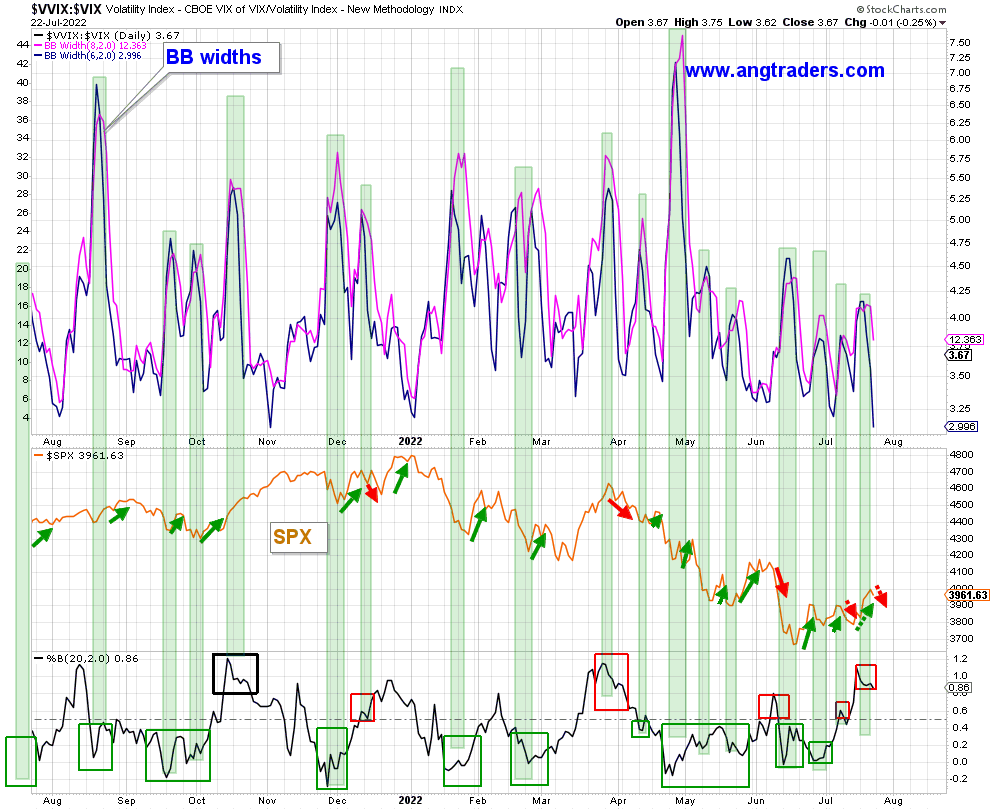
The McClellan summation is still bullish and has a way to go before it becomes over-bought (above the 70 level).
McClellan Summation (ANG Traders, stockcharts.com)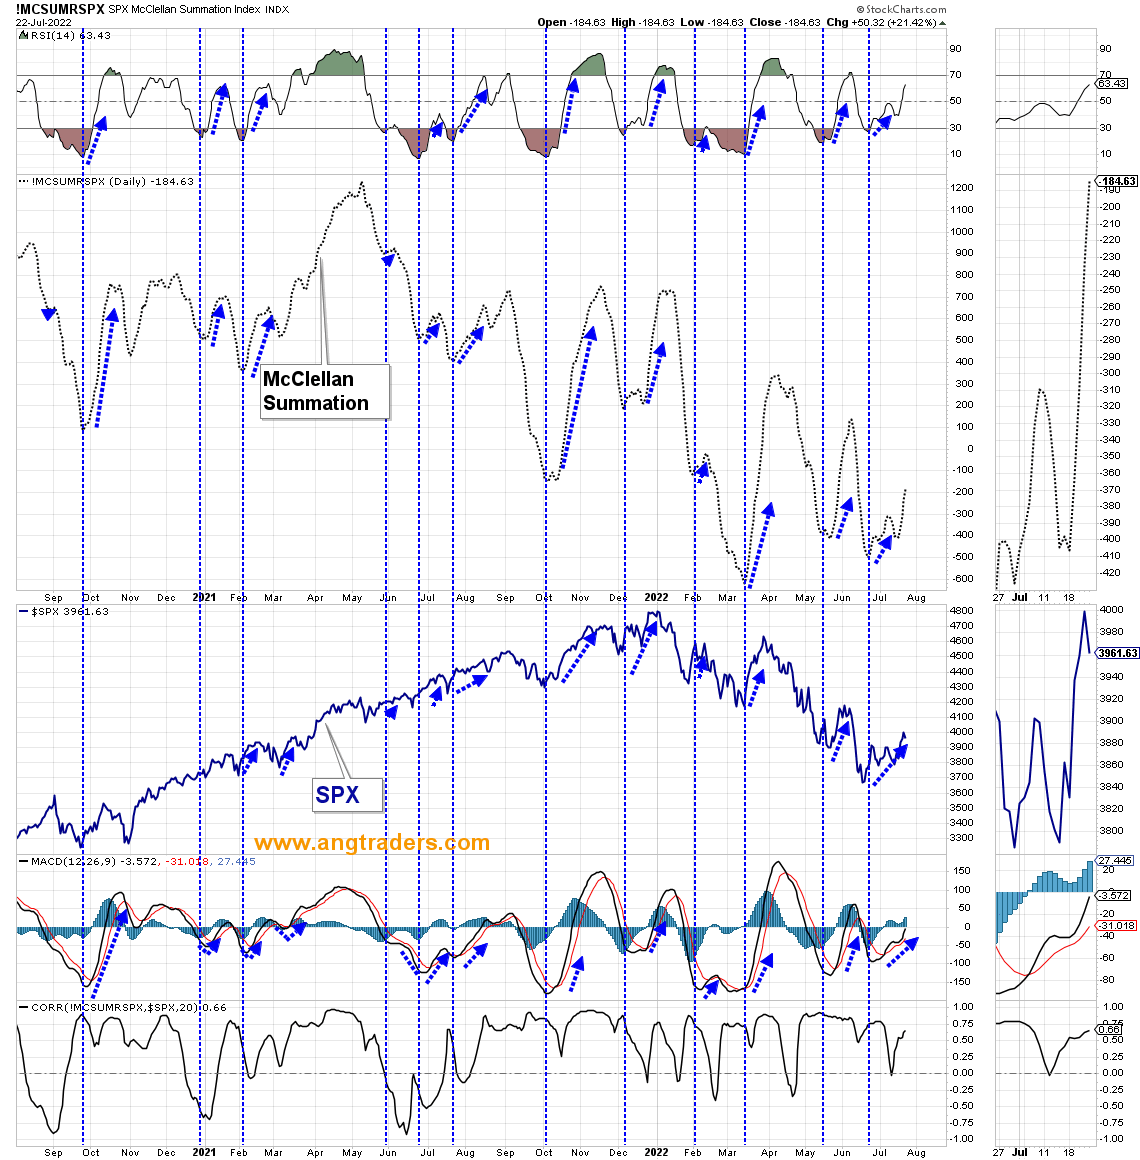
Technically, the market has confirmed the lower-boundary of the fractal trading-range and the general trend until the end of the year is up. No market moves in a straight line, however; short-term weakness is expected, but we see it as a buying opportunity. We recommend the broad-spectrum index ETFs QQQ, IWM, SPY, the tech ETF ARKK and the bond ETF TLT.
Be the first to comment