


imaginima
The oil and ET thesis
The thesis of this article is really simple: A) the current $75 oil price won’t last, and B) has created an entry point for Energy Transfer (NYSE:ET) with an enormous margin of safety. The reasoning for part A has been detailed in my earlier articles, and the key is the low inventory and also the structural imbalance in our energy supply-demand dynamics, as reflected in the data in the two charts below.
The first chart shows the U.S. strategic petroleum reserve (“SPR”), currently at 382 million barrels, after two rounds of releases to combat higher fuel prices since the Russian/Ukraine war broke out this year. As seen, the current level of SPR is near the lowest point in the past 4 decades, leaving little inventory for further releases. The second chart shows the imbalance caused by the structural underinvestment in our investment in our energy infrastructure over the years. And the problem is further exacerbated by the Russian/Ukraine war. As seen, the U.S. net imports of crude oil and petroleum products are currently not only at the lowest point in 5 decades, but also at a net negative of almost -1,600 barrels per day.
So as a result, the U.S. faces the challenges of replenishing its SPR and oil inventory, and while at the same time meeting export needs. And under this background, we will examine part B of the thesis: the part that is specific to ET.
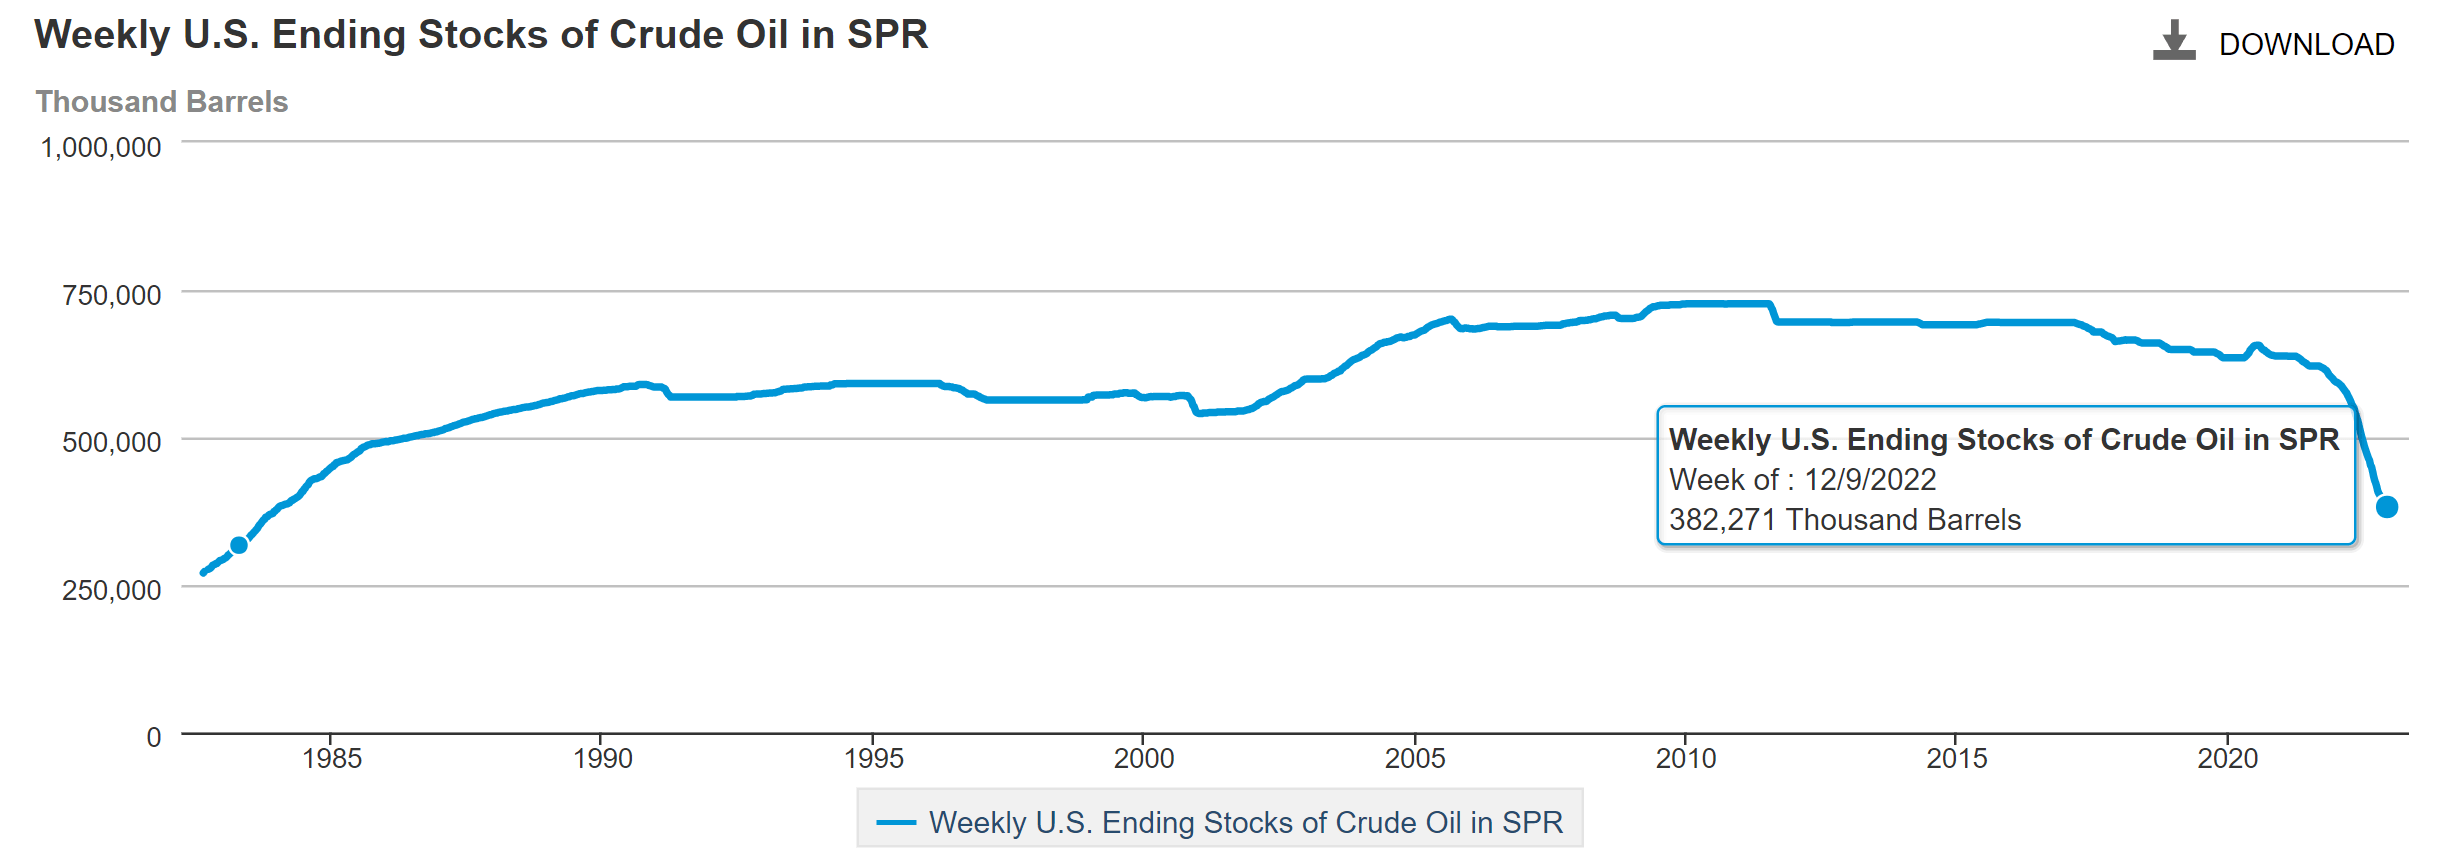
Source: EIA.gov
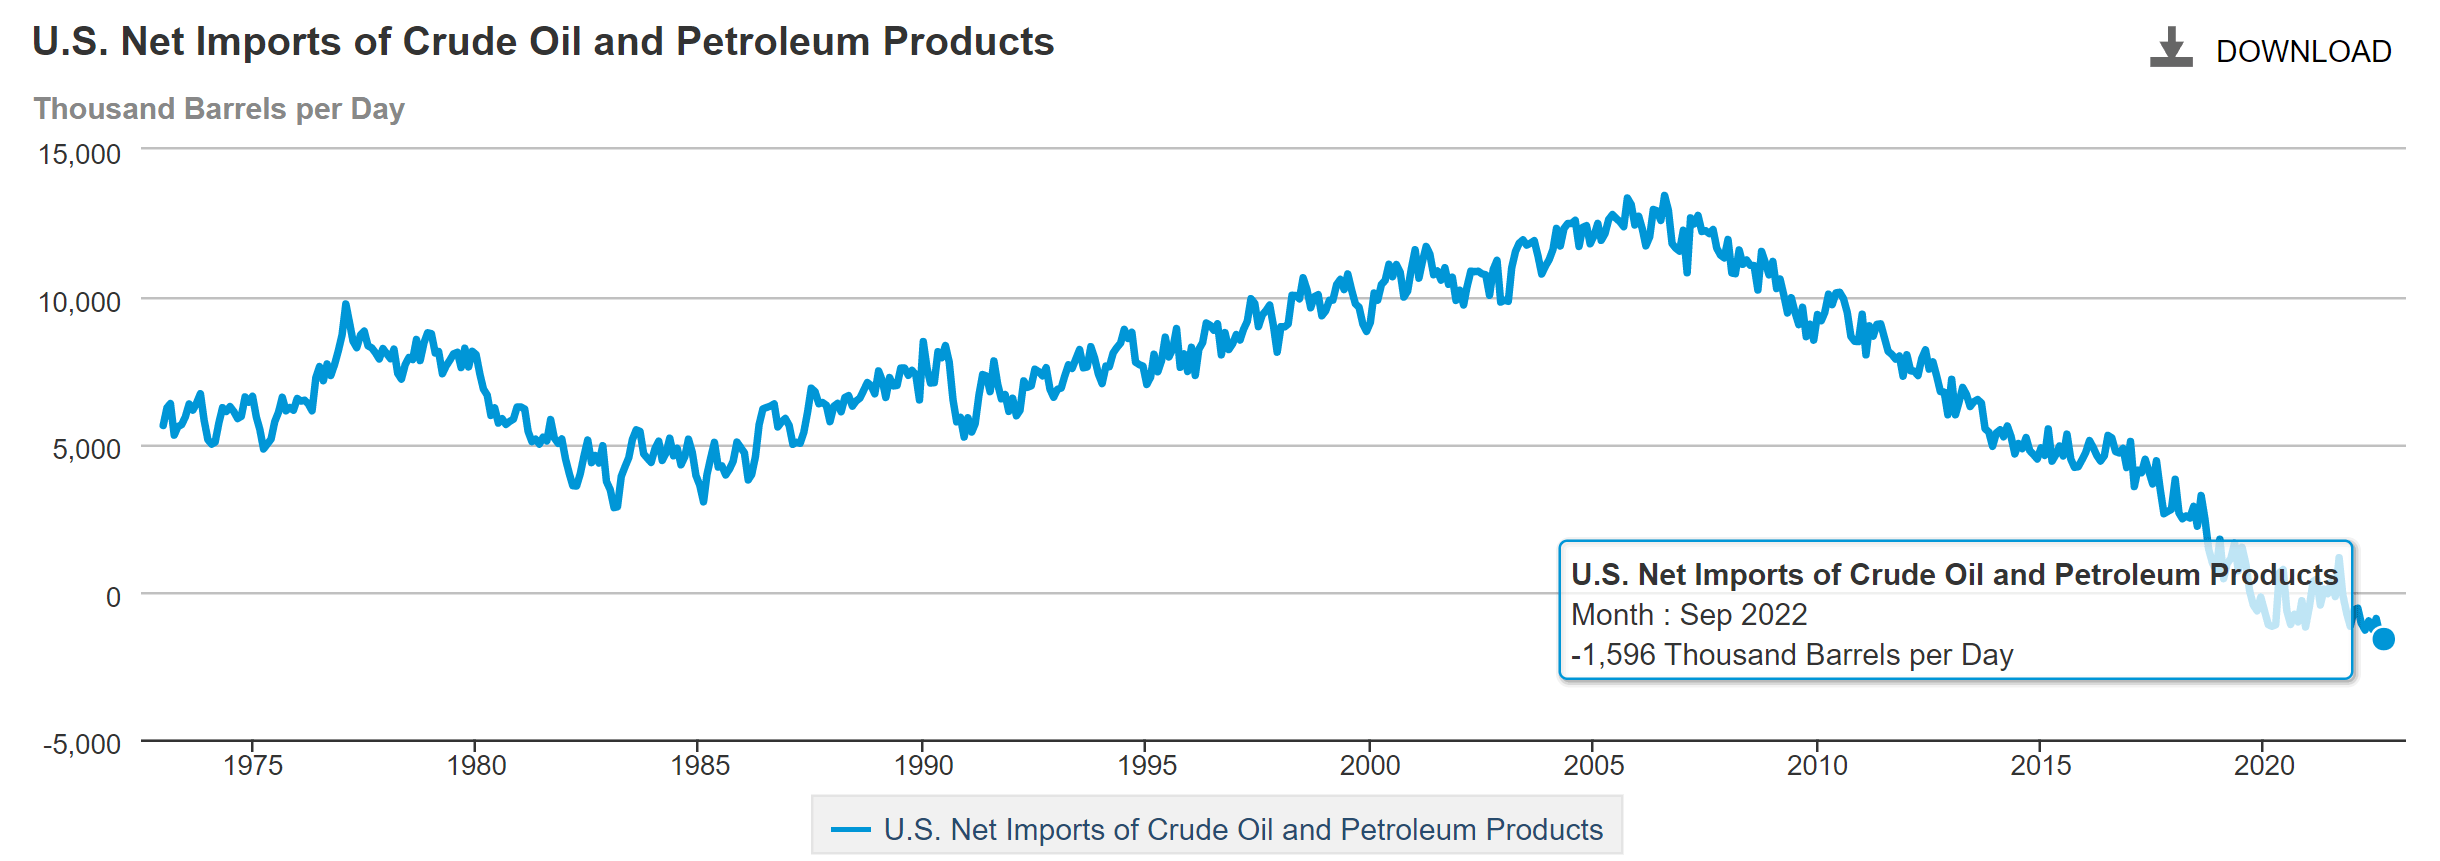
Source: EIA.gov
ET’s catalysts
In the remainder of this article, I will explain my main reasoning for part B of the thesis in the following order: the near-term catalysts, the strong and stable capital structure, and the valuation discounts.
And in this section, I will start with the catalysts. As just mentioned, industry-wide supply impediments and geopolitical factors are the main factors here. They have resulted in elevated demand for ET’s oil, natural gas, and natural gas liquids pipelines. ET is a leader in this space, with 120,000 miles of pipelines spanning across parts of the U.S. and Canada.
ET’s operations have been benefitting from higher volumes and also favorable pricing across all segments recently. And I expected this trend to persist in the years to come because of the catalysts just mentioned. To wit, in the past quarter, ET’s operations are, highlighted by record levels within the Midstream (19.1 million British thermal units), Crude Oil (4.6 million barrels), and Fractionators (averaged 940,000 barrels per day) units.
Finally, the addition of assets acquired in the Enable Midstream Partners deal (completed in December 2021) has started contributing. And I expect the contribution to further expand in the near future, as detailed in an earlier article.
Strong and stable capital structure
The following chart displays the capital structure of ET in the past 10 years. As seen, admittedly, ET’s debt burden has substantially increased, a source of concern for many investors. To wit, ET’s debt climbed from $21.7B in 2012 to more than $49B in 2022.
But its capital structure has maintained its strength and stability thanks to the profitability improvement (more on this later) and also the overall low borrowing rates in the past decade. To wit, its equity/EV ratio has been steady with an average of 39.5% in the past 10 years. And its current ratio of 40% is essentially on par with its 10-year average. Its Debt/EV ratio has a 10-year average of 64%. And the current value of 60% is actually below this average and also the level it started in 2012.
Looking ahead, I anticipate its capital structure to further improve given the catalysts mentioned above and also its robust profitability, as detailed next.
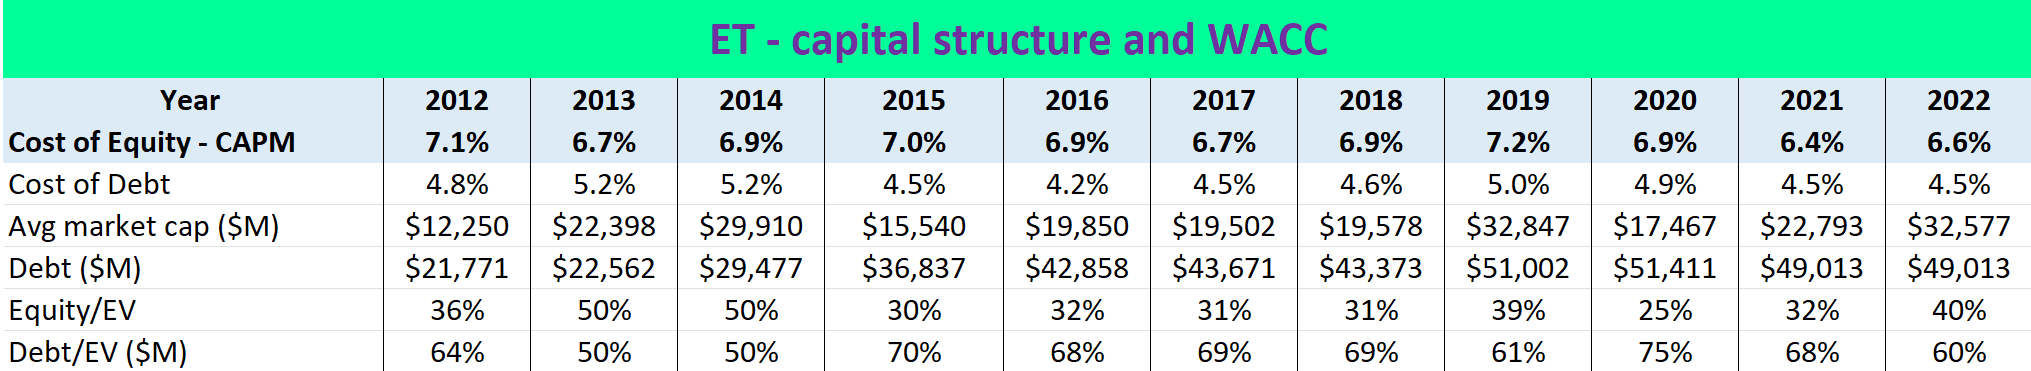
Source: author based on Seeking Alpha data
Robust profitability
To evaluate its profitability, let’s start with its cost of capital, as shown in the table below. Here, I applied the well-accepted CAPM model (capital asset pricing model) as detailed in my earlier articles. The key inputs are:
This analysis uses the Weighted Average Cost of Capital (“WACC”) to evaluate its cost of capital. The WACC is calculated as:
WACC = portion of equity * cost of equity + portion of debt * cost of debt * (1- tax rate)
And the next chart shows the WACC results. Note that the cost of equity, according to the CAPM model, is determined by the volatility of the stock (the beta) and the risk-free return (the 10-year treasury bond yield).
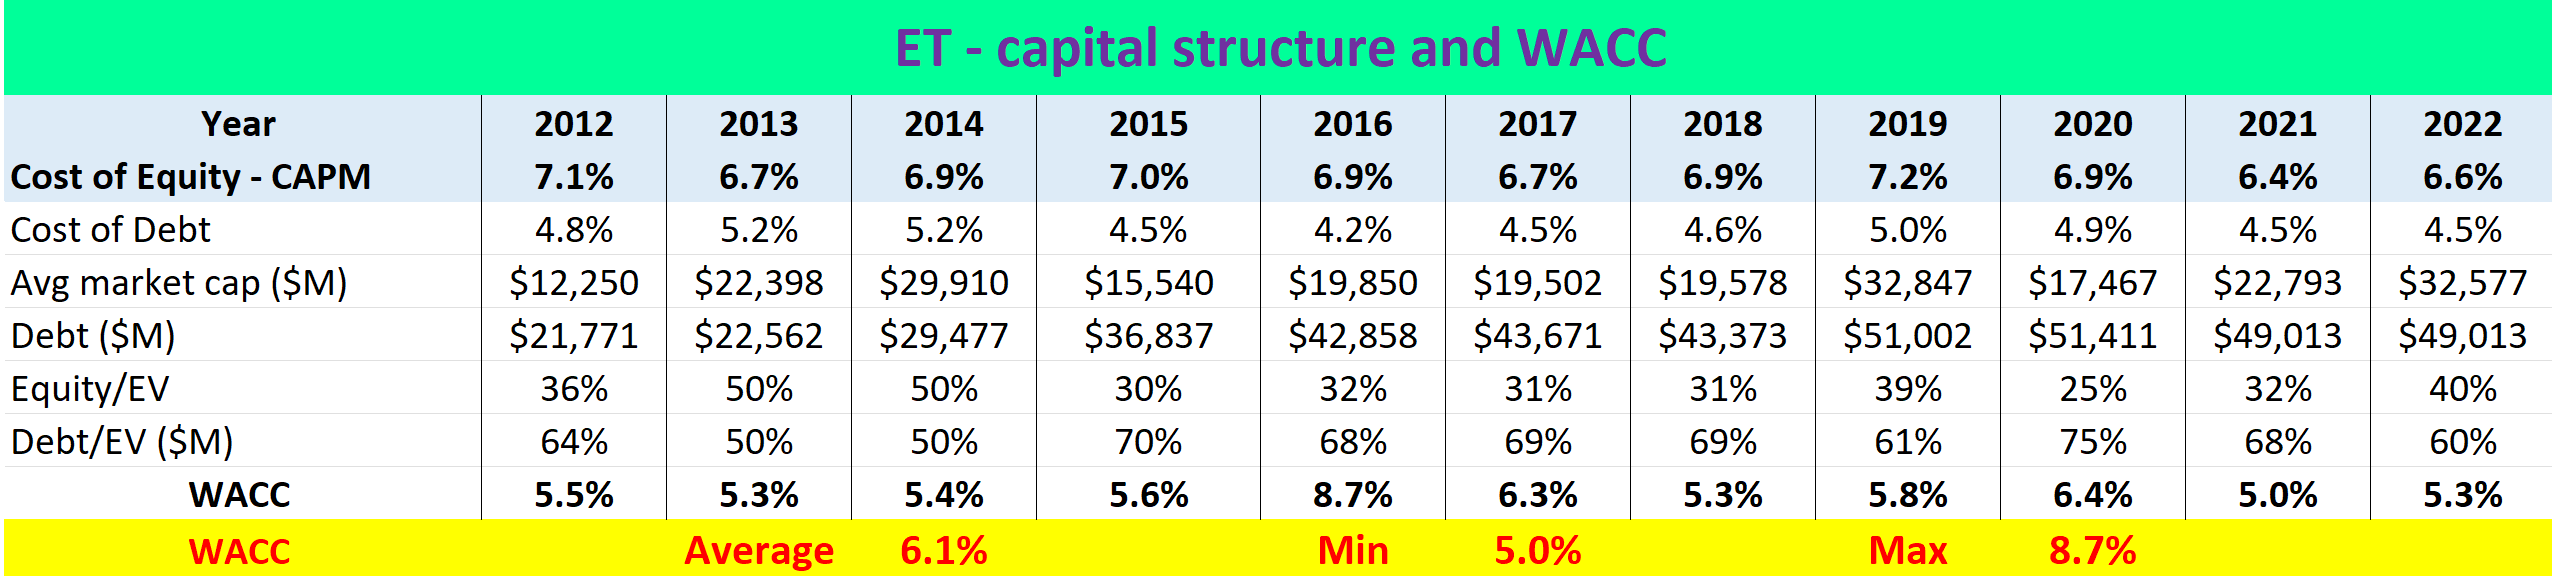
Source: author based on Seeking Alpha data
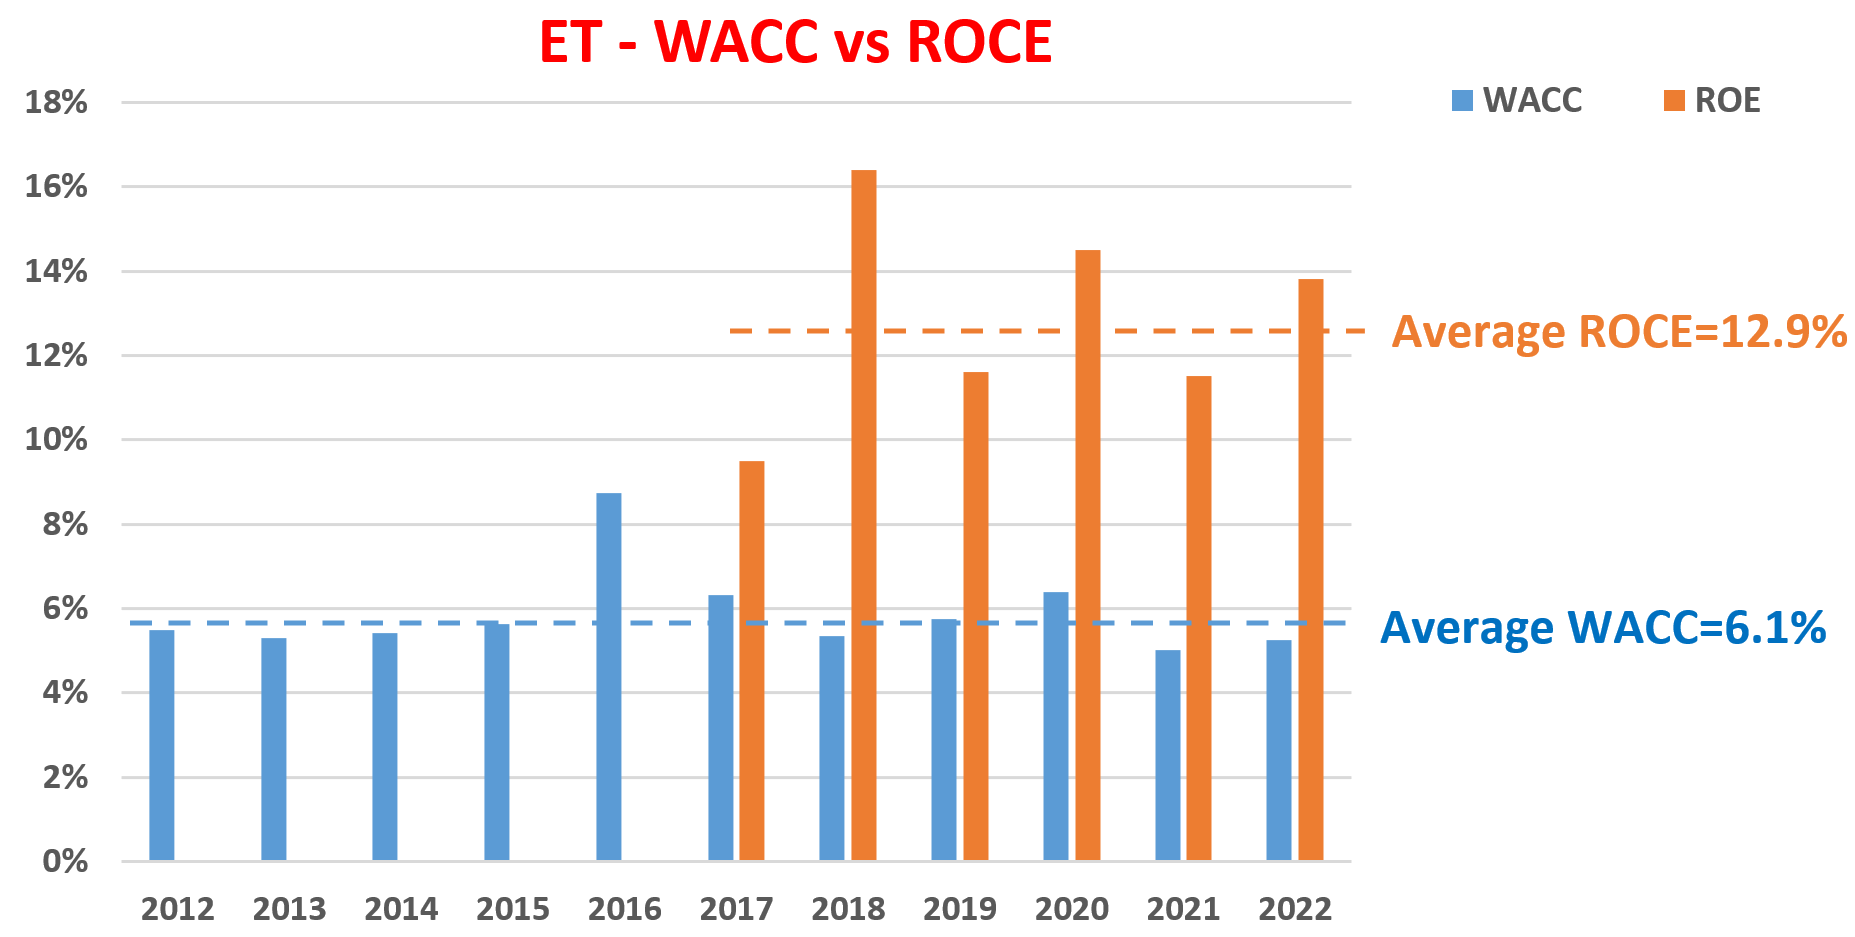
For the 10-year treasury bond rates, the annual averages on a monthly basis were used. As you can see from these results, the WACC for ET has fluctuated in a range between 5% to 8.7% in the past decade, with an average of 6.1%.
To put things in perspective, the next chart shows ET’s profitability measured by ROCE (return on capital employed). As you can see, its ROCE has been fluctuating in a healthy range between about 9% to 16% since 2017. And the average ROCE in the past six years since 2017 is 12.9%, more than double that of its WACC. I foresee such a wide gap between its ROCE and WACC would only further widen given the catalysts mentioned above and the macroscopic oil demand-supply imbalance.
Source: author based on Seeking Alpha data
Valuation and projected returns
In terms of P/E ratios, ET’s current P/E ratio is only 7.7x on an FWD PE basis. To provide a reference point, its median P/E in the past 10 years is about 11.5x. So, its current P/E is almost exactly discounted from its historical mean by 1/3.
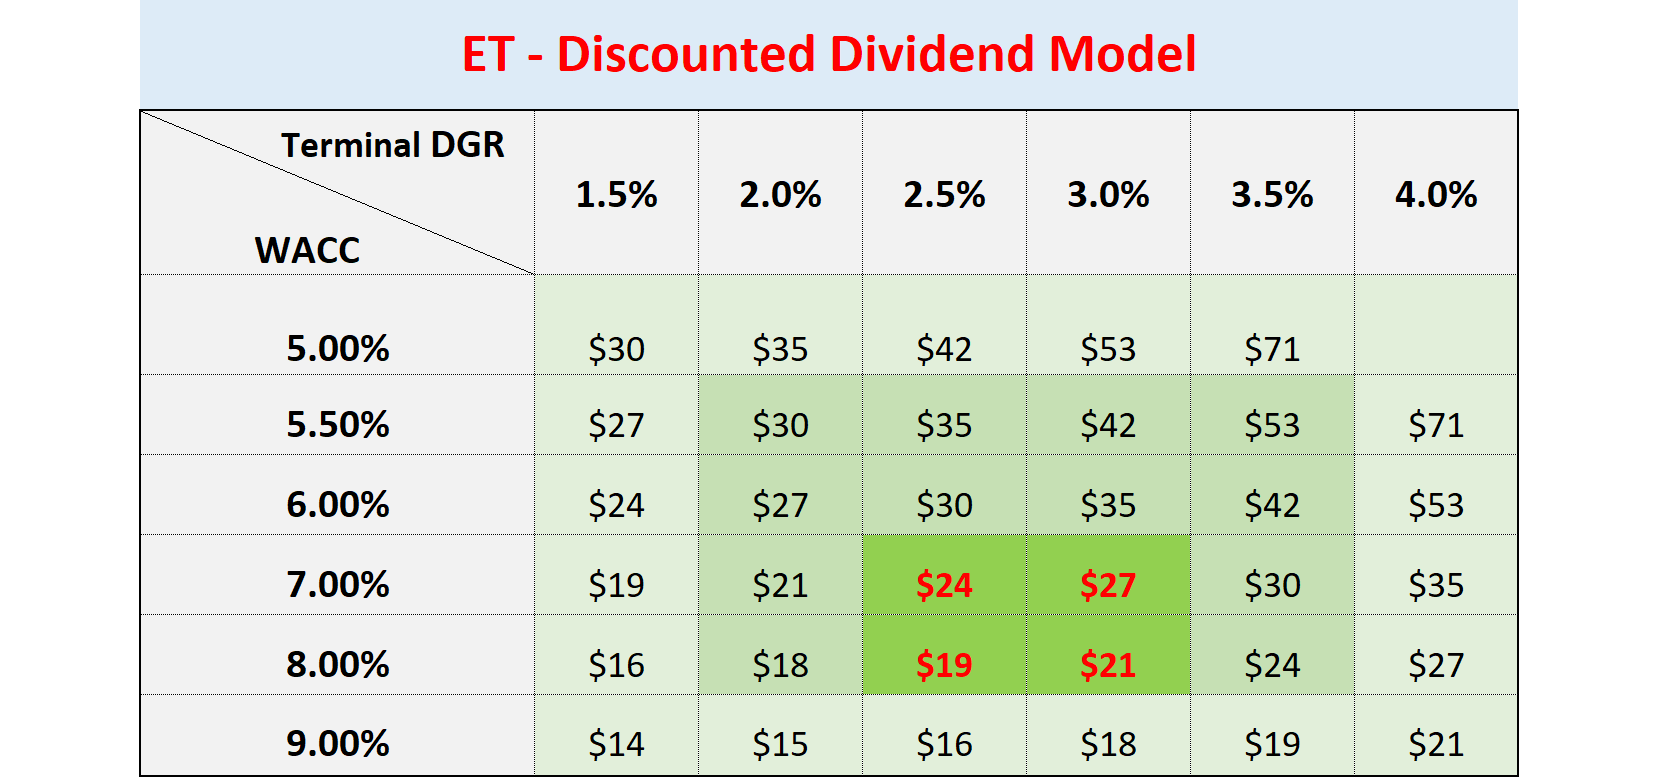
Given ET’s long dividend track record, it is a good idea to assess its valuation using a simple discounted dividend model (“DDM”) too, as shown in the next table below. As aforementioned, ET’s weighted WACC has been in the range of 5.0% to 8.7% in the past, with an average of 6.1%. And this is the range that is considered in the table. A few key observations:
- Even based on a conservative assumption of its terminal growth rates of 2.5% to 3.0%, essentially only to keep pace with inflation, the stock’s fair valuation should be in a range of $19 to $27 assuming future WACC is 1% ~ 2% higher than its historical mean of 6.1% because of higher interest rates.
- My projection for its fair value is around $23 per-share basis on a long-term growth rate of 2.5% to 3% and a WACC of around 7%. In this base case, its current price represents a margin of safety of about 97%.
- Even under the most unfavorable combination of 9% WACC and 1.5% terminal growth rates, its fair valuation would be about $14, still below its current price by a good margin.
Source: author based on Seeking Alpha data

Source: author based on Seeking Alpha data
Final thoughts and risks
Finally, investment in ET (and the energy sector in general) entails risks, both in the near term and also in the long term. In the near term, the Russian/Ukraine situation represents a large uncertainty. The duration and eventual outcome of the war are simply unpredictable and could create a large impact on the energy market. Furthermore, high oil and energy prices often translate into political issues and could cause policies that are not in favor of the energy sector (such as windfall taxes and regulations). Specific to ET, it’s been dealing with legal disputes almost constantly. These disputes could potentially lead to higher costs, progress delays, or even the shutdown of portions of its pipelines and ongoing projects. The recent protests against its Dakota Access pipeline provide one such example.
All told, my overall conclusion is that these above risks have been more than compensated by its profitability and valuation discount. As aforementioned, its ROCE has been in a healthy range between about 9% to 16% in recent years, with an average of 12.9%. This is more than double its average WACC of 6.1%. Such a wide gap between its ROCE and WACC leaves plenty of cushion for near-term profitability speedbumps.
In the meantime, its current valuation discount offers an enormous margin of safety. It is trading at 7.7x FW P/E multiple, too cheap to ignore both in relative and absolute terms. A simple discounted dividend model shows similarly large valuation discounts, even assuming some of the most unfavorable combinations of high WACC (say 9%) and lower growth rates (say 1.5% only).
Be the first to comment