

Justin Sullivan
I mentioned in July here, my research suggested QUALCOMM Incorporated (NASDAQ:QCOM) was getting close to “Strong Buy” territory, which I pegged at $120 per share. Well, Qualcomm breached this level in late September, and I have accumulated a decent-sized position in October.
The main reason I am comfortable owning Qualcomm long in my diversified and hedged portfolio comes down to basic GARP (growth-at-a-reasonable-price) investment rationale. You can now buy a high-margin, better-than-average growth business, at a valuation that is lower than S&P 500 average multiples of underlying operations and far cheaper than Big Tech peers. Where else can you find a nearly 3% dividend yield and P/E of 10x, from one of the top patent/royalty and semiconductor chip makers powering the fast-growing technology economy in America and the world? Plus, Qualcomm is busy entering new markets, where it could completely disrupt and steal market share in the not-too-distant future from Wall Street’s chip-industry giants including Intel (INTC), NVIDIA (NVDA) and Advanced Micro Devices (AMD).
To me, the whole investment setup today (under $120 a share) is screaming average to well-above average stock market returns will continue for Qualcomm shareholders, just like the past 12 months have outlined. Honestly, only Apple (AAPL) has been able to squeak out improved total return performance for investors since October 2021, pictured below. The Big Tech peer sort group for this article also includes major semiconductor industry competitors NVIDIA, AMD, Intel, Micron (MU), and Taiwan Semiconductor (TSM), alongside other high-margin, high-growth tech leaders Microsoft (MSFT), Tesla (TSLA), Adobe (ADBE), Alphabet/Google (GOOG, GOOGL), and Meta Platforms (META).
YCharts – Big Tech, Total Investment Returns, Trailing 12 Months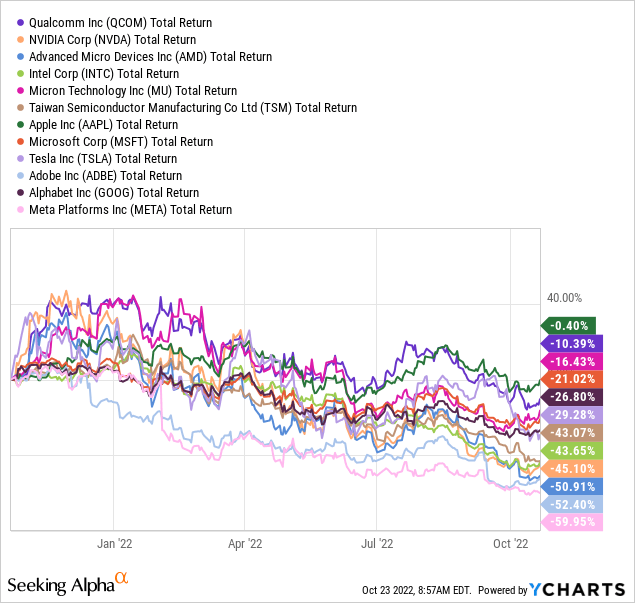
The Undervaluation Story
The primary reason to buy, in my mind at least, is Qualcomm’s shrinking valuation on an exceptional growth rate in 2022. Usually, companies experiencing strong expansion get repriced with a higher valuation, not a lower one. Investors are so overwhelmingly concerned about a recession, they have decided to discount declining results at Qualcomm without significant real-world evidence to back up the idea.
It’s kind of the opposite of investors overvaluing Big Tech in 2021 as a sentiment decision, putting extremely high valuation multiples on operating growth that was stagnating. When you can purchase a stock witnessing an imploding valuation while the business is growing quickly, the odds favor major trading/investing profits when Wall Street is thinking straight again. You could say the marketplace is being “irrational” today, but it is really evidence of a mass-psychology temper tantrum.
Below is a chart of Qualcomm’s decade-low valuation on trailing earnings (10.2x) and sales (3.1x). All told, you are getting a top-performing business with important patents underpinning our new-age economy, at a valuation the same or lower than the S&P 500 blue-chip index.
YCharts – Qualcomm, Price to Trailing Earnings, Cash Flow, Sales, Past 10 Years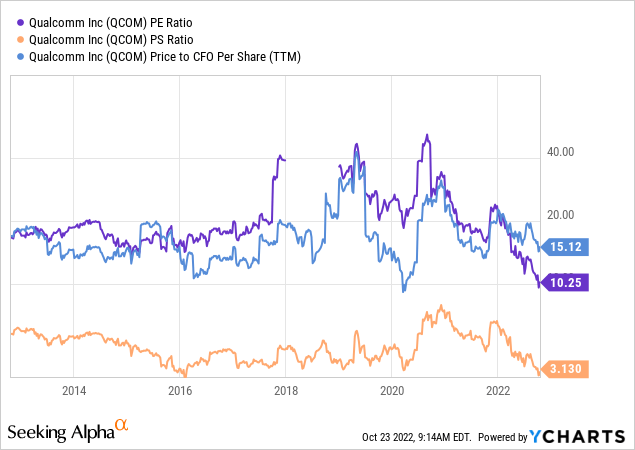
On forward 1-year EPS ratios, Qualcomm is the least expensive (8.6x) in our Big Tech peer group. Spiking revenue and income in 2022 have combined with a sharp stock price pullback (a rare reaction).
YCharts – Big Tech, Forward 1-Year P/E Ratios, Since October 2021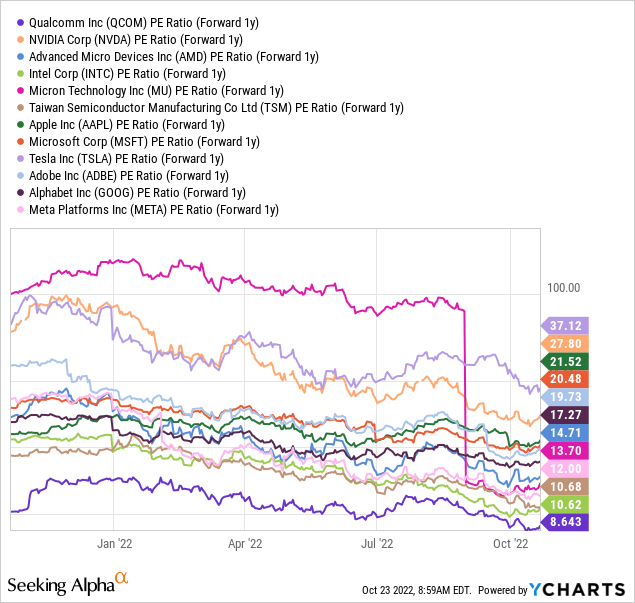
Including net debt (subtracting cash holdings from total debt) on top of its equity capitalization, Qualcomm’s enterprise value vs. forward estimated EBITDA ratio of 7.2x is one of the cheapest in the Big Tech peer group. The median average for comparable businesses is closer to 11x currently. For Qualcomm, this 7.2x forecast is a huge (greater than 50%) discount to its mean average of EV to trailing EBITDA around 16x over the past decade.
YCharts – Big Tech, Forward EV to EBITDA Estimates, Since October 2021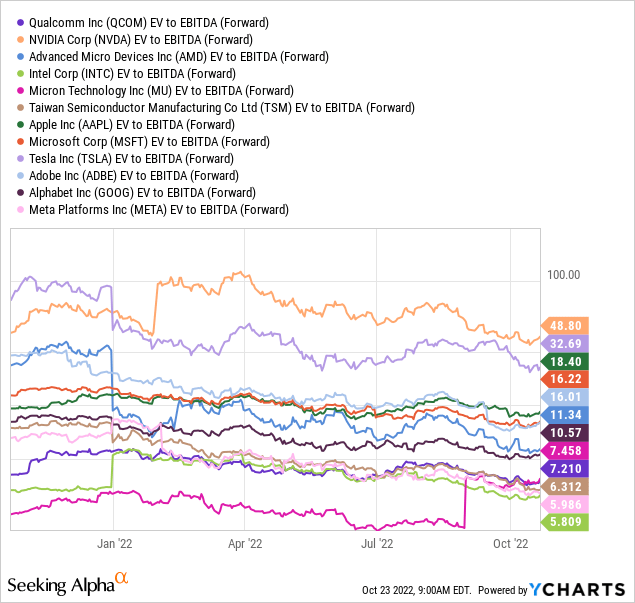
Again, EV to forward revenues is near the bottom of the group list. A multiple of 3x is well under the peer median average of 4.25x, and only a minor premium to the S&P 500 number a little under 3x presently. The decade mean average of EV to trailing sales for Qualcomm is 4.3x, translating into the likelihood of a 30%-Off Sale for new buyers under $120.
YCharts – Big Tech, Forward EV to Revenue Estimates, Since October 2021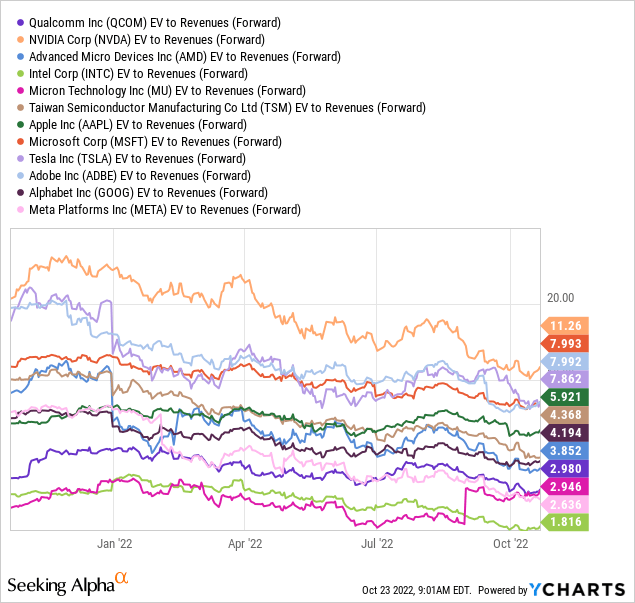
Trailing free cash flow yield is roughly tied with Taiwan Semiconductor around 5%, with only the Meta Platforms “bust” valuation producing a dramatically better number. Wall Street is shunning CEO Zuckerberg‘s metaverse experiment with shareholder capital, a bottomless pit of capital spending with little revenue to date.
YCharts – Big Tech, Trailing Free Cash Flow Yields, Since October 2021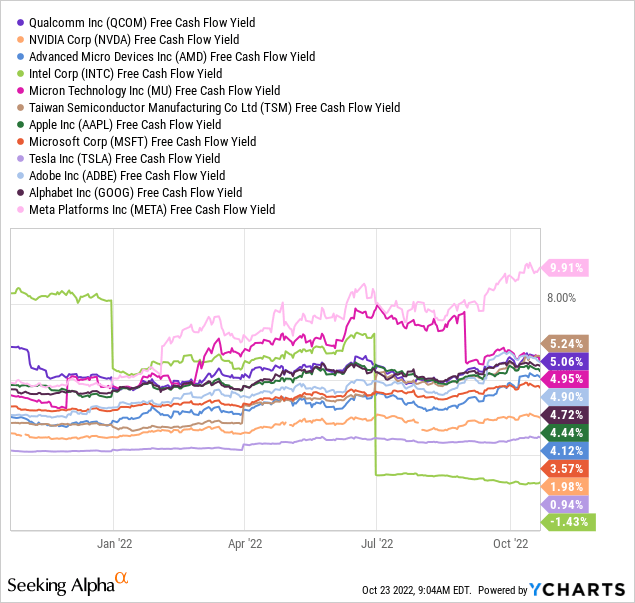
For income investors, Qualcomm’s trailing dividend yield of 2.47% has only been bested by a wide margin owning Intel’s imploding equity price and operating business weakness. On a forward basis cash yield it is closer to 2.6% vs. the S&P 500 rate of 1.7%.
YCharts – Big Tech, Trailing Annual Dividend Yields, Since October 2021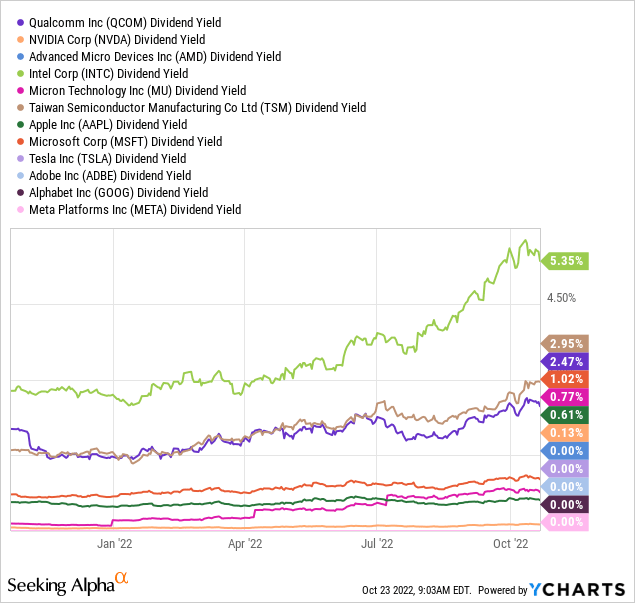
For income investors focused on long-term payout growth, Qualcomm is a leading Big Tech pick (where few related enterprises pay any dividend). Below is a graph of the TRIPLE in annual cash distributions per share over the past decade. The current $3.00 payout represents just 25% of projected profits over the next 12 months. Plenty of room exists to expand the dividend at 10% to 15% annual rates far into the future, if upside earnings surprises are coming in 2023-24. Mathematically, another triple in the payout over a decade (which the company could theoretically afford in a few years) would be generating almost 8% annually in dividends for today’s buyer holding for 10 years.
Seeking Alpha – Qualcomm Dividend Payouts, Past 11 Years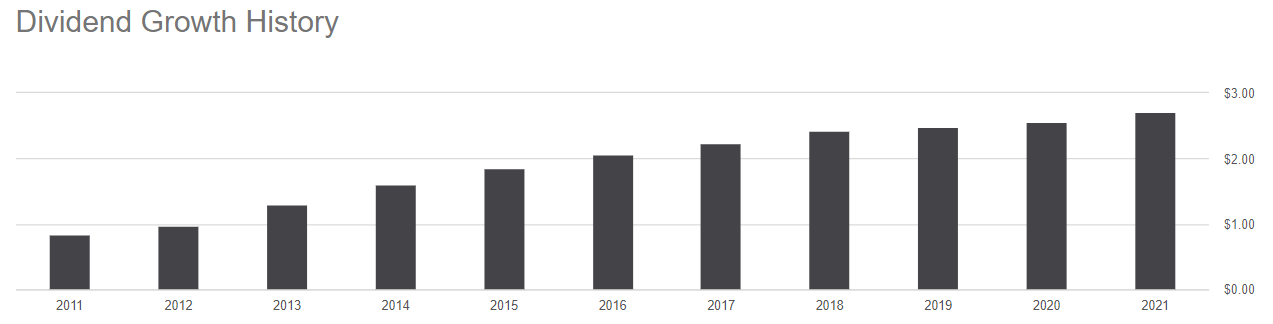
Undeniable Growth Future
If you weren’t paying attention, June quarter growth for Qualcomm was one of the strongest rates on any large-cap corporation in America. Revenue rose +37% YoY and EPS climbed +50% vs. the same quarter in 2021. Below are some slides taken from the Q3 earnings presentation (QCOM’s fiscal year ends in September) highlighting the growth story for the company. New product introductions and disruptive marketplace entries are being made in the automotive and IoT sectors, upgrades to existing and top-of-the-line Snapdragon chips for smartphones are rolling out, and record profits will support even greater R&D efforts (including PC/server processor development to attack the duopoly hold of Intel and AMD), while organically financing expanded production levels. Financially speaking, Qualcomm is a compounding machine for owners.
Qualcomm Q3 Earnings Presentation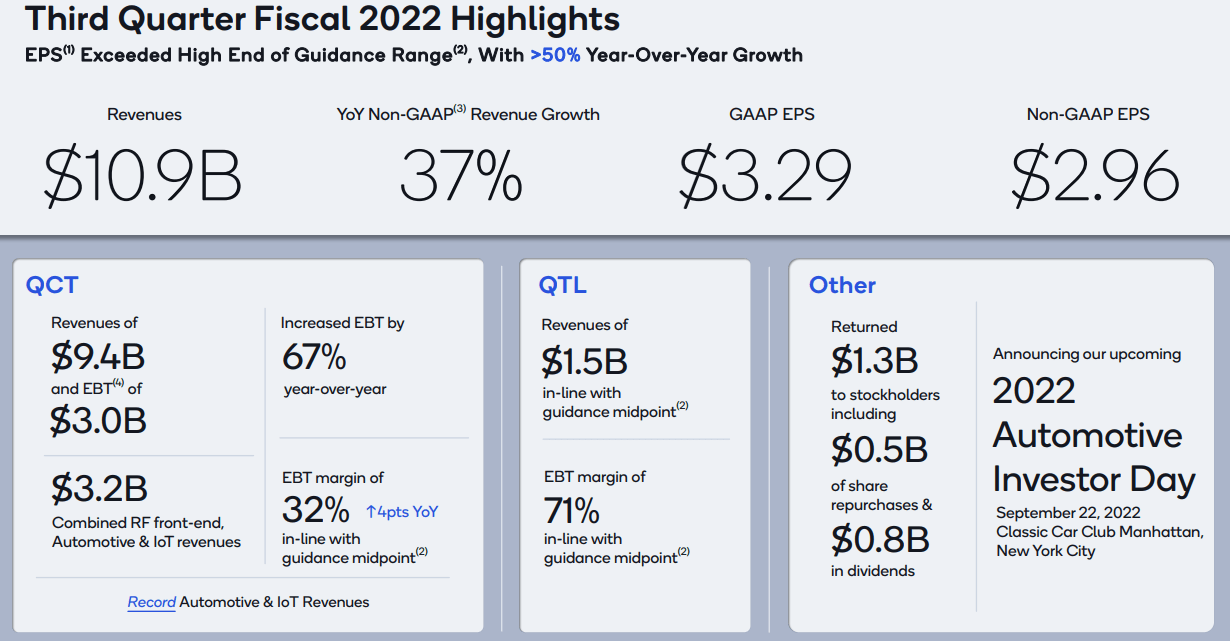
Qualcomm Q3 Earnings Presentation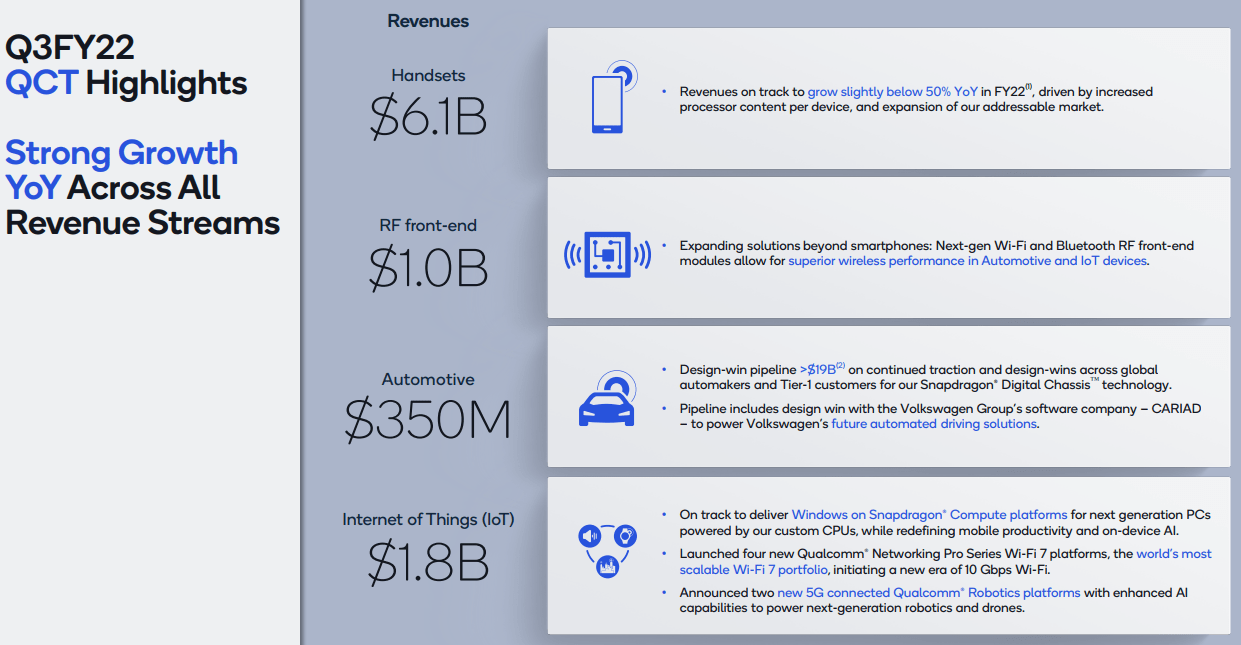
Qualcomm Q3 Earnings Presentation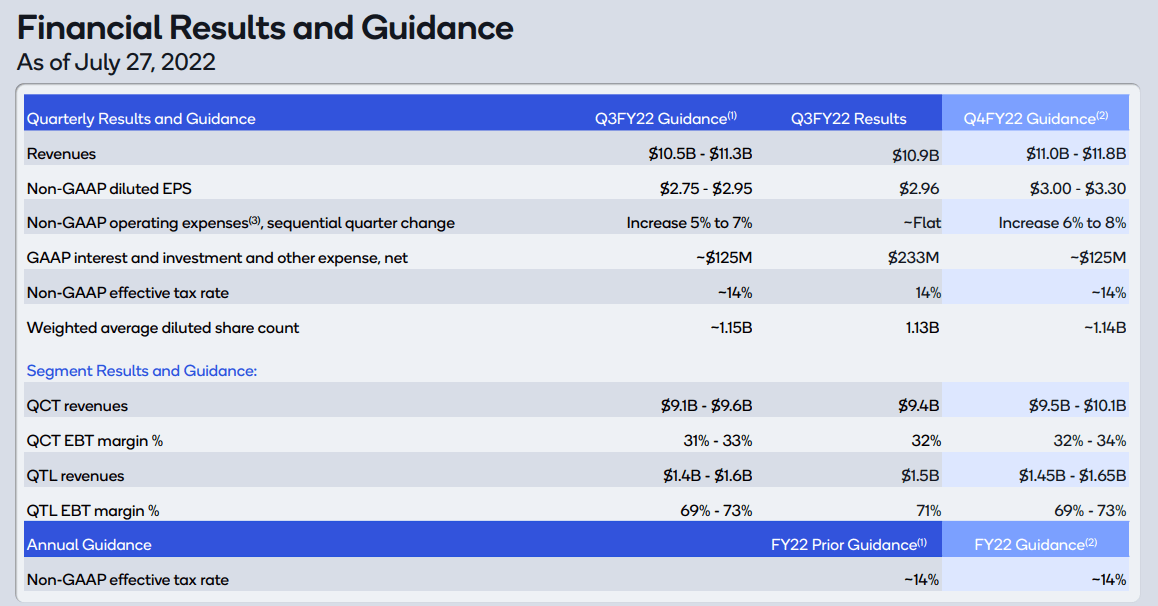
Qualcomm Q3 Earnings Presentation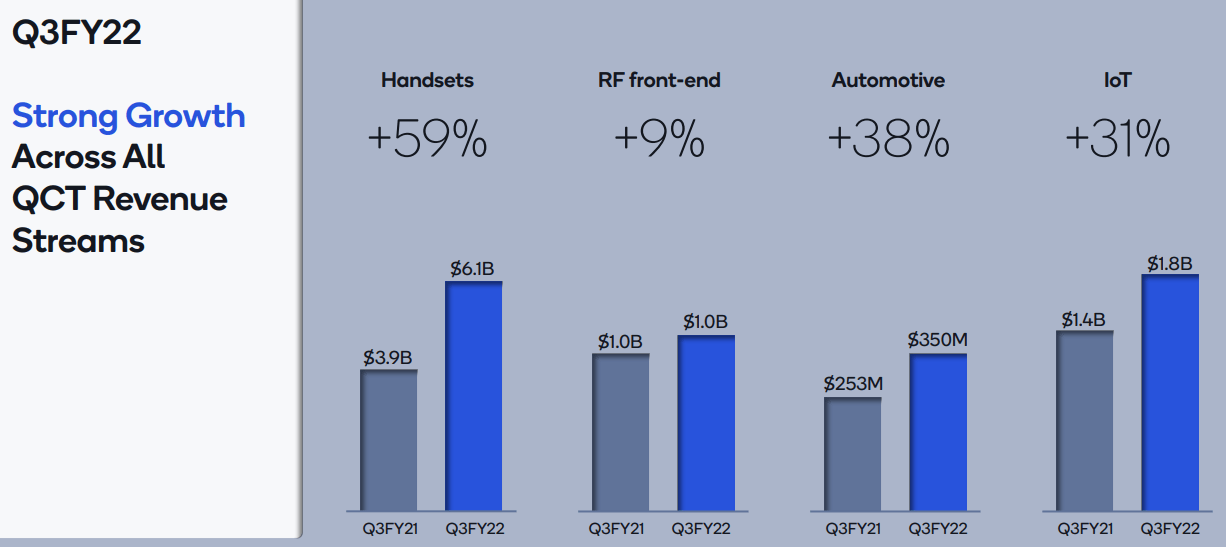
Qualcomm Q3 Earnings Presentation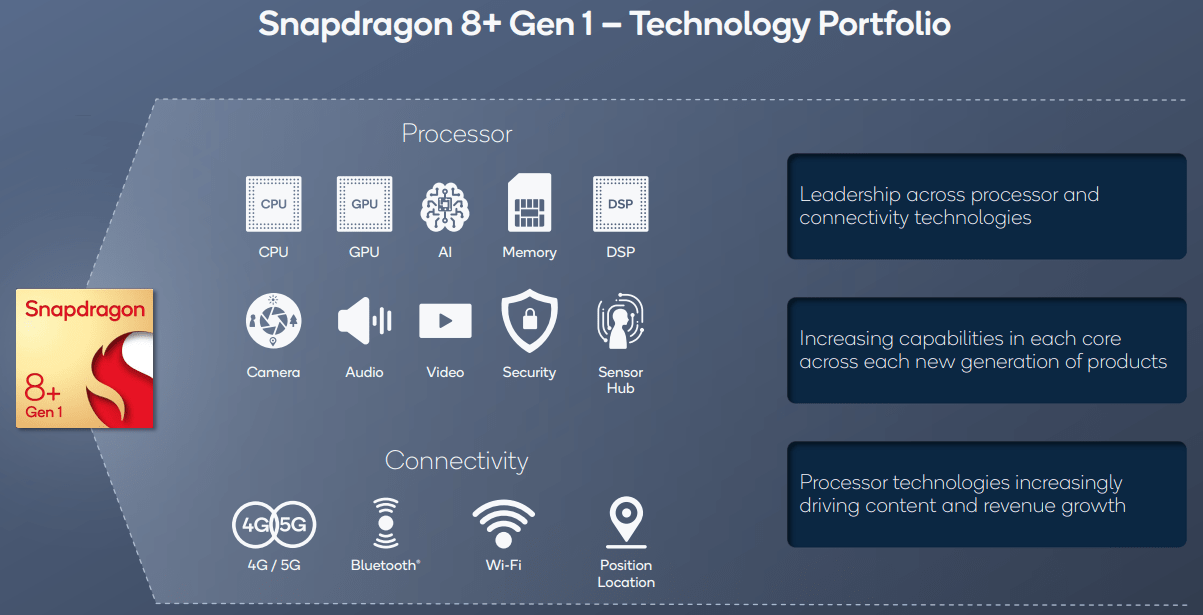
Qualcomm Q3 Earnings Presentation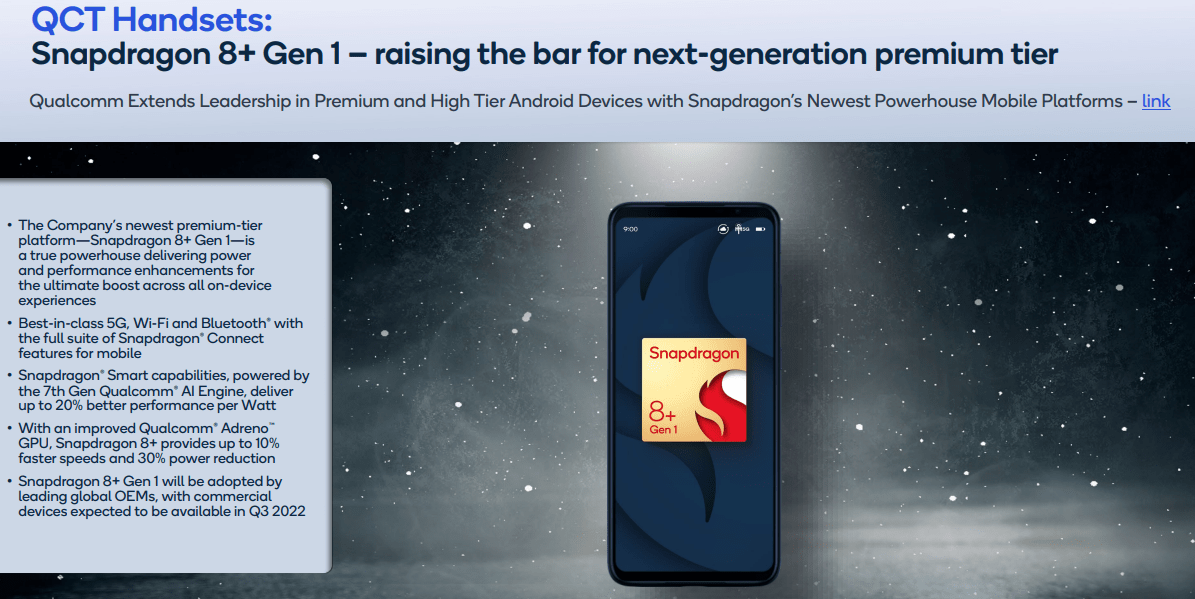
Qualcomm Q3 Earnings Presentation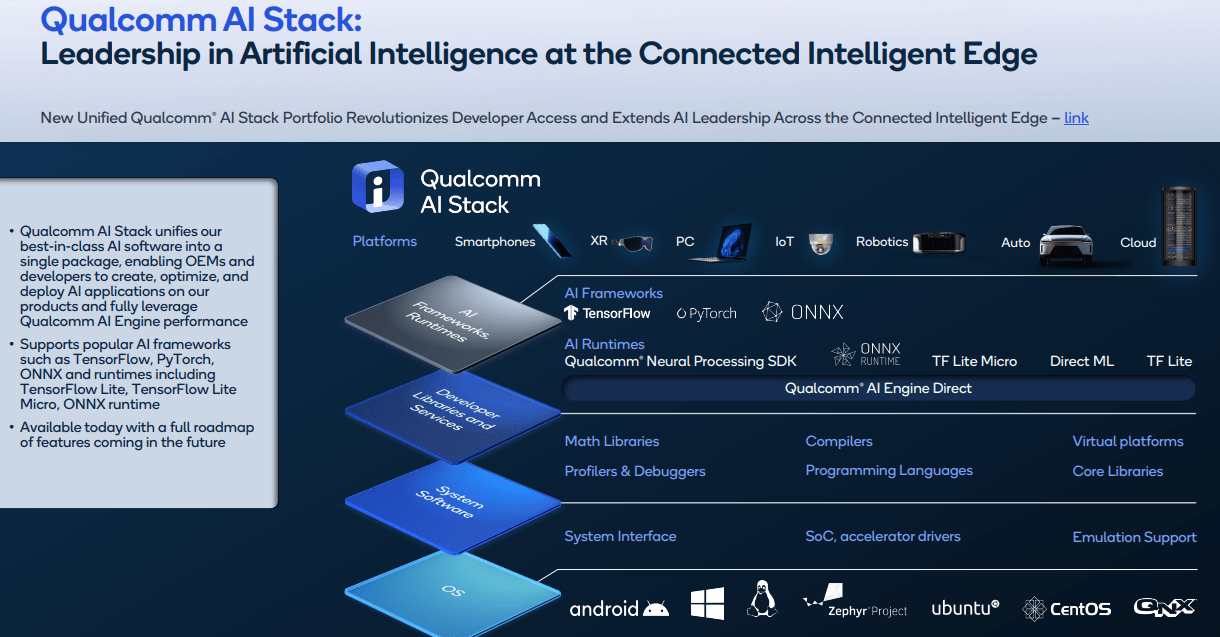
Qualcomm Q3 Earnings Presentation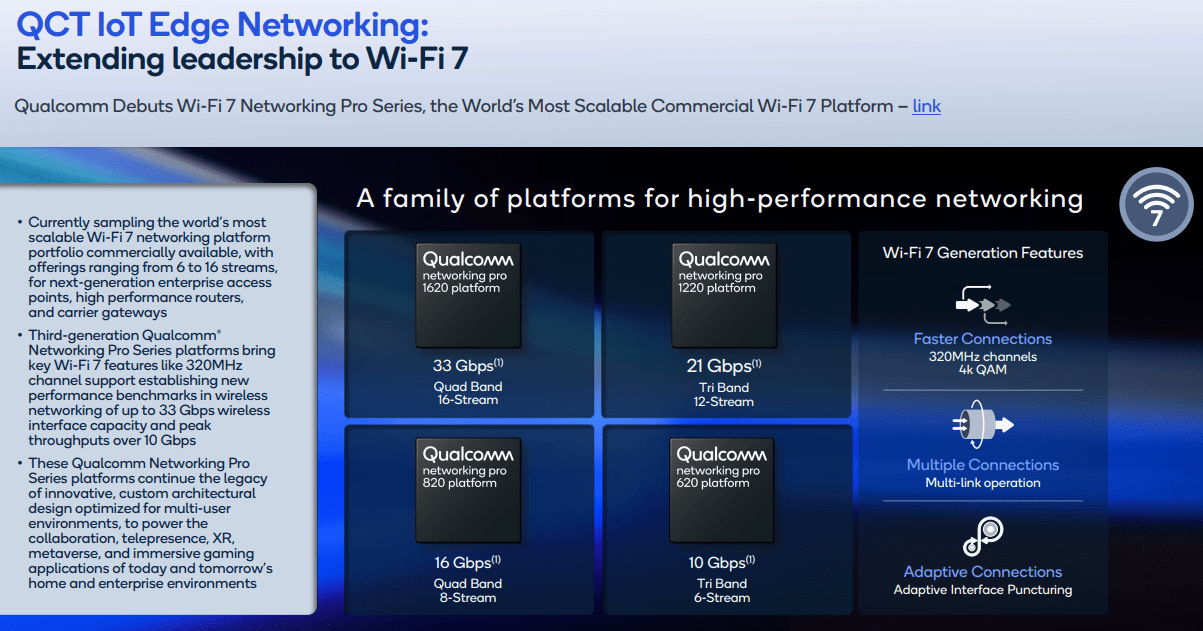
Gross profit margins and net income score near the top of the peer group, pictured below. High growth on high margins is the ideal investment setup. However, your ability to acquire a powerful growth compounder on the cheap is an extremely rare occurrence.
YCharts – Big Tech, Gross Profit Margins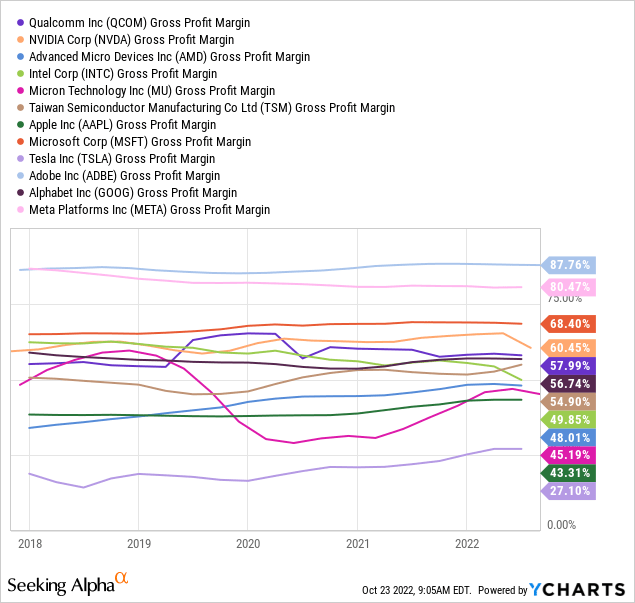
YCharts – Big Tech, Net Income Margins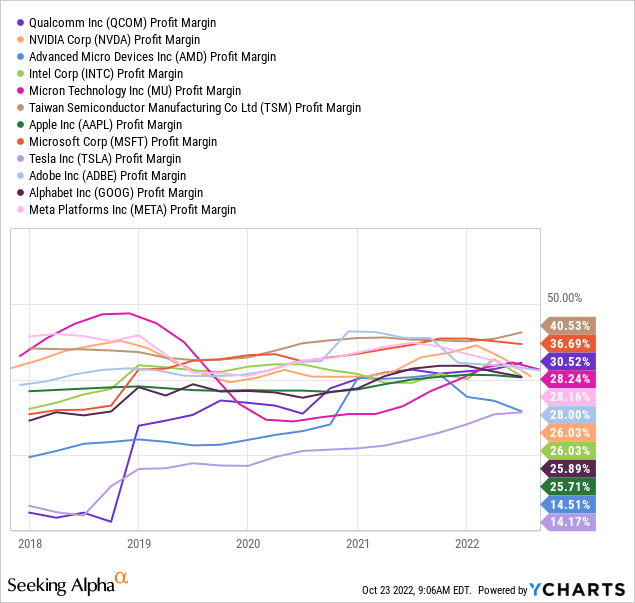
Looking at EPS growth between 2021 and 2025, Qualcomm is projected by analysts to have one of the richest results of any Big Tech name. Below is a graph of this superb advance, with Wall Street anticipating a slowdown after this year. My view is conventional wisdom’s expected reduction in growth may turn out to be overly pessimistic.
YCharts – Big Tech, Analyst EPS Growth Estimates from 2021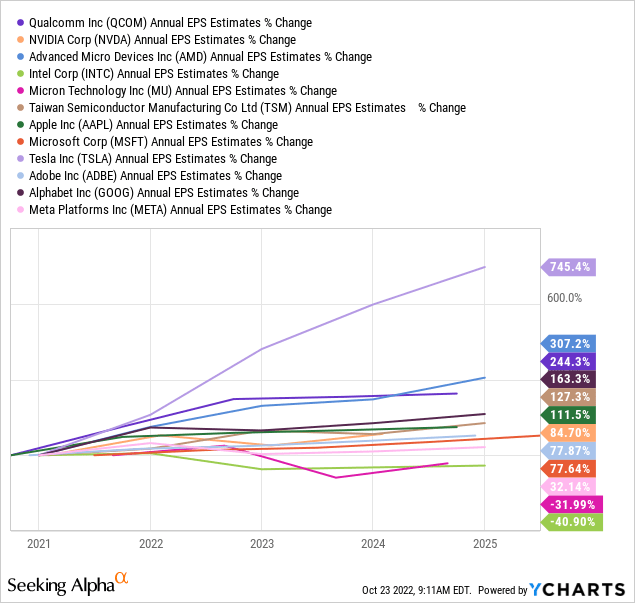
Below is the Wall Street consensus forecast specifically for Qualcomm EPS and sales between 2022-24. In essence, a weaker global economy and smartphone demand slowdown are the macroeconomic prediction. If either forecast proves overly bearish, Qualcomm could continue to barrel ahead with 10%+ growth, meaning the valuation today is even more absurd in favor of buyers.
Seeking Alpha – Qualcomm, Analyst Estimates on October 23rd, 2022 for FYs 2022-24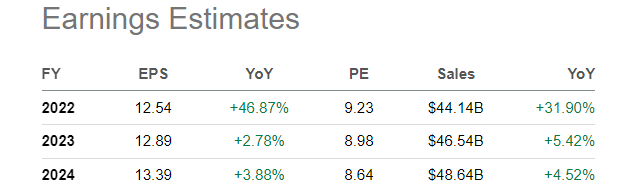
Technical Analysis
The $105 price in early October was a multi-year low, in stark contrast to exploding operating results. The good news is chart momentum patterns are not very bearish. Below is an 18-month trading chart of daily price and volume activity. Intermediate-term trends in the Accumulation/Distribution Line, Negative Volume Index, and On Balance Volume are actually fairly positive. Despite the price decline, a trend of more buyers than sellers is clearly present. For example, price has broken below last October’s $120 low (dividend adjusted), but all three momentum indicators are solidly higher over the past 12 months. My read of the situation is Qualcomm maintains a very healthy technical foundation, which should support rising prices over time.
Stockcharts.com – Qualcomm, 18 Months of Daily Changes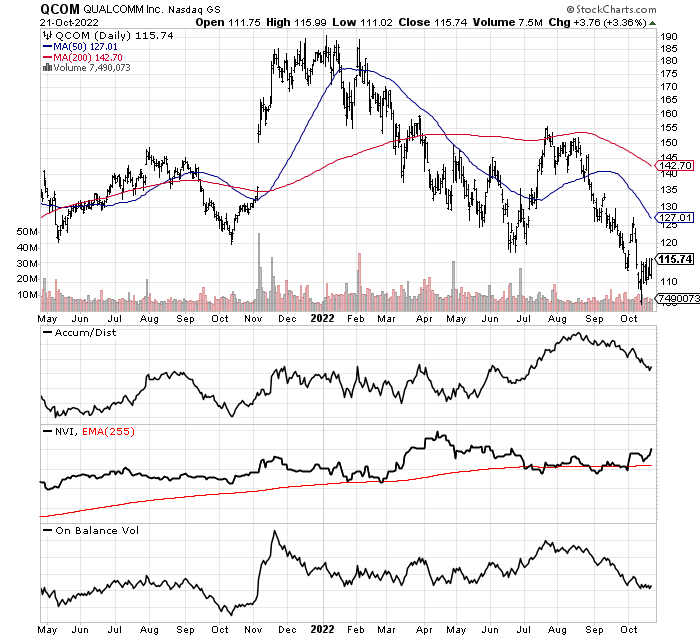
In terms of GARP logic, which I try to apply to most of my bullish suggestions on Seeking Alpha, Qualcomm under $120 is approaching the same level of personal interest as my unrelated-industry pick of Coca-Cola Consolidated (COKE), a beverage bottler in the Southeastern U.S. You can read my March 2021 story here, which discussed why it was a smart time to buy COKE when a clear undervaluation on trailing results intersected robust future growth prospects. Below is a graph of the solid outperformance advance by COKE since this article posted 19 months ago, with a double in the stock price over the following 8 months.
StockCharts.com – Coca-Cola Consolidated, 2 Year Chart with Author Reference Points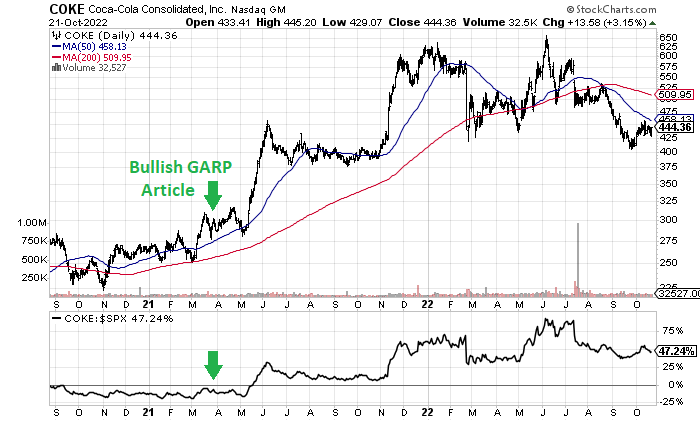
Final Thoughts
Seeking Alpha’s Quant Ranking is also quite positive, despite a horrific equity price decline in the semiconductor sector generally during 2022. The overall computer-based sort of earnings momentum and stock trading action is nearly a top 10% position out of 4,713 stocks screened currently, pictured below.
Seeking Alpha – Qualcomm Quant Ranking, October 23rd, 202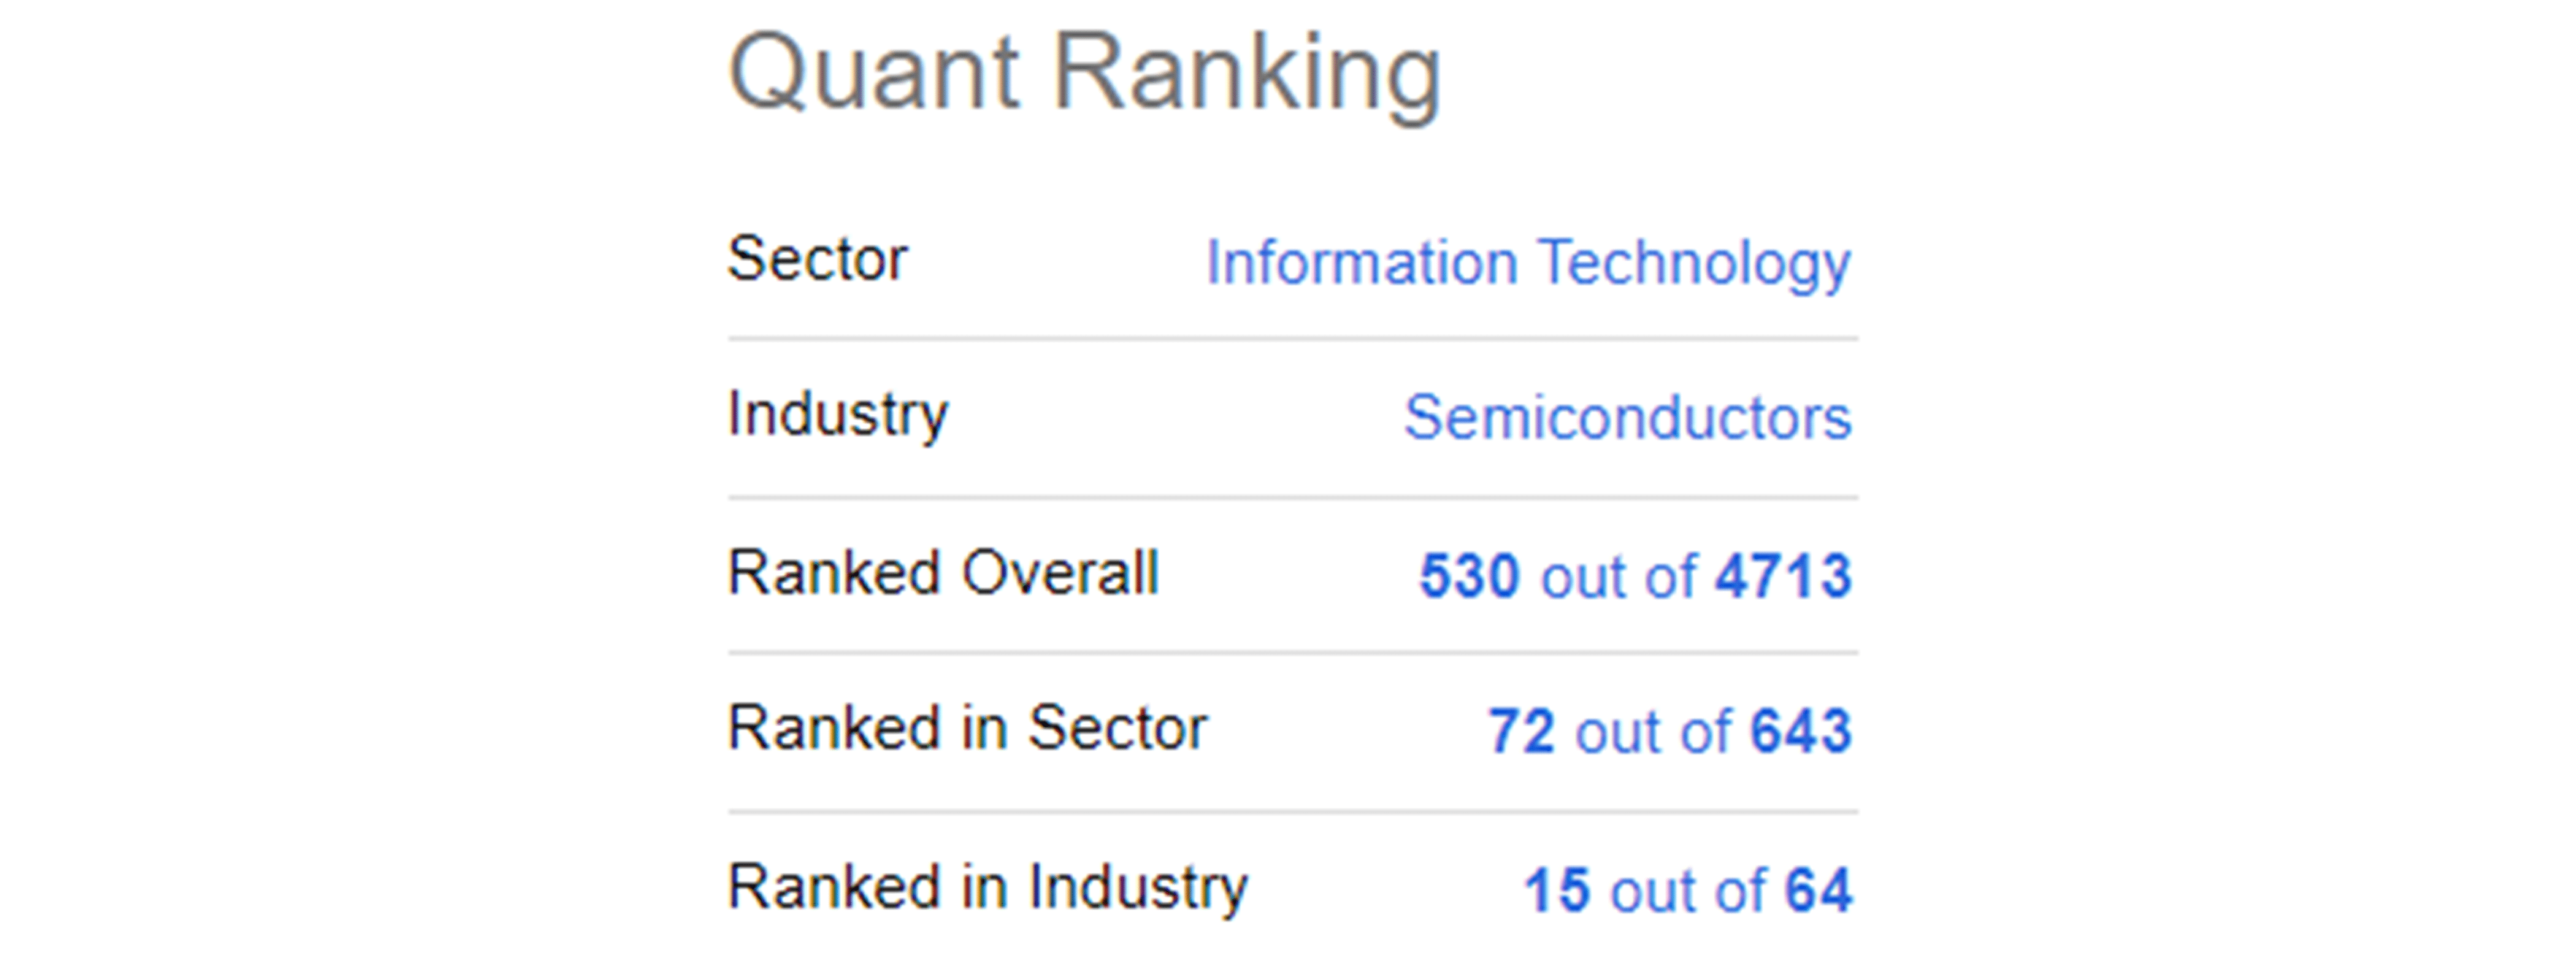
Remember, no stock pick is risk free. There are some negative developments to worry about and contemplate in your investment decision making. First, new U.S. government regulations and restrictions on advanced chip and critical equipment sales to China (an effort to prevent military upgrades) have appeared over the last few months, creating investor skittishness in all the major semiconductor names. Contributor Stone Fox Capital wrote an article last week here, explaining the likely muted impact on Qualcomm directly. Second, a lawsuit has been filed by ARM over new processors being designed and tested to compete directly with Intel and AMD product in servers, laptops and PCs. A great background piece on the patent infringement lawsuit was written by contributor David Lerner weeks ago here.
Both obstacles should definitely be watched closely for more information. However, I do not feel either of these forward-looking issues will have a material impact on sales or profitability in general. They may lower growth rates for the whole company on the periphery in 2023-24, but Qualcomm’s core operations serving the wireless smartphone market should be largely untouched (40% of 2021 company sales were made to China/Hong Kong OEMs).
My bottom-line view is Qualcomm may deliver the same long-term business growth rates (15% annually over 5-10 years) as other popular investor picks like NVIDIA and AMD in the semiconductor industry. Yet, you can purchase this bright future at 30% to 60% discounts on numerous price/valuation data points, especially income generation. That’s what I call a bargain buy for intelligent portfolio designers.
What’s the immediate downside risk? My thinking is a share price drop to $100 and a P/E under 8x would be an incredible discount to the overall market (P/E above 20x) and semiconductor industry (P/E of 16x) absent a major specific to Qualcomm bearish news event.
On the bullish side of the equation, if a deep recession is avoided next year, and the company can hit current analysts estimates, upside back to all-time highs around $200 is not out of the question in 12-18 months. A reversal from widespread investor pessimism over semi names to relief and eventually a little optimism could vault the valuation on earnings closer to 20x.
So, assuming a stock market crash is not our future the rest of 2022, I place downside “total return” risk potential at -15% during the next 12 months vs. theoretical upside reward of +80% in a best-case scenario. This risk/reward analysis suggests Qualcomm is a Strong Buy currently.
Thanks for reading. Please consider this article a first step in your due diligence process. Consulting with a registered and experienced investment advisor is recommended before making any trade.
Be the first to comment