

Douglas Rissing
The announcement from the Federal Reserve of a .50% rate increase was something I think most reasonable investors would agree was expected. What the market didn’t plan for was their message of needing unemployment to rise more, inflation increasing, and expectations of lower GDP growth.
Even worse, the Fed has now signaled that things need to get much worse and that means interest rates will need to increase until that happens. This means that we can expect to see more weakness in the stock market because the returns of safer investments have grown so quickly that many investors would be willing to exchange many of their current investments for bonds and CDs.
In short, this recent meeting has sent a clear signal that those who were optimistic about rate improvements starting by the end of 2023 are likely very wrong.
John and Jane recently transferred money to their local credit union which is currently offering a 48-month term with a 5% yield. Although this may seem like an overly aggressive CD rate to offer, it is telling of just how far the Fed will need to go before it gets the results it wants.
Background
For those interested in John and Jane’s full background, please click the following link here for the last time I published their full story. The details below are updated for 2022.
- This is a real portfolio with actual shares being traded.
- I am not a financial advisor and merely provide guidance based on a relationship that goes back several years.
- John retired in January 2018 and now only collects Social Security income as his regular source of income.
- Jane officially retired at the beginning of 2021, and she is collecting Social Security as her only regular source of income.
- John and Jane have decided to start taking draws from the Taxable Account and John’s Traditional IRA to the tune of $1,000/month each. These draws are currently covered in full by the dividends generated in each account.
- John and Jane have other investments outside of what I manage. These investments primarily consist of minimal-risk bonds and low-yield certificates.
- John and Jane have no debt and no monthly payments other than basic recurring bills such as water, power, property taxes, etc.
I started helping John and Jane with their retirement accounts because I was infuriated by the fees their previous financial advisor was charging them. I do not charge John and Jane for anything that I do, and all I have asked of them is that they allow me to write about their portfolio anonymously in order to help spread knowledge and to make me a better investor in the process.
Generating a stable and growing dividend income is the primary focus of this portfolio, and capital appreciation is the least important characteristic. Providing John and Jane with as much certainty in their retirement remains the primary objective.
Dividend Decreases
No stocks in Jane’s Traditional or Roth IRA paid a decreased dividend during the month of November.
Dividend And Distribution Increases
- Agree Realty (ADC)
- Concentrix (CNXC)
- Emera (OTCPK:EMRAF)
- Verizon (VZ).
**It should be noted that I missed the VZ dividend increase in the Taxable Account article (this was because we increased the size of the position considerably so I didn’t notice the benefit of the small increase.
Agree Realty
ADC has proven to be a resilient company and when we factor in the regular dividend increases and monthly payout it makes it difficult to ignore. As with many companies in John and Jane’s portfolio, ADC represents a holding that moves within a tight dividend yield of 3.5% up to 4.5%. We continue adding shares when the stock price pushes the dividend yield to the high end of the historical yield (meaning shares are less expensive hence why the relative dividend yield increases). As of the most recent earnings report, ADC’s dividend is up 5.7% YoY in total.
If you are looking to add shares of ADC it would make the most sense to wait for prices to drop to $65/share.
ADC – SeekingAlpha – Dividend Yield (Seeking Alpha)
The dividend was increased from $.23/share per month to $.24/share per month. This represents an increase of 2.6% and a new full-year payout of $2.88/share compared with the previous $2.76/share. This results in a current yield of 3.90% based on the current share price of $71.23.
Concentrix
CNXC is one of the few tech companies that are in the portfolio and we continue to hold it because the company has performed exceptionally well and the recent dividend increase is promising for a company that has demonstrated strong revenue and earnings growth. CNXC has been focused on acquisitions, share repurchases, and strengthening free cash flow.
CNXC – FastGraphs (FastGraphs)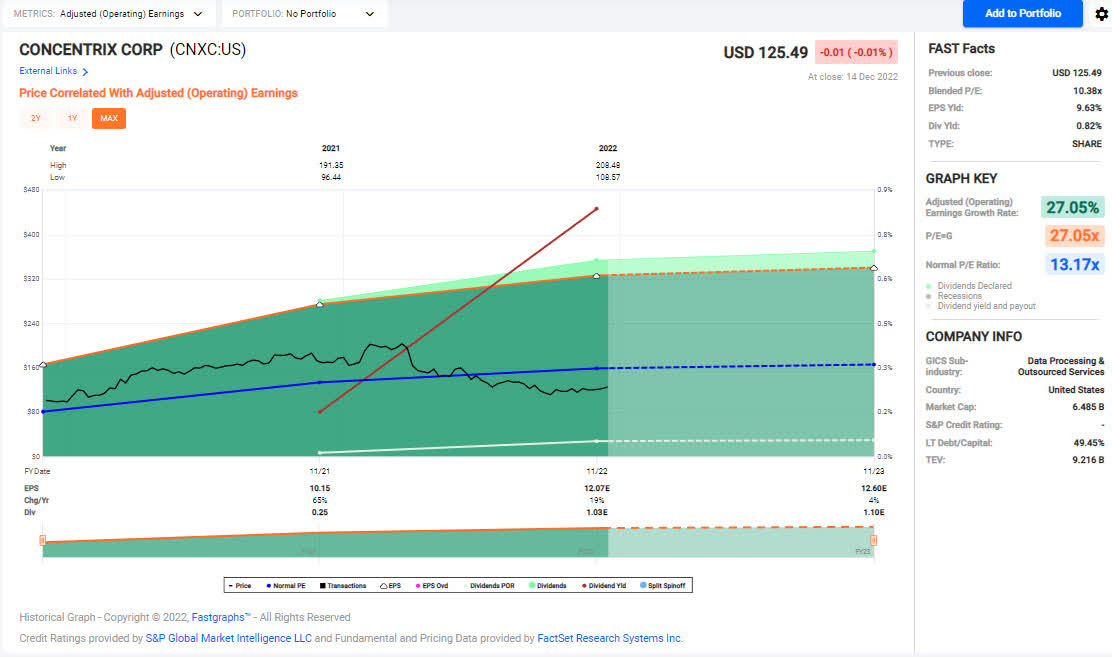
The dividend was increased from $.25/share per quarter to $.275/share per quarter. This represents an increase of 10% and a new full-year payout of $1.10/share compared with the previous $1.00/share. This results in a current yield of .82% based on the current share price of $125.49.
Emera
I mentioned in the article The Retirees Dividend Portfolio – Account Transactions Through October 31st that EMRAF has not been in a buy range for nearly 2.5 years and used the opportunity to add more shares. While the recent price drop improved the price point there has been some concerns injected into the investment thesis by Trapping Value’s recent article Emera: Don’t Chase That Yield where he accurately points out that the capital expenditures have resulted in debt to EBITDA that is reaching concerning levels. The part that specifically caught my eye came from when Moody’s take on EMRAF’s outlook.
Emera’s negative outlook is driven by its weak financial profile and the high execution risk associated with improving its financial metrics considering increasingly challenging market conditions for the company” said Yulia Rakityanskaya, Moody’s analyst.
As a result, we expect financial ratios to remain among the lowest in the North American regulated utility universe, including its ratio of cash flow from operations before changes in working capital (CFO pre-W/C) to debt below 12% in 2023. The combination of elevated under-recovered fuel balances from higher natural gas prices, rising debt to fund sizable infrastructure investments in a higher interest rate environment, political interference in the regulatory process in Nova Scotia, and incremental restoration costs from hurricanes that hit Emera’s service territories in September 2022 are pressuring the entire organization’s credit profile.
We will be reviewing this position over the next week and trimming or eliminating it because of the high debt to EBITDA going into a recessionary and rising rate environment. Jane’s average cost for the EMRAF position would result in a significant gain even after EMRAF stock price has dropped considerably from its 52-week high.
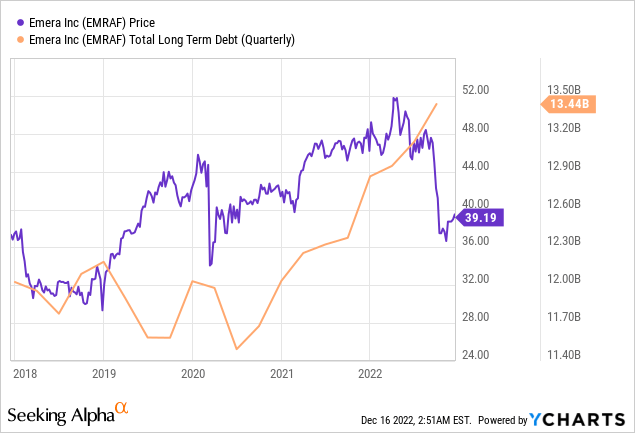
The dividend was increased from $.6625/share CAD per quarter to $.69/share CAD per quarter. This represents an increase of 4.2% and a new full-year payout of $2.76/share CAD compared with the previous $2.65/share CAD. This results in a current yield of 5.22% based on the current share price of $39.19/share USD.
Verizon
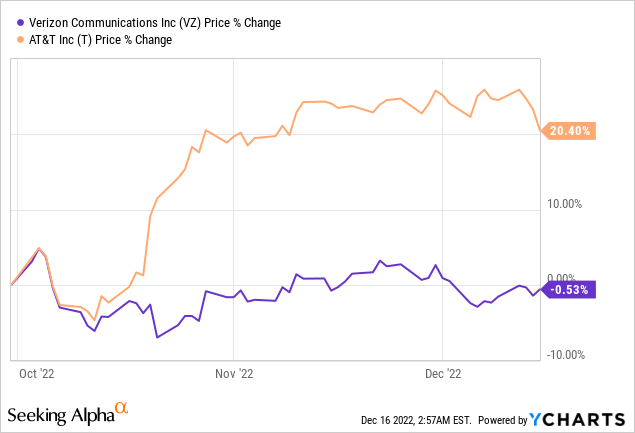
When VZ stock price dropped below $44/share it was something that hadn’t been seen in quite some time especially after the stock was at 52-week highs only months ago. Since October it has been a wild ride for both stocks but at the beginning of October, we saw a major improvement in AT&T (T) stock price while VZ has effectively flatlined.
With this in mind, here is the longer-term performance with VZ trading at a valuation that hasn’t been seen in over a decade. Although VZ’s performance has been lackluster, Morgan Stanley (MS) has raised the price target to $44/share and suggested significant cash-flow improvement might be ahead. We are continuing to add VZ at these levels and view the stock as a worthwhile add at the current price.
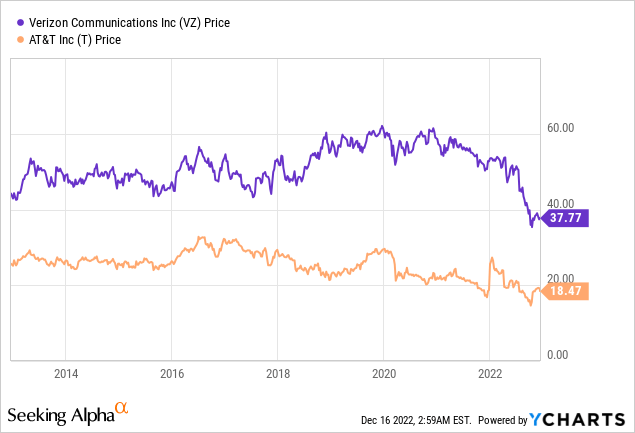
The dividend was increased from $.64/share per quarter to $.6525/share per quarter. This represents an increase of 2% and a new full-year payout of $2.61/share compared with the previous $2.56/share. This results in a current yield of 6.97% based on the current share price of $37.77.
Retirement Account Positions
There are currently 38 different positions in Jane’s Traditional IRA and 21 different positions in Jane’s Roth IRA. While this may seem like a lot, it is important to remember that many of these stocks cross over in both accounts and are also held in the Taxable Portfolio.
Below is a list of the trades that took place in the Traditional IRA during the month of November.
Traditional IRA – 11-2022 – Trades (Charles Schwab)
Below is a list of the trades that took place in the Roth IRA during the month of November.
Roth IRA – 11-2022 – Trades (Charles Schwab)
For a more detailed discussion about these trades and the rationale behind them please see my most recent articles on Recent Purchases and Limit Trades.
The Retirees Dividend Portfolio – Account Transactions Through November 27
November saw significant price improvement which is why we deployed little collateral and cashed out on the high-cost portion of NextEra Energy (NEE).
November Income Tracker – 2021 Vs. 2022
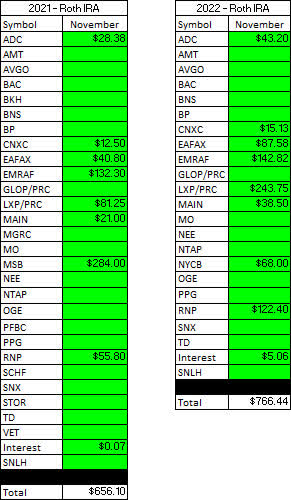
Income for the month of November was up significantly year-over-year for Jane’s Traditional IRA and up modestly for her Roth IRA. The average monthly income for the Traditional IRA in 2022 (compared to 2021) is expected to be up about 15.4% based on current estimates (roughly half of this increase is due to LYB‘s special dividend) and the Roth IRA is looking to grow by 15.3% for the same timeframe. This means the Traditional IRA would generate an average monthly income of $1,600.01/month and the Roth IRA would generate an average income of $683.55/month. This compares with 2021 figures that were $1,386.13/month and $592.61/month, respectively.
SNLH = Stocks No Longer Held – Dividends in this row represent the dividends collected on stocks that are no longer held in that portfolio. We still count the dividend income that comes from stocks no longer held in the portfolio even though it is non-recurring.
All images below come from Consistent Dividend Investor, LLC. (Abbreviated to CDI).
Traditional IRA – 2021 V 2022 – November Dividends (CDI) Roth IRA – 2021 V 2022 – November Dividends (CDI)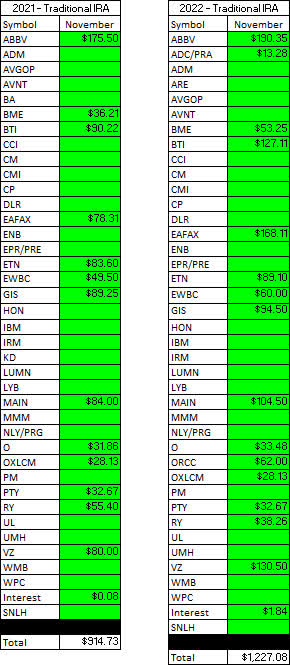
Here is a graphical illustration of the dividends received on a monthly basis for the Traditional and Roth IRAs.
Retirement Projections – 2022 – November – Monthly Dividends (Bar Graph) (CDI)
The table below represents the actual full-year results for 2022 and the prior year.
Retirement Projections – 2022 – November (CDI)
Below is an expanded table that shows the full dividend history since inception for both the Traditional IRA and Roth IRA.
Retirement Projections – 2022 – November – 5 YR History (CDI)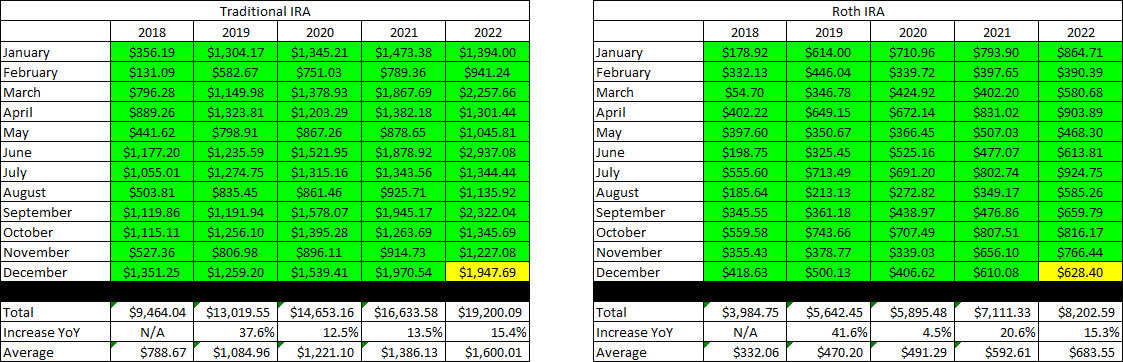
I have included line graphs that better represent the trends associated with Jane’s monthly dividend income generated by her retirement accounts. The images below represent the Traditional IRA and Roth IRA, respectively.
Retirement Projections – 2022 – November – Monthly Dividends (CDI)
Here is a table to show how the account balances stack up year over year (I previously used a graph but believe the table is more informative).
It is worth noting that with John and Jane Retired, there will be no additional contributions to these accounts. In fact, they have already begun to take regular distributions from the Taxable Account and John’s Traditional IRA.
Retirement Account Balances – 2022 – November (CDI)
The next images are the tables that indicate how much cash Jane had in her Traditional and Roth IRA Accounts at the end of the month as indicated on their Charles Schwab statements.
Retirement Projections – 2022 -November – Cash Balances (CDI)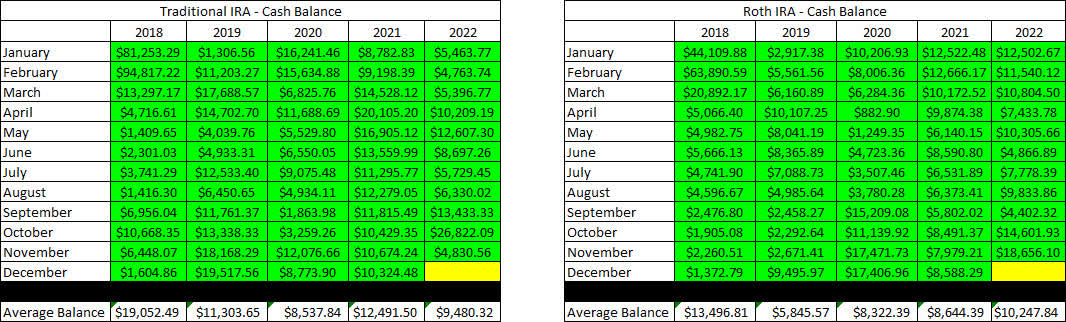
The next image provides a history of the unrealized gain/loss at the end of each month in the Traditional and Roth IRAs going back to the beginning in January of 2018.
Retirement Projections – 2022 – November – Unrealized Gain-Loss (CDI)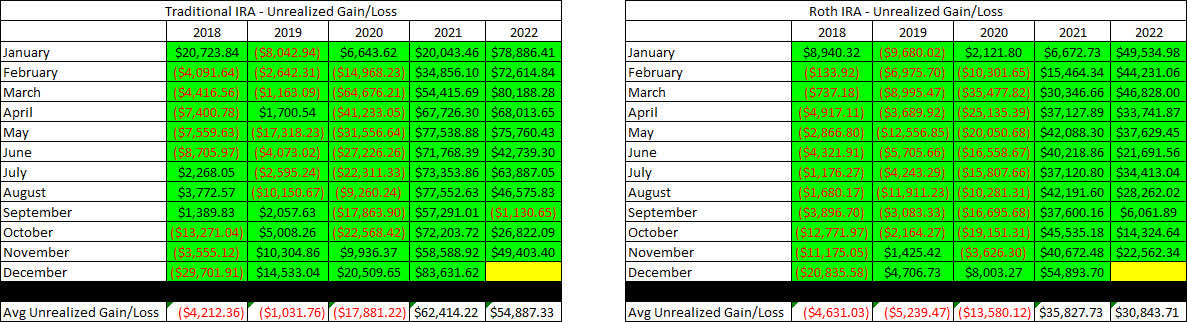
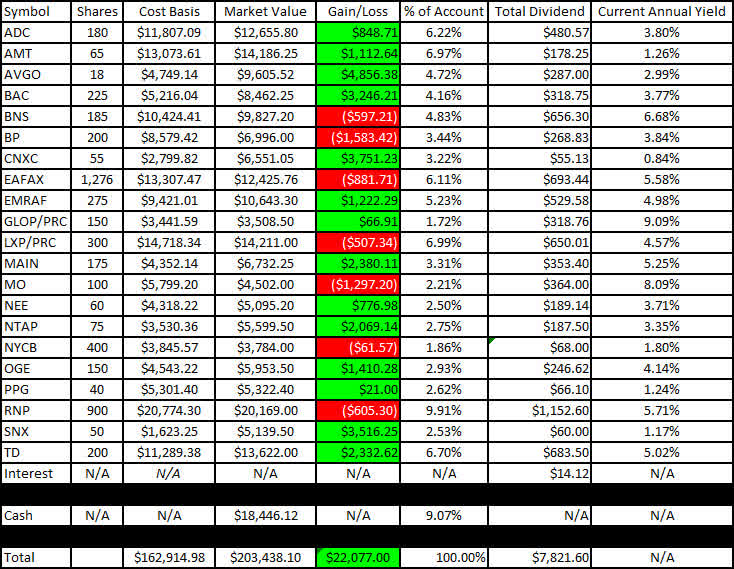
I like to show readers the actual unrealized gain/loss associated with each position in the portfolio because it is important to consider that in order to become a proper dividend investor, it is necessary to learn how to live with volatility. The market value and cost basis below are accurate at the market close on December 9th.
Here is the unrealized gain/loss associated with Jane’s Traditional and Roth IRAs.
Traditional IRA – 2022 – November – Gain-Loss (CDI) Roth IRA – 2022 – November – Gain-Loss (CDI)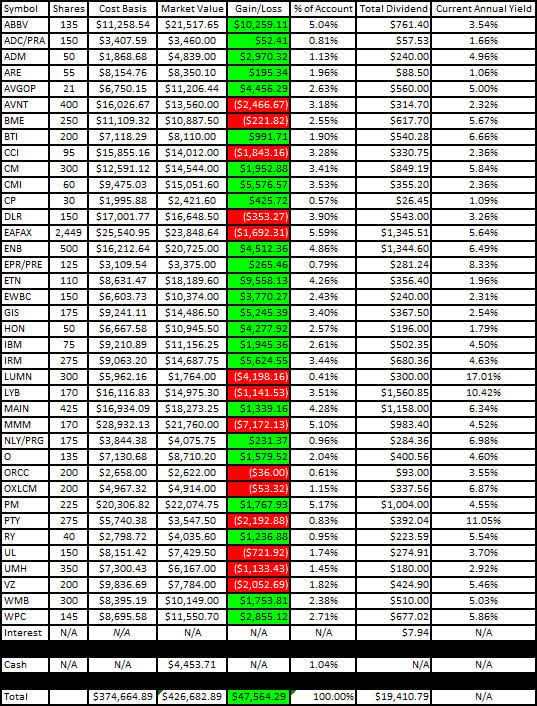
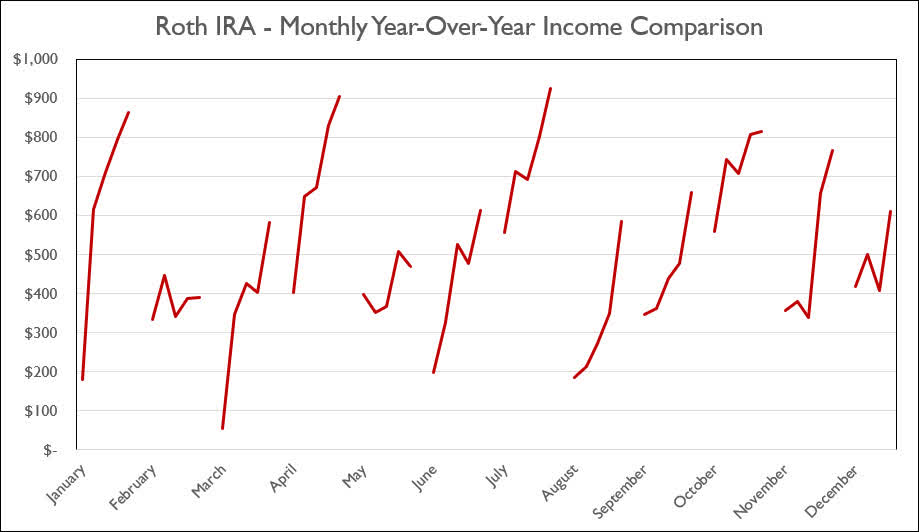
The last two graphs show how dividend income has increased, stayed the same, or decreased in each respective month on an annualized basis. I believe that the graph will continue to become more valuable as more years of data become available (with the fifth year of data being added, we can really see the trajectory of the income change for each month).
Traditional IRA – 2022 – November – Monthly Year-Over-Year Comparison (CDI) Roth IRA – 2022 – November – Monthly Year-Over-Year Comparison (CDI)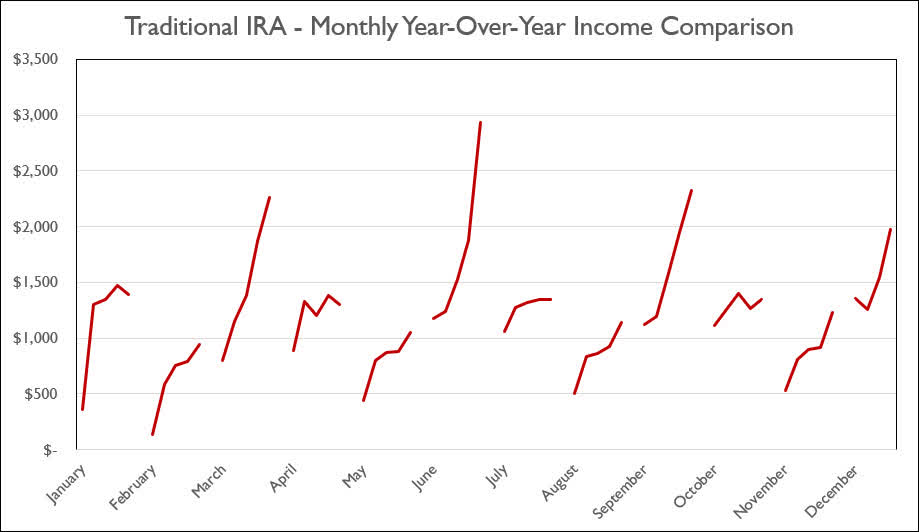
Conclusion
As mentioned in the previous month’s article, we have set a number of limit trades to pare back the high-cost portion of positions in American Tower (AMT), Main Street Capital (MAIN), and Philip Morris (PM). The positions in AMT and PM have been executed during the month of December as shown below.
November – Realized Gain-Loss (Charles Schwab)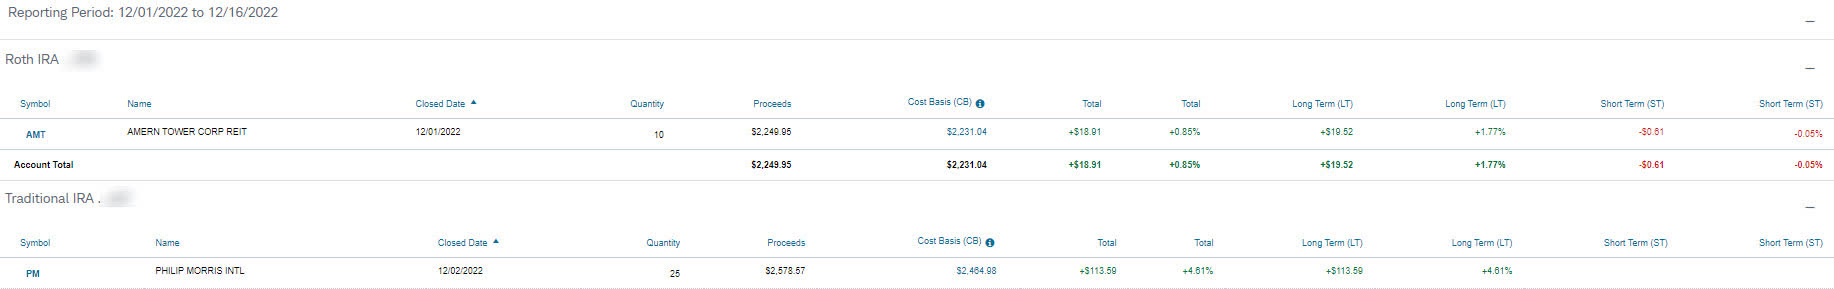
November Articles
I have provided the link to the November 2022 Taxable Account below.
The Retirees’ Dividend Portfolio: John And Jane’s November Taxable Account Update
In Jane’s Traditional and Roth IRAs, she is currently long the following mentioned in this article: AbbVie (ABBV), Agree Realty (ADC), Agree Realty Preferred Series A (ADC.PA), Archer-Daniels-Midland (ADM), Broadcom (AVGO), Avient (AVNT), Broadcom Preferred Series A (AVGOP), Bank of America (BAC), BlackRock Health Sciences Trust (BME), Bank of Montreal (BMO), Bank of Nova Scotia (BNS), BP (BP), British American Tobacco (BTI), Canadian Imperial Bank of Commerce (CM), Cummins (CMI), Concentrix (CNXC), Digital Realty (DLR), Eaton Vance Floating-Rate Advantage Fund A (EAFAX), Enbridge (ENB), EPR Properties Preferred Series E (EPR.PE), Eaton Corporation (ETN), Emera Inc. (OTCPK:EMRAF), East West Bancorp (EWBC), General Mills (GIS), GasLog Partners Preferred C (GLOP.PC), Honeywell (HON), International Business Machines (IBM), Iron Mountain (IRM), Lexington Realty Preferred Series C (LXP.PC), Lumen Technologies (LUMN), LyondellBasell (LYB), Main Street Capital (MAIN), 3M (MMM), Altria (MO), Annaly Capital Preferred Series G (NLY.PG), NextEra Energy (NEE), NetApp (NTAP), New York Community Bank (NYCB), Realty Income (O), OGE Energy Corp. (OGE), Oxford Lane Capital Corp. 6.75% Cum Red Pdf Shares Series 2024 (OXLCM), Philip Morris (PM), PPG Industries (PPG), PIMCO Corporate & Income Opportunity Fund (PTY), Cohen & Steers REIT & Preferred Income Fund (RNP), Royal Bank of Canada (RY), TD SYNNEX Corp. (SNX), STORE Capital (STOR), Toronto-Dominion Bank (TD), Unilever (UL), UMH Properties (UMH), Verizon (VZ), Williams Companies (WMB), W. P. Carey (WPC).
Be the first to comment