

DNY59
Written by Sam Kovacs
Introduction
Only half-way through, and yet, what a year 2022 has been!
We were promised revenge consumption and revenge travel, instead, we got inflation, conflict, and the worst half-year for the S&P 500 in 50 years.
Thanks!
But now, with the market down so much YTD, the biggest challenge of the year is yet to be faced.
Will markets continue their descent and enter a prolonged bear market? Or will they bounce back and correct the course of history?
Markets hate uncertainty
The first thing which is certain is that markets hate uncertainty.
And right now, there is a lot of uncertainty about inflation. In particular one input to inflation. The input which always sparks inflationary waves, and which has a direct impact on costs in nearly every industry: the cost of oil.
In 2020, who would have thought that energy prices would soar above $100 per barrel?
Not many people. In fact, not even us, despite the fact that we were exceedingly bullish on oil in late 2020.
Now we see reports that bans on Russian oil could lead to price spikes up to $380.
There is always some dude to make bombastic forecasts, on the off chance that he is right and can make a career for himself.
Is $380 oil possible? Sure. Is it likely? No.
In fact, we are of the opinion that oil could first go softer, to $90 or $80, as we mentioned to our members 4 weeks ago in a short note.
We noted a few wildcards that could put pressure downwards on oil including:
OPEC+ agreement is coming to an end in August. Saudi and UAE might increase capacity. The US is still releasing its reserves aggressively, and will continue to do so until later this year in October or maybe December if they push it, when they’ll have no more reserves.
We don’t believe that the G7 will be able to successfully implement a price cap on Russian imports, which would be the catalyst needed for Russia to retaliate and decrease production, which would make things like $300 oil possible.
The EU’s planned reduction of Russian crude imports by 90% in 2023 also likely won’t be met with retaliation, but rather as we have already seen, a redirection of Russian oil towards China and India.
At the same time, OPEC+ is nearing its full capacity. The cartel’s output is already higher than early 2020, and after August, all countries except Saudi Arabia and the UAE will be pumping at full throttle.
Bloomberg, OPEC
Those two nations won’t really have much capacity to make a large dent into output thereafter. With the US winding down its release of special reserves this fall, unless demand substantially cools, it seems like the oil price could take off.
So we have this uncertainty permeating the core driver of inflation. Short term we could see oil prices going down, only to whiplash back higher than ever.
A slowdown in demand seems unlikely for two reasons.
The environment is still stimulatory for stocks
The first reason is that the environment is still stimulatory. How so?
Yes, the Fed has tapered and finally stopped its most exuberant money printing cycle ever. But, real rates are still deeply negative, more negative than they have ever been.
The Fed rate is at 1.5%, but inflation is at 8.5%. That means that real rates are -7%. That is the definition of “cash is trash”.
There is a lack of political will to respond to modern monetary theory in the way which textbooks suggest: by taking money out of the system by taxation or reduction in government spending.
One side of the political spectrum would never allow the former, the other side of the spectrum would never allow the latter.
So let’s raise rates slowly to not spook markets and hope for the best.
The net impact is that as an asset class, cash is awful, bonds are awful, unprofitable growth stocks are awful, which doesn’t leave much.
It does mean that money’s best place to hide is stocks. It is taking market participants a while to figure this out and for the sluggish cashflows to make the switch, but sooner or later, they will.
Bloomberg, Deutsche Bank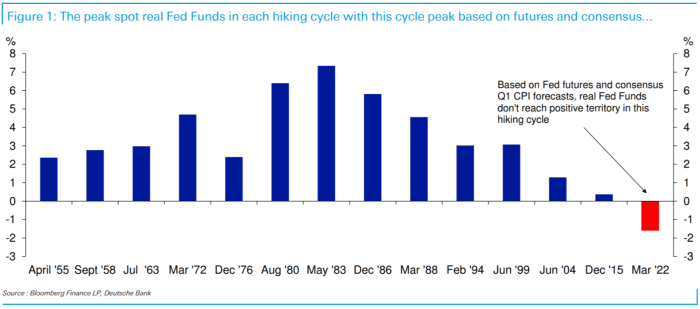
Consider that the forecast is that during this hiking cycle, rates will likely not reach positive territory. Think about that for a minute.
Consumers are still strong
The second reason demand isn’t cooling down is that demand is still going strong.
Fitch has found that US consumer spending has remained high amid inflation, due to a tight labor market causing wages to go up, in some cases more than inflation.
The lowest 20% of earners haven’t started to tap into their pandemic savings because their wages have been going up higher than inflation.
Inflation has seeped into the common discourse. This is when it gets dangerous, as it has the potential to lead to a vicious cycle of wage hikes which lead to more inflation.
A combination of higher wages and pandemic savings can keep US consumers going for a while.
The market wants to go higher
When the Fed announced that it was hiking rates by 0.75%, markets went up and everyone cheered.
Remember the days when rate hikes led to stocks going down? The narrative of whether news is positive or negative depends on the direction the market “wants” to go.
This was rationalized by market participants as follows: By increasing rates higher, the Fed signals that it wants to beat inflation, which investors feel is important for markets to rise.
That last part is the key piece of information.
Markets are waiting for inflation to peak. They’re obsessed with it. All it takes is for one inflation reading to come in below the previous one, and the market will get overly excited.
The bears are usually wrong
The quote “Buy when blood is in the streets” is always quoted in Bull cycles when there is a 5-10% correction.
The reason this quote has prevailed years after Rockefeller died, is because it rings true.
We can all look back at the charts and see, huh, if I bought at that bottom when everyone was crazy scared, look how well I would have done!
There is one metric I like a lot to know “when blood is in the streets”.
This metric is the Bull-Bear spread from AAII’s investor sentiment survey chart.
Basically when the number of bulls drops and the number of bears rises so high as to create a significant spread.
A negative 40% spread has only happened in 3 periods in the past 50 years:
- In the second half of 1990.
- In March 2009.
- In Q2 2022.
AAII Investor sentiment survey
| Date | Bull Bear Spread |
| 8-17-90 | -0.41 |
| 9-21-90 | -0.43 |
| 10-5-90 | -0.44 |
| 10-19-90 | -0.54 |
| 11-16-90 | -0.43 |
| 3-5-09 | -0.5135 |
| 4-28-22 | -0.429223 |
| 6-23-22 |
-0.411348 |
The table above shows the 8 occurrence’s in which the spread was lower than negative 40%.
What happened after these events? Well in 1990 it sparked one of the best decades for stocks. In 2009 it also sparked one of the best decades for stocks.
Of course, this is purely anecdotical, but it makes sense. When the sentiment is worst, it is usually the best time to be buying.
Stocks could have bottomed. They might bottom in weeks to come. But this contrarian indicator would suggest we’re as close to the bottom as ever.
Buy these High Quality Dividend Stocks
Either way, at the Dividend Freedom Tribe we stay invested through thick and thin.
Our goal is to build long-lasting streams of income which will grow and see us through retirement.
The best way to do this is by spending “time in” the market rather than “timing” the market.
That way the compounding magic of dividends can do its work.
However, we do believe it is a market of stocks, and not a stock market, which is to say there is always something well valued and something expensive.
We believe in buying low and selling high. In between, we get paid growing dividends to wait. If we buy at the right price and management meets our dividend growth expectations, then we can wait forever for the price to become overvalued.
With that being said here are 3 themes which I see providing fantastic value in the current environment.
Cheap Semiconductor stocks
Semiconductor sales are expected to grow 10% in 2022 to surpass $600bn for the first time ever. Of course, the industry remains small if you compare it to the size of farming for instance, which is a $10tn industry.
But unlike farming, which is spread out through the world, 80% of chips come from a handful of companies located in a handful of countries, including the US.
The industry is doing great, companies are doing great, yet many of these stocks trade at some very attractive prices relative to their dividends.
Stocks are getting dragged down because they are being grouped with tech. Just one of the many ways market participants take shortcuts which give active investors good opportunities.
Texas Instruments
Texas Instruments (TXN) is the leader in analog semiconductor devices with 19% market share, ahead of Analog Devices’ (ADI) 12% market share.
The reason I open with this is that it gives the company an incredible edge.
The semiconductor industry goes through its own boom and bust cycle, where inventories are emptied and then pile up.
TXN, because of its large customer base, can build up very large inventories without much obsolescence risk, because it can sell them to a large number of customers.
This gave the company an edge in April 2020 when they kept the factories going and built up inventory which served them well in 2021.
Management realizes that they can build up this inventory, without the risk of not finding a client, and because of its technological edge can do so knowing the chips will be sold before they become obsolete.
With the ever-increasing range of devices needing chips, the cyclicality of the industry might decline over upcoming years and decades.
That doesn’t stop TXN’s price from going up and down.
Dividend Freedom Tribe: TXN MAD Chart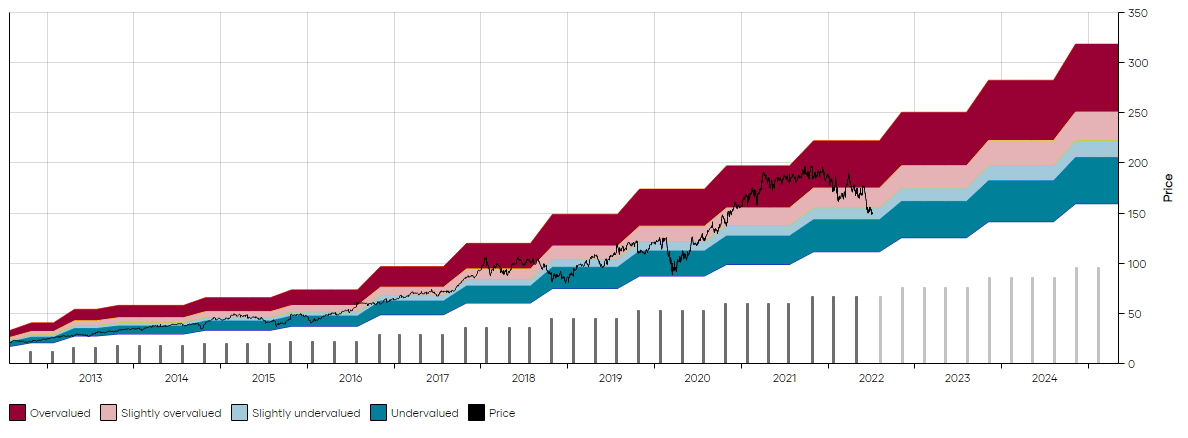
At $150 it now yields 3%, which is just about its 10-year median yield. With a double-digit dividend increase likely to come two quarters from now, the forward yield is extremely attractive and well worth initiating a position.
Yes TXN could drop to $120 on extremely bearish sentiment, but in so doing would likely bounce back very quickly.
If you don’t have exposure to TXN, now would be a good time to get started.
Broadcom
Take Broadcom (AVGO). Revenues are up, margins are up, cash flow is up.
Investor Presentation
Yet the stock is down more than 30% for the year.
Dividend Freedom Tribe – AVGO MAD CHART
As shown on the 5-year MAD Chart above, relative to its dividend yield, AVGO is yielding close to its median yield: 3.3%
This suggests that, ignoring swings up and down, investors should expect share price to trend in line with dividend growth over upcoming years.
Investor Presentation
AVGO has averaged a 43% dividend CAGR over the past 5 years. They are unlikely to replicate this in coming years, but double-digit increases should continue to be the norm thanks to the good backdrop for semiconductors.
Intel
The talk on the block is how AMD’s (AMD) chips are better than Intel’s (INTC).
And when you look at the data, there is no denying it: Intel has lost significant market share.
Intel has lacked the proper leader for the company for the past 9 years. Management salaries were bloated, but neither Bob Swan or Krzanich were the leaders Intel needed to not be toppled. Throughout their tenure, I repeatedly criticized management for its approach and sluggish dividend growth.
Gelsinger is promising, and his CAPEX-heavy turnaround plan is exactly what will be required if Intel wants to retain its leadership spot throughout the next decade.
Dividend Freedom Tribe: INTC MAD Chart
Intel currently yields 3.9%, which means we require more or less a 5% annual dividend growth rate to make it a worthwhile investment. The company has averaged a long-term 5% dividend growth rate, which I’m quite confident it will continue to maintain, as there is plenty enough free cash flow to continue increasing the dividend while funding high CAPEX throughout the next 5 years.
While there could well be more downside, as in all semis, they are now at valuations which make them attractive buys.
High Growth Banks
The top investment banks once again lead the show this year, with both Goldman Sachs (GS) and Morgan Stanley (MS) increasing their dividends double digits, whereas universal banks like JPMorgan (JPM) and Bank of America (BAC) ended up keeping the dividend flat and increasing by only 5% because of their obligation to increase capital buffers following stress tests.
Goldman Sachs, thanks to its 25% dividend hike, following last year’s 60% dividend hike, now yields just below 3%, or more than Bank of America.
This is a significant divergence from its 10-year median yield of 1.58%.
Dividend Freedom Tribe: GS MAD Chart
The current valuation is very similar to the valuation that GS traded at the COVID trough in 2020, as well as the GFC trough in 2009.
It is a great time to pick up shares in the stock.
Much the same can be said for Morgan Stanley (MS), which yields an unbelievably high 3.58%.
Dividend Freedom Tribe: MS MAD Chart
Both companies have significantly less if not no retail exposure, provide superior yields, and have been growing their dividends at fantastic rates.
While MS has declined 20% since we first bought it a year ago, sometimes patience is required, and we are sure this is the case here.
The valuation for these two stocks is close enough to the bottom to initiate and increase existing positions.
Superior consumer stocks
If anything that I’ve said here is right, then it is likely that the market is mispricing superior consumer discretionary stocks.
In particular, one area where I believe the market has once again made a simplification is home improvement stocks, namely Lowe’s (LOW) and Home Depot (HD).
They’ve been tracking home improvement stocks nearly perfectly as you can see on the chart below
TradingView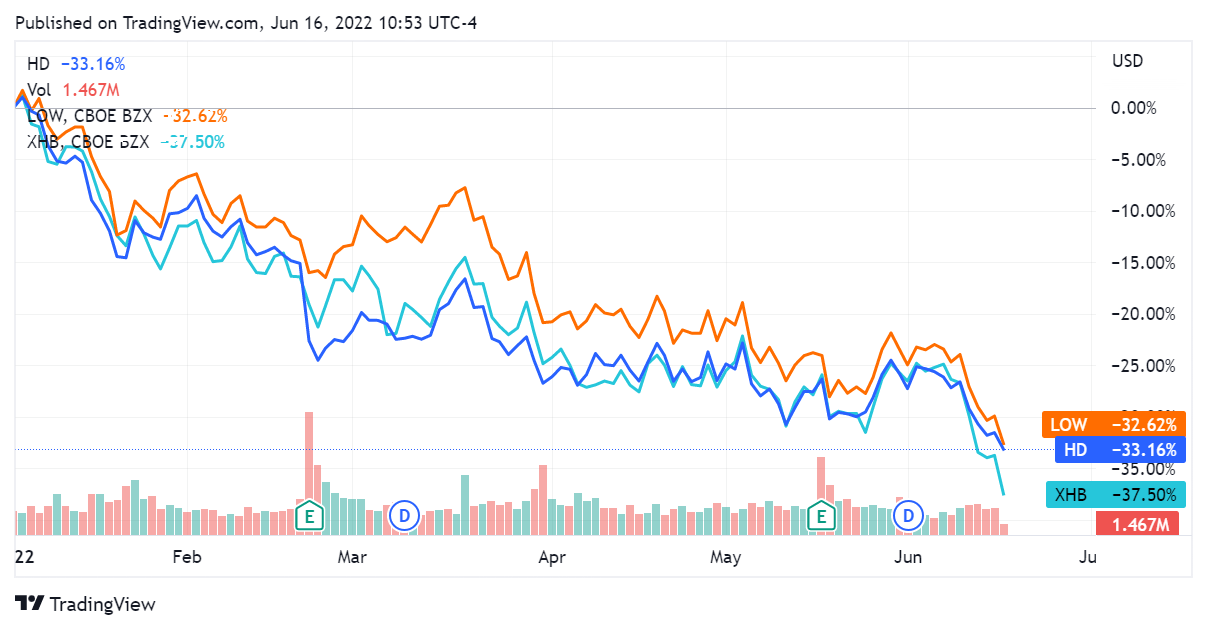
Yet, while housing starts and housing permits are down, this ignores the fact that houses under construction but not finished remain at the highest level since 2006, which still provides ample room for professional services from HD and LOW.
This is a key discussion of course, but I think the market is overreacting.
HD is once again in its historically undervalued range, and while it could get a lot cheaper, it presents an attractive entry point for dividend investors.
Dividend Freedom Tribe: HD MAD Chart
Its 2.8% yield might not seem a lot at first, but HD has proved its ability to grow for decades.
Home improvement is set to continue growing at a 5% rate for the next 7 years as an industry. HD and LOW will continue to take most of the market share.
Lowe’s is even more attractive.
While it yields 2.4%, which is slightly less than HD, the company only pays out 35% of its free cash flow, leaving a nice cushion for future dividend growth, even if industry or company level growth stalls for a year or two.
Dividend Freedom Tribe: LOW MAD Chart
Therefore I believe these two stocks will continue to be great custodians of capital.
At first, housing might be slowed by increasing nominal rates. But if inflation doesn’t subdue, people will realize they are in fact paying negative rates on their mortgages.
Conclusion
All of the stocks which I presented could still take a beating. They will rise and fall with the general market. What makes them different is that they are of the highest quality and will be around for a long time, exploiting their edge and rewarding shareholders.
These are the sort of stocks you want to own in challenging times.
Be the first to comment