

z1b
Co-produced by Austin Rogers for High Yield Landlord.
In the long run, we continue to believe that the Five Horsemen of Disinflation (i.e., falling rates of inflation) have not gone away and will continue to act as gravity on consumer prices:
- Aging Demographics
- High Debt Loads
- Income Inequality
- Technological Innovation
- Globalization.
But what about the short-term outlook? Well, trying to predict what will happen in the next few quarters or years is much harder. There can always be some exogenous event (like, say, Russia invading a neighboring country!) that throws off one’s short-term forecast.
Even so, we can look at economic data and try to assess what it means. This is especially relevant in an age when the Federal Reserve’s decisions on interest rates (which are motivated by inflation) have such a huge effect on the performance of stock prices, including for real estate investment trusts (“REITs”).
The first thing I’d like to point out is that, over the last few months, month-over-month CPI inflation, which is a more “real-time” measurement of inflation than the year-over-year CPI number that more often gets cited in the media, has been pretty low.
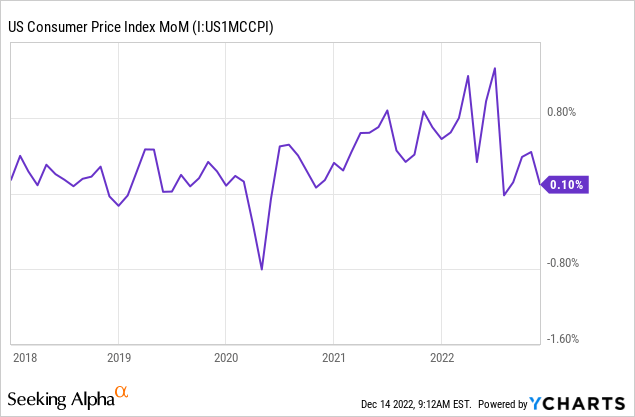
In fact, November’s 0.1% MoM inflation reading was within the normal range from the years before COVID-19.
The elevated range of MoM inflation readings from mid-2021 to mid-2022 might have come to an end. If so, then the year-over-year CPI numbers will gradually come down from here as well.
Let’s dive into some of the biggest economic issues facing the country right now, including the labor shortage as well as the mismatch between high demand and constrained supply.
Collectively, we believe they paint a picture of easing inflation, which should precipitate an end to the relentless rise in interest rates we’ve seen this year.
If we are correct, then stocks (SPY) may be near the bottom for this rate-hiking cycle, and some rate-sensitive sectors like REITs (VNQ) should present significant upside going forward.
Labor Shortage Easing
The labor shortage has played a major role in pushing up wages and raising costs for producers, which then feeds into inflation.
When it comes to the labor shortage, there is some mixed data to report.
First, the overall labor force participation rate remains around a full percentage point lower today than it was before COVID-19 struck. That means millions of workers who dropped out of the workforce during the pandemic haven’t come back.
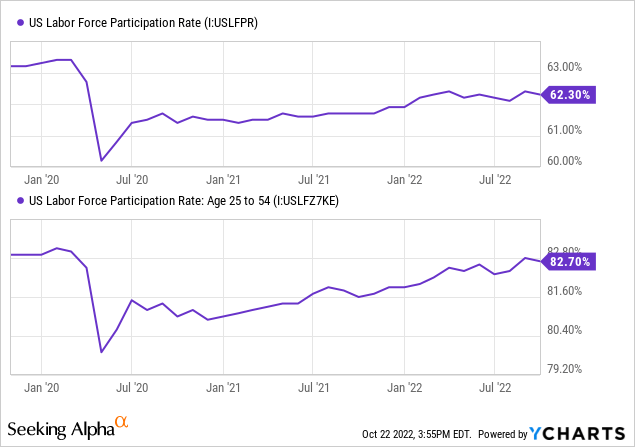
But notice also in the second image above that prime-aged workers from 24 to 54 show labor force participation nearly at the same level as they had pre-COVID.
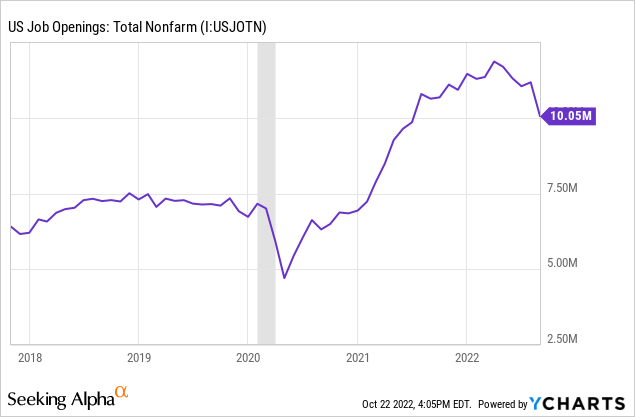
Between workers coming back into the labor force and perhaps some weakening demand (which we’ll address below), the number of job openings has declined considerably from its peak.
What about legal immigration? If American-born workers are not coming back into the workforce to fill these open jobs, are immigrants instead?
The Congressional Budget Office recently projected that by 2043, U.S. population growth will be driven entirely by net immigration. Already, in average years, immigration amounts to more than double the births-minus-deaths number in the U.S.
Unfortunately for the economy, legal immigration has substantially slumped in recent years:
Migration Policy Institute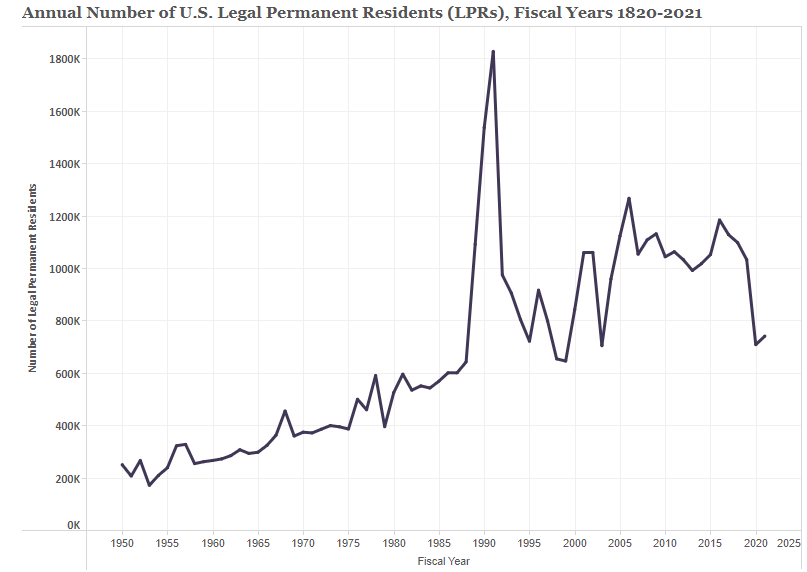
Though legal immigrant visas have also trended downwards in 2022 overall, the backlog of visas did tick up by around 4% month-over-month in October, and the State Department scheduled 11% more green card interviews during the month.
But what about illegal/undocumented immigrants? Well, unsurprisingly, it’s difficult to know exactly how many of these individuals come into the U.S. to join the workforce, but we can estimate it based on the number of people who are apprehended trying to cross the border illegally/without documentation.
Attempted crossings of single adults across the Southern border have soared in 2021 and 2022.
US Customs & Border Control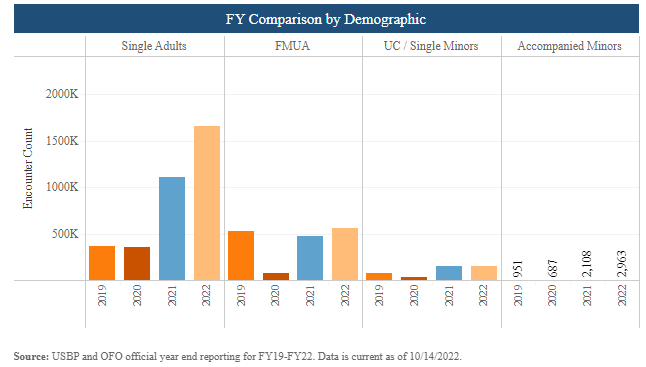
As such, we can assume that the fastest-growing segment of workers in the U.S. are illegal/undocumented immigrants.
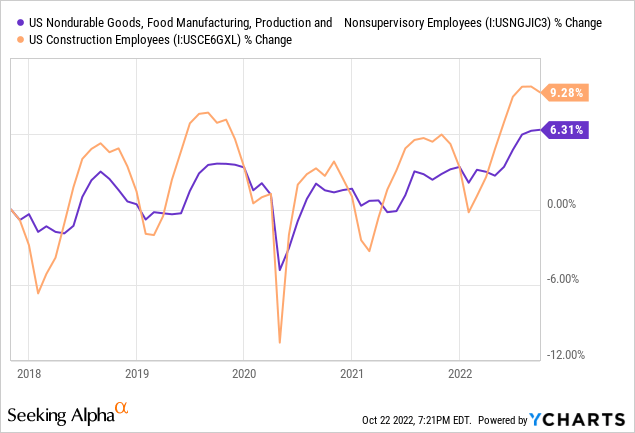
These individuals typically find work in construction, food production, and restaurant kitchens. In these industries, especially food production and construction, we find the number of total employees at higher levels than at any time in the last five years.
Unfortunately, though, the industries with the most job openings are not as well suited to this kind of worker but rather to the American-born workers and legal immigrants who seem to be choosing not to take those jobs.
In August 2022, the top four industries for job openings, accounting for most of the openings across the economy, were:
- Education and health services – 1.89 million
- Professional and business services – 1.87 million
- Trade, transportation, and utilities – 1.64 million
- Leisure and hospitality – 1.41 million.
Demand Side
On the demand side, we find several forces that should dampen consumer demand in the months and quarters to come as well as one factor that could keep it going a little longer.
Fizzling Pandemic-Era Stimulus. We all know by now that the government printed and spent a huge amount of money during the pandemic. In early 2021, the U.S. money supply had surged by 25% year-over-year because of this stimulus spending.
Did all that stimulus money get spent immediately? No, it did not. It takes a while for that magnitude of new money to filter through the economy, which means that there will be a lag between the lump-sum stimulus spending and the rise in consumer prices that results from it.
That is exactly what we’ve seen. It took about a year for the initial COVID-era stimulus spending to result in a spike in inflation, and then the early 2021 round of stimulus continued to fuel that inflation through the present.
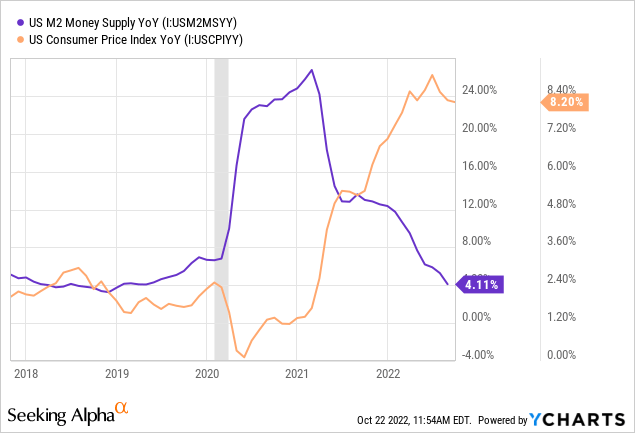
But notice in the above chart that, since that last round of pandemic stimulus in early 2021, growth in the money supply has collapsed back down to near its lowest point in the years immediately preceding COVID-19. That rapid drop in the growth of the money supply should eventually lead to a drop in consumer demand.
Weak Real Wage Growth. We can also see the COVID stimulus showing up as massive spikes in real disposable personal income in 2020 and 2021. Aside from those brief spikes from government checks, real (inflation-adjusted) personal income growth has been extraordinarily weak in the last year. Today, it sits at basically the same level as February 2020.
YCharts, Modified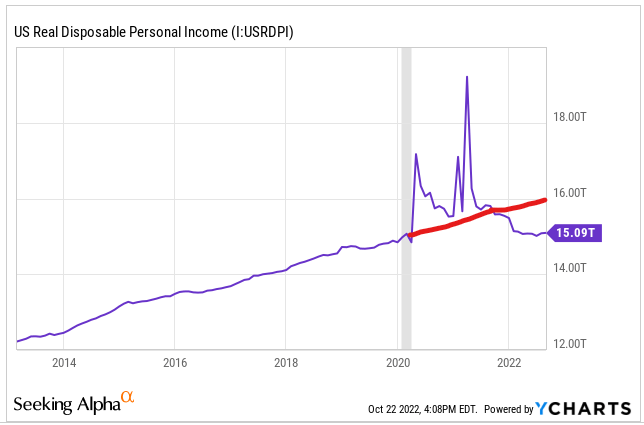
I drew the red line showing the growth trend from late 2012 through early 2020 to show that, if the trend had continued, real disposable income would be around $16 trillion today instead of $15.1 trillion. In other words, today, the American people are earning $900 billion less in a real sense than they would have if COVID-19 and the related stimulus spending had not occurred.
On a per capita basis, the situation is even worse, because the U.S. population has grown in the last few years. Indeed, on a per capita basis, real income is lower today than it was at the beginning of 2020.
Below is a chart showing the year-over-year change in average hourly earnings for all private sector employees (in blue) compared to the U.S. CPI.
Federal Reserve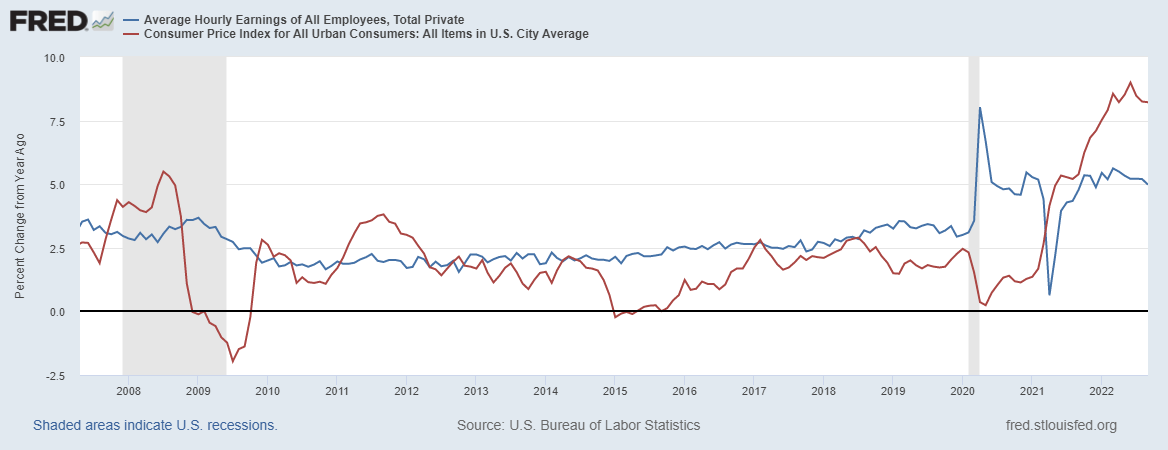
As you can see, the rate of inflation has far surpassed wage growth this year, even though wage growth has been above average. What’s more, wages have flatlined and seem to be on the downward slide along with the CPI.
This is why real disposable income has fallen so far below trend this year. Wage growth has not kept up with inflation, and it does not appear to be on the verge of doing so.
History teaches us that inflation doesn’t play much of a role in setting wages. Rather, it’s the supply of and demand for labor that sets wages, almost regardless of what inflation is doing. As job openings come down, we should expect to see wage growth begin to cool as well.
In turn, real wage growth should continue to be negative. This is a recipe for downward pressure on inflation.
Saving Rate Down, Credit Card Debt Up. As a result of negative real wage growth, continued spending by American consumers has been funded by eating into savings and running up balances on credit cards.
As inflation has raged this year, the personal saving rate (the portion of the average American’s paycheck that is saved rather than spent) has declined to its lowest level since 2008, as higher prices eat up more of one’s income. Meanwhile, since shortly after the last round of pandemic stimulus went out in early 2021, credit card debt has been on the rise.
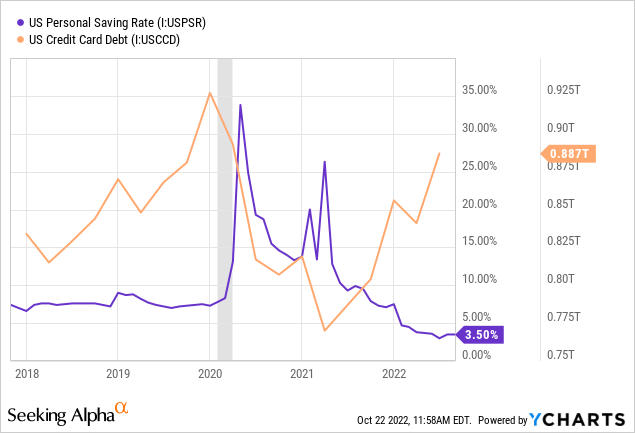
Though consumers can do this for a while, they will eventually be forced to rein in their spending in order to deal with credit card debt.
But how long is “eventually”? Well, that is a tough question to answer, because the combination of COVID stimulus checks and big jumps in wages for low-income workers has led to a big increase in money stashed in bank accounts for lower income workers.
The chart below shows money held in checkable deposits by the bottom 50% of Americans by wealth share:
Federal Reserve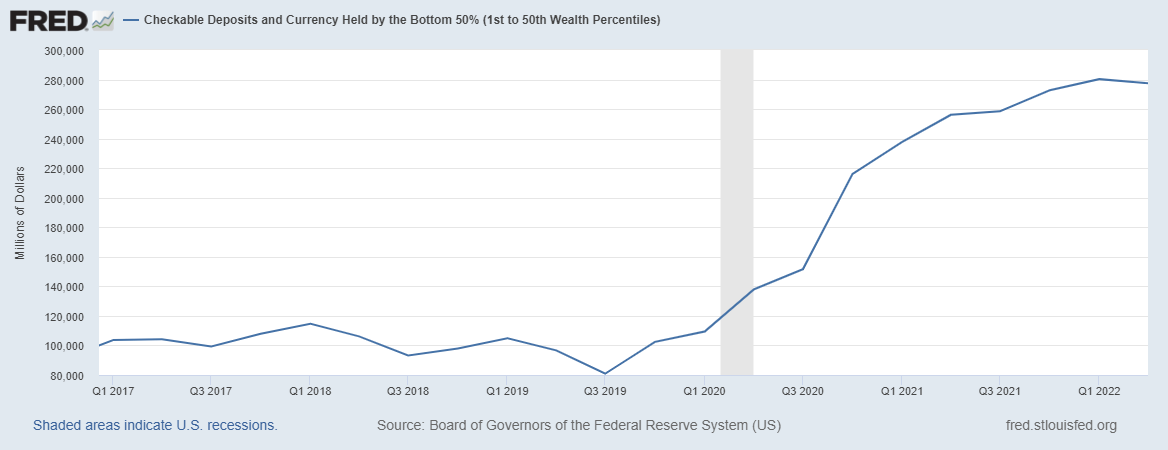
Though I would have assumed that low-wealth households would have drawn down their checking account balances by now, that apparently isn’t the case. As of the last quarter, Less wealthy people still had over 2.5 times more money in the bank on average than they did before COVID-19.
At this point, this saved cash in checking accounts is the main thing keeping consumer spending afloat.
However, it appears that low-wealth households saw their checking account balances peak in Q1 2022, as the total declined slightly in Q2. Given negative real wage growth, I would expect these bank account balances to be steadily drawn down in the quarters ahead, eventually forcing the working class to pull back on spending.
Supply Side
On the supply side, we find several points indicating that the worst of the inflationary surge has passed.
Durable Goods Inflation Cooling. While nondurable goods continue to rise in price at a rapid pace, durable goods (which account for huge chunks of consumer spending) prices have been growing at slower and slower paces since mid-2021.
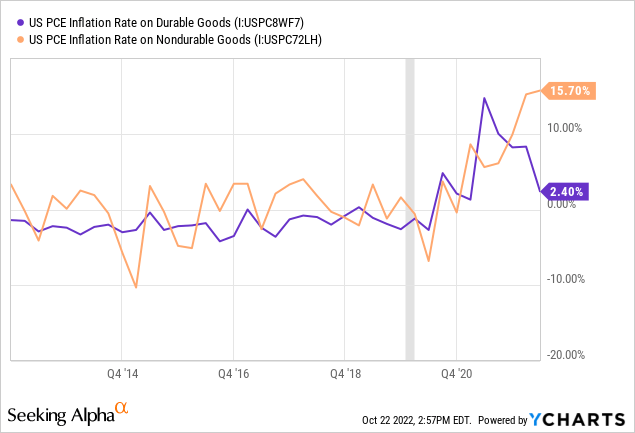
This is a good sign because durable goods inflation tends to peak and decline before nondurable goods do. The definitive decline in durable goods inflation suggests that it is only a matter of time before the same happens for non-durable goods.
Import Price Deflation. After a long period of time from mid-2020 to mid-2022 in which the cost of imported goods went higher and higher, we are finally experiencing some sustained relief on this front. In fact, for the last several months, costs have been coming down – i.e., deflation.
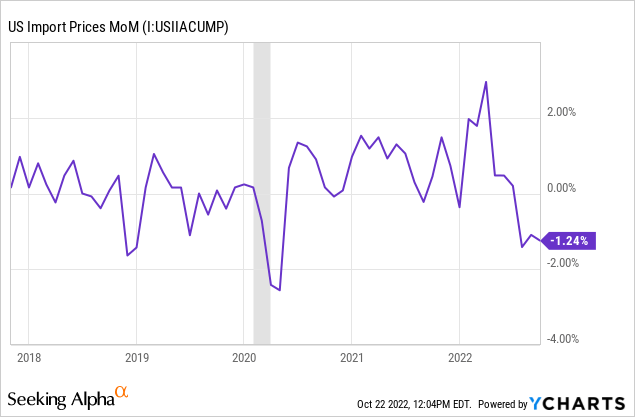
Container ship traffic jams at ports are easing. Trucking companies are getting goods to end destinations faster. This critical bottleneck appears to be easing up.
Input Prices Are Moderating. Movements in the producer price index (the inflation gauge for businesses rather than consumers) have come down considerably from its peak earlier this year. On a month-over-month basis, the PPI is back within a normal pre-pandemic range.
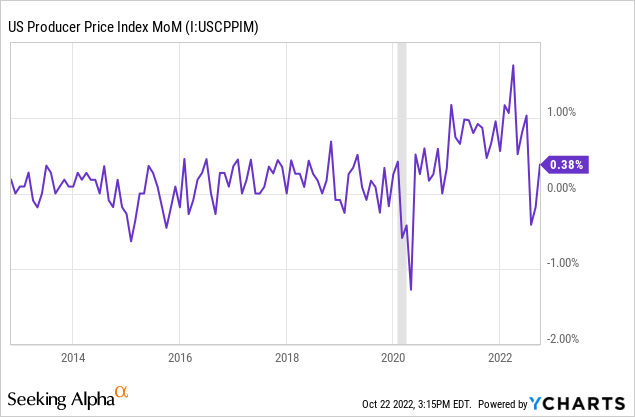
Will it stay down in that range? There are some signs that it will.
First, the price of oil (CL1:COM) has dropped 30% from its high reached in June. Meanwhile, oil production is increasing in both the U.S. and across the world, albeit at a slower pace than many would like.
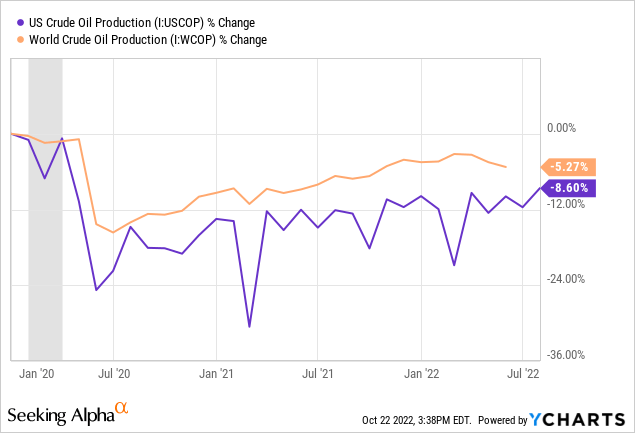
As you can see above, U.S. crude oil output is now only ~9% below its pre-pandemic level.
Other commodities have seen similarly sharp declines in price this year, from lumber (LB1:COM) to copper (HG1:COM) to cotton (CT1:COM).
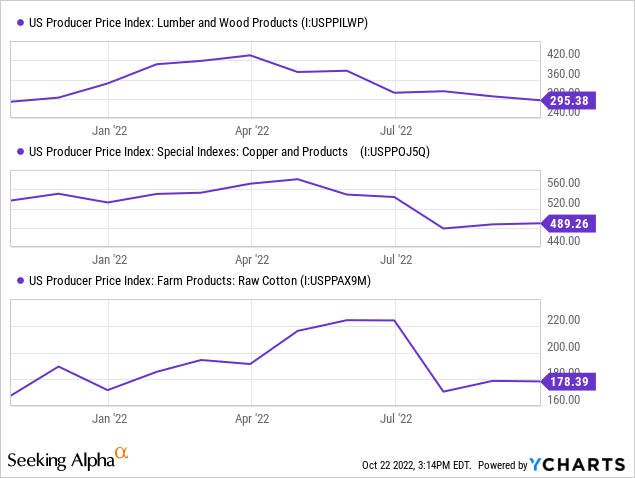
These sustained declines in input prices signify that the worst is probably over as far as the inflation surge is concerned.
U.S. Goods Production Is Rising. It wasn’t until early 2021 that production of final products in the U.S. returned to pre-pandemic levels, but since then U.S. goods production (including for consumer goods) has been surging higher.
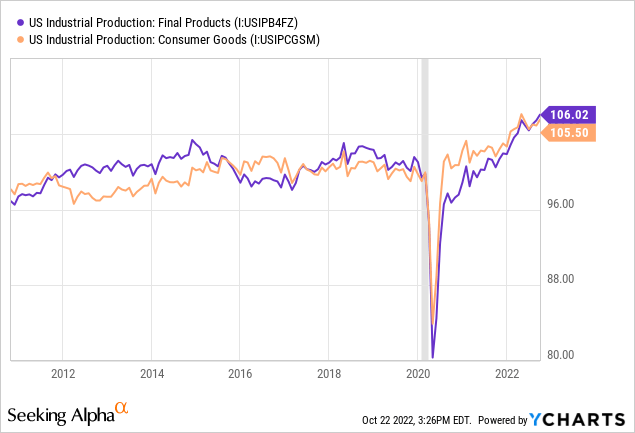
A rising supply of goods is a good thing at a time when demand has been so high as to cause prices to shoot higher.
And though inventories have a ways to go before they return to pre-pandemic levels, it is telling to see that inventories have been rising in recent months.
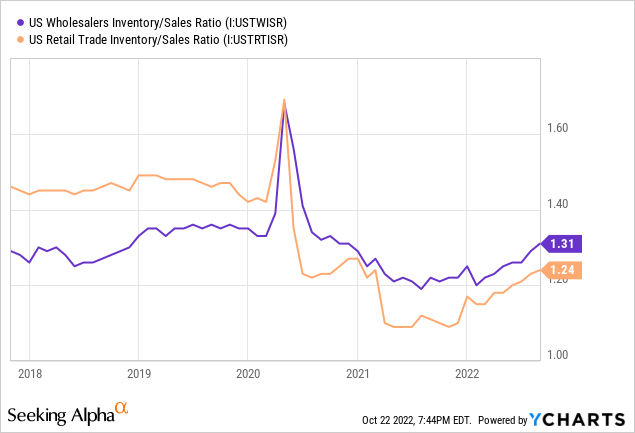
This signifies that more goods are being put into the market than are being purchased from the market – i.e., a tilting from too much demand toward too much supply.
Bottom Line
We continue to think that the stimulus-fueled inflation that followed COVID-19 will prove to be transitory rather than the start of a new long-term secular inflation trend. Though, admittedly, we did not think “transitory” would last so long in this case.
Overall, we think the balance of supply and demand is coming back into equilibrium. Demand is gradually cooling, while supply is picking up. This, we believe, puts us much closer to the end of the Fed’s interest rate hiking cycle than the beginning of it.
Thus, in view of the 25-30% selloff in REITs this year, right now strikes us as a great time to be buying REITs, and that is exactly what we are doing at High Yield Landlord.
The large-cap investment grade rated REITs like AvalonBay (AVB) and Prologis (PLD) are heavily discounted and offer significant upside potential, and we think that the smaller caps that aren’t rated are even more opportunistic.
Be the first to comment