

Sezeryadigar
Background
For those who are interested in John and Jane’s full background, please click the following link here for the last time I published their full story. The details below are updated for 2022.
- This is a real portfolio with actual shares being traded.
- I am not a financial advisor and merely provide guidance based on a relationship that goes back several years.
- John retired in January 2018 and now only collects Social Security income as his regular source of income.
- Jane officially retired at the beginning of 2021, and she is collecting Social Security as her only regular source of income.
- John and Jane have decided to start taking draws from the Taxable Account and John’s Traditional IRA to the tune of $1,000/month each. These draws are currently covered in full by the dividends generated in each account.
- John and Jane have other investments outside of what I manage. These investments primarily consist of minimal-risk bonds and low-yield certificates.
- John and Jane have no debt and no monthly payments other than basic recurring bills such as water, power, property taxes, etc.
I started helping John and Jane with their retirement accounts because I was infuriated by the fees their previous financial advisor was charging them. I do not charge John and Jane for anything that I do, and all I have asked of them is that they allow me to write about their portfolio anonymously in order to help spread knowledge and to make me a better investor in the process.
Generating a stable and growing dividend income is the primary focus of this portfolio, and capital appreciation is the least important characteristic. My primary goal was to give John and Jane as much certainty in their retirement as I possibly can because this has been a constant point of stress over the last decade.
Dividend Decreases
No stocks in Jane’s Traditional or Roth IRA paid a decreased dividend during the month of August.
Dividend And Distribution Increases
Two companies paid increased dividends/distributions or a special dividend during the month of August in the Traditional and Roth IRAs.
I covered GIS in the Taxable Account update so I will only include information about the dividend increase. For those interested in reading the summary of these two companies the link is included at the end of the article.
General Mills
The dividend was increased from $.51/share per quarter to $.54/share per quarter. This represents an increase of 5.9% and a new full-year payout of $2.16/share compared with the previous $2.04/share. This results in a current yield of 2.90% based on the current share price of $75.07.
Royal Bank of Canada
Canadian banks have an impressive track record of paying dividends and providing solid returns but we are turning more cautious due to their exposure to the Canadian real estate market. EPS came in lighter than expected as the bank was forced to set aside additional funds in loan-loss reserves as we prepare for challenging economic conditions ahead. I am more interested in US banks moving forward because there is less exposure to severely overpriced real estate markets and rising rates have moderated the demand for housing and cooled lending activities.
I am not saying the stock is at a place where shares should be sold but I do believe that there will be much better buying opportunities ahead that will justify the risk/reward. Look for the stock price to drop into the mid-$80/share range with a dividend yield greater than 4%.
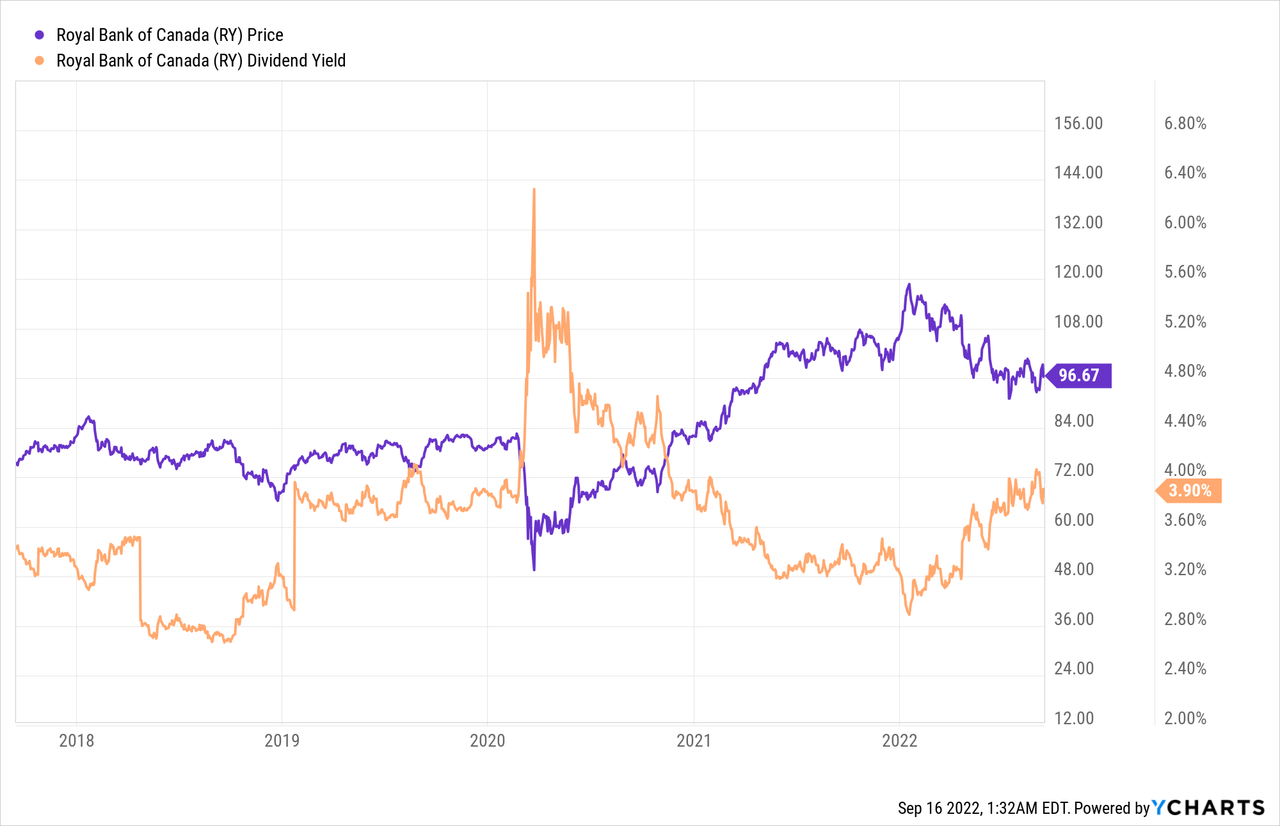
The dividend was increased from $1.20 CAD/share per quarter to $1.28 CAD/share per quarter. This represents an increase of 6.7% and a new full-year payout of $5.12 CAD/share compared with the previous $4.80 CAD/share. This results in a current yield of 3.90% based on the current share price of $96.67.
Retirement Account Positions
There are currently 38 different positions in Jane’s Traditional IRA and 23 different positions in Jane’s Roth IRA. While this may seem like a lot, it is important to remember that many of these stocks cross over in both accounts and are also held in the Taxable Portfolio.
Below is a list of the trades that took place in the Traditional IRA during the month of August.
Traditional IRA – 8-2022 – Trades (Charles Schwab)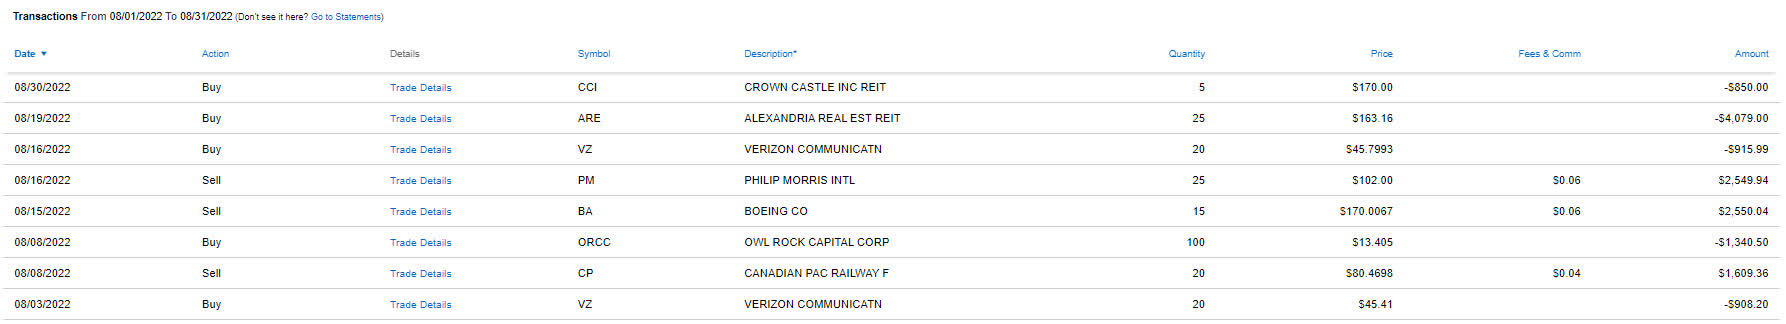
Below is a list of the trades that took place in the Roth IRA during the month of August.
Roth IRA – 8-2022 – Trades (Charles Schwab)
For a more detailed discussion about these trades and the rationale behind them please see my articles on Recent Purchases and Limit Trades.
August Income Tracker – 2021 Vs. 2022
Income for the month of August was up significantly year-over-year for Jane’s Traditional and Roth IRAs. The average monthly income for the Traditional IRA in 2022 is expected to be up about 11.9% based on current estimates (this is up from 5.3% in May due to LYB‘s special dividend) and the Roth IRA is looking to grow by 9.0%. This means the Traditional IRA would generate an average monthly income of $1,551.33/month and the Roth IRA would generate an average income of $646.07/month. This compares with 2021 figures that were $1,386.13/month and $592.61/month, respectively.
SNLH = Stocks No Longer Held – Dividends in this row represent the dividends collected on stocks that are no longer held in that portfolio. We still count the dividend income that comes from stocks no longer held in the portfolio even though it is non-recurring.
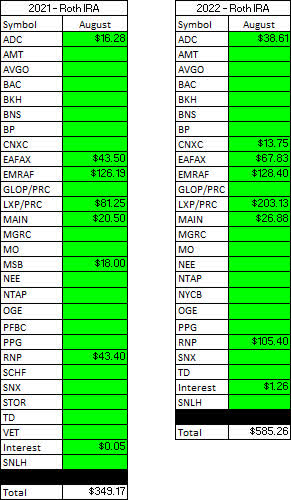
All images below come from Consistent Dividend Investor, LLC. (Abbreviated to CDI).
Traditional IRA – 2021 V 2022 – August Dividends (CDI) Roth IRA – 2021 V 2022 – August Dividends (CDI)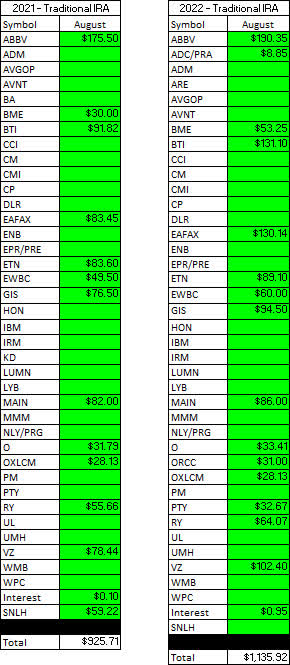
Here is a graphical illustration of the dividends received on a monthly basis for the Traditional and Roth IRAs.
Retirement Projections – 2022 – August – Monthly Dividends (Bar Graph) (CDI)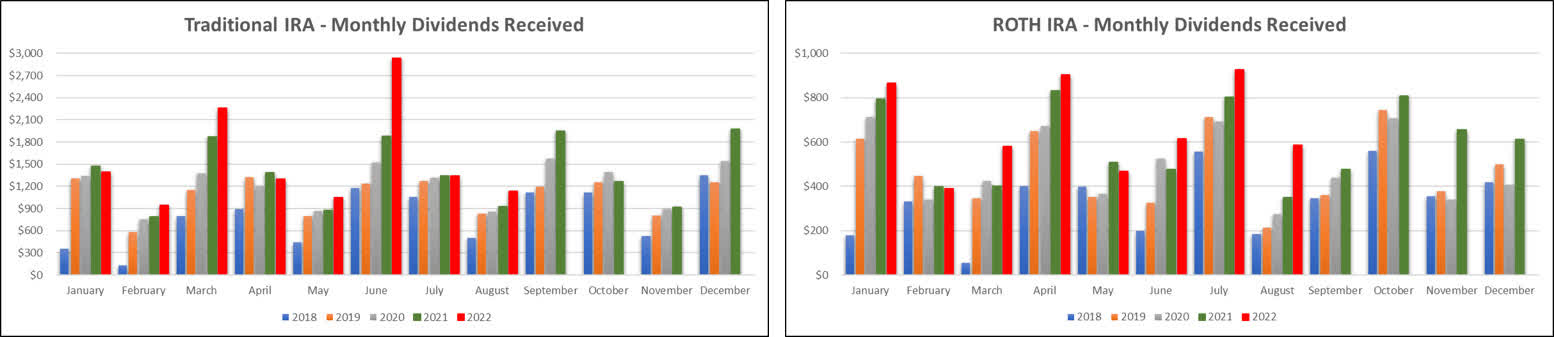
The table below represents the actual full-year results for 2022 and the prior year.
Retirement Projections – 2022 – August (CDI)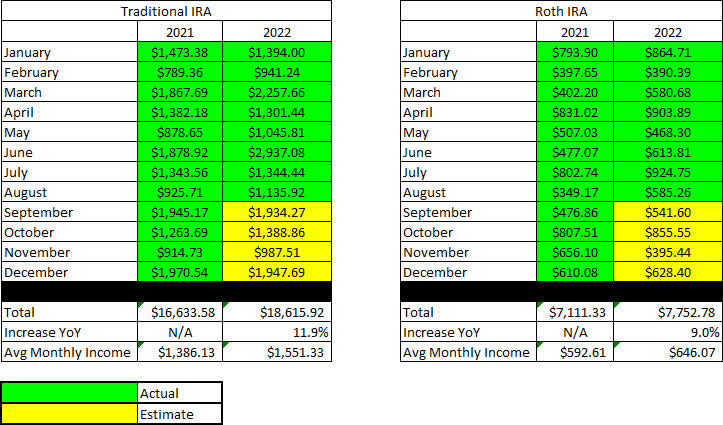
Below is an expanded table that shows the full dividend history since inception for both the Traditional IRA and Roth IRA.
Retirement Projections – 2022 – August – 5 YR History (CDI)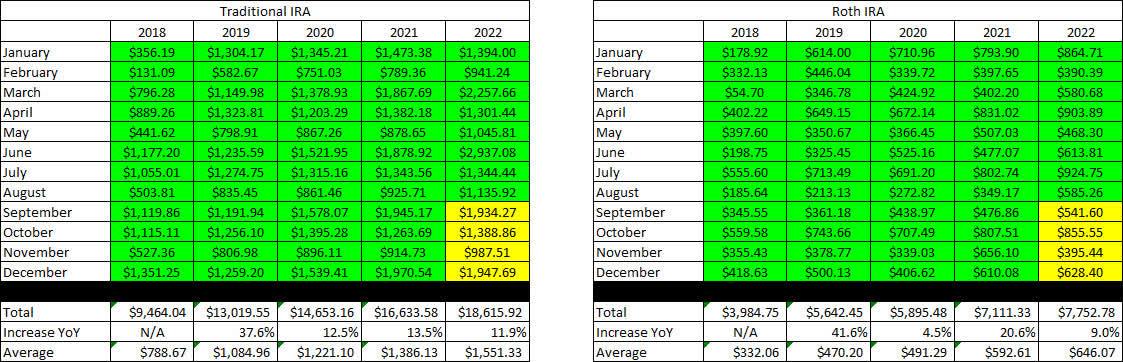
I have included line graphs that better represent the trends associated with Jane’s monthly dividend income generated by her retirement accounts. The images below represent the Traditional IRA and Roth IRA, respectively.
Retirement Projections – 2022 – August – Monthly Dividends (CDI)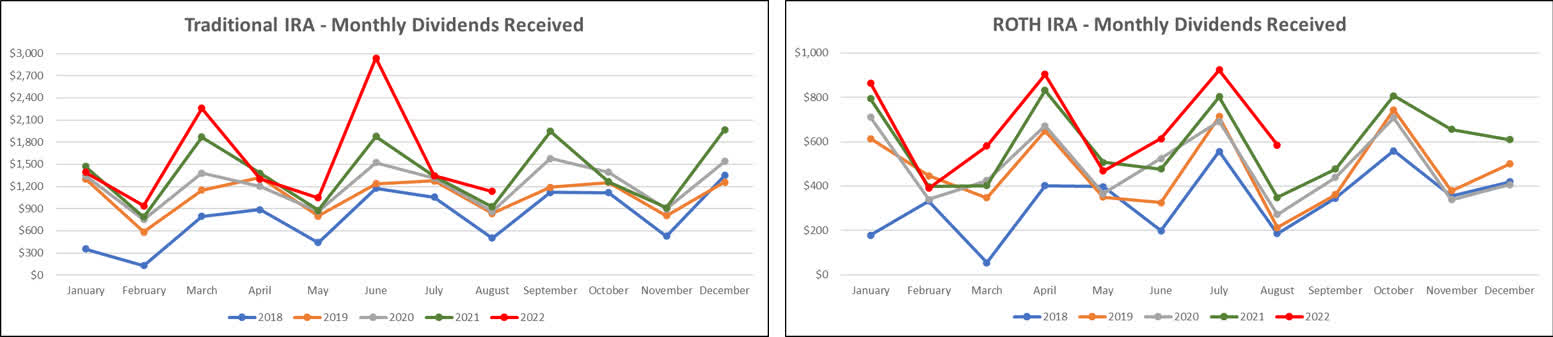
Here is a table to show how the account balances stack up year over year (I previously used a graph but believe the table is more informative).
It is worth noting that with John and Jane Retired, there will be no additional contributions to these accounts. In fact, they have already begun to take regular distributions from the Taxable Account and John’s Traditional IRA.
Retirement Account Balances – 2022 – August (CDI)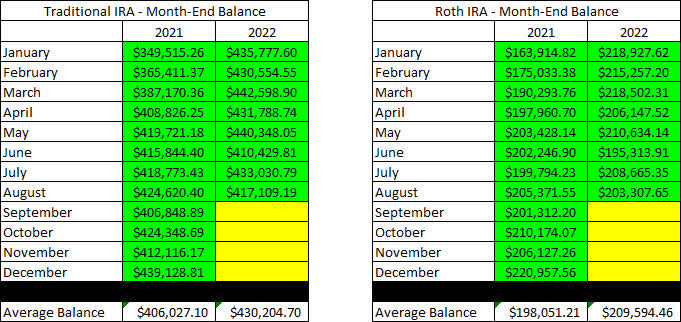
The next images are the tables that indicate how much cash Jane had in her Traditional and Roth IRA Accounts at the end of the month as indicated on their Charles Schwab statements.
Retirement Projections – 2022 – August – Cash Balances (CDI)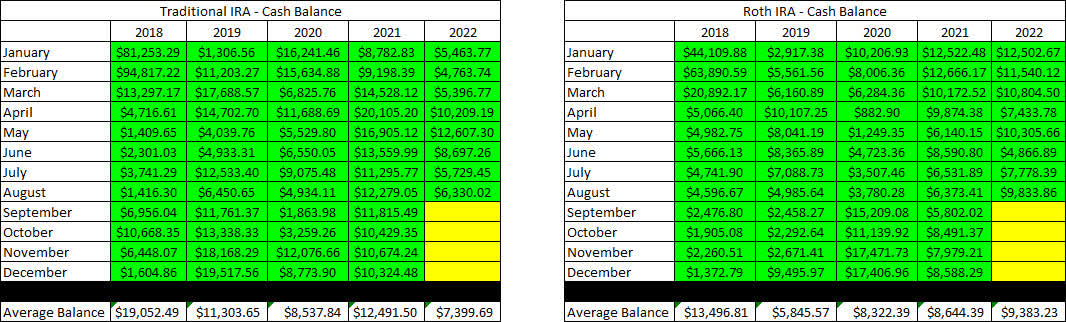
The next image provides a history of the unrealized gain/loss at the end of each month in the Traditional and Roth IRAs going back to the beginning in January of 2018.
Retirement Projections – 2022 – August – Unrealized Gain-Loss (CDI)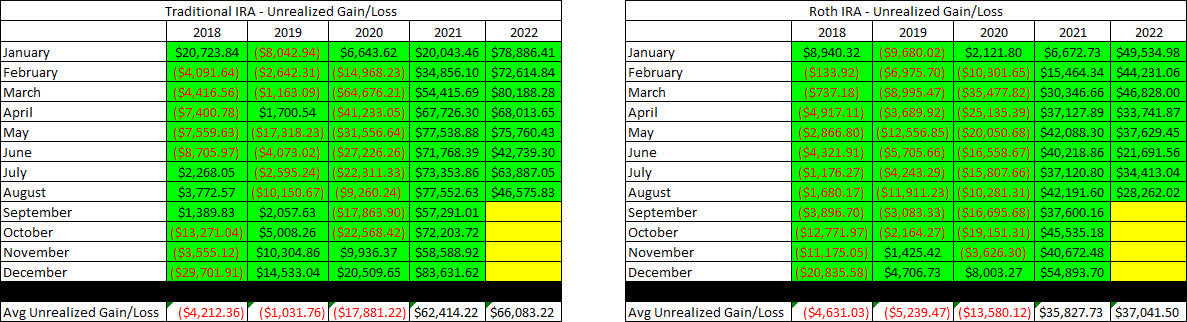
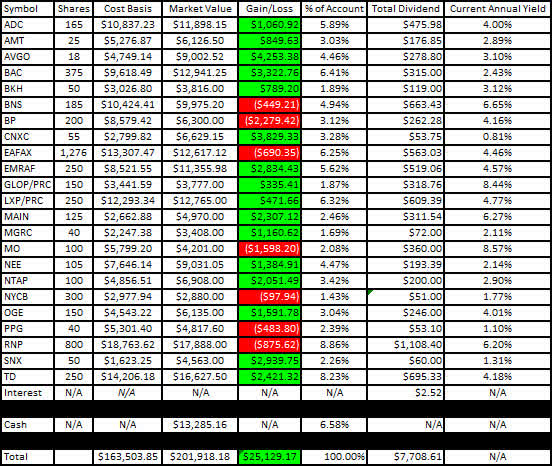
I like to show readers the actual unrealized gain/loss associated with each position in the portfolio because it is important to consider that in order to become a proper dividend investor, it is necessary to learn how to live with volatility. The market value and cost basis below are accurate at the market close on September 15th.
Here is the unrealized gain/loss associated with Jane’s Traditional and Roth IRAs.
Traditional IRA – 2022 – August – Gain-Loss (CDI) Roth IRA – 2022 – August – Gain-Loss (CDI)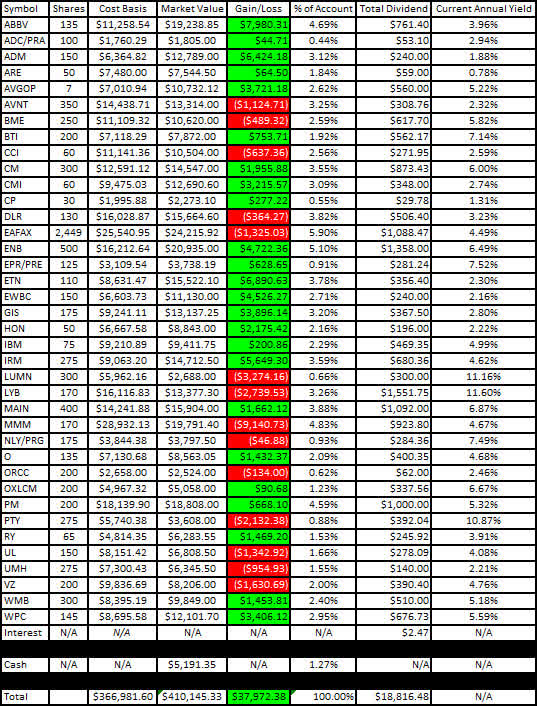
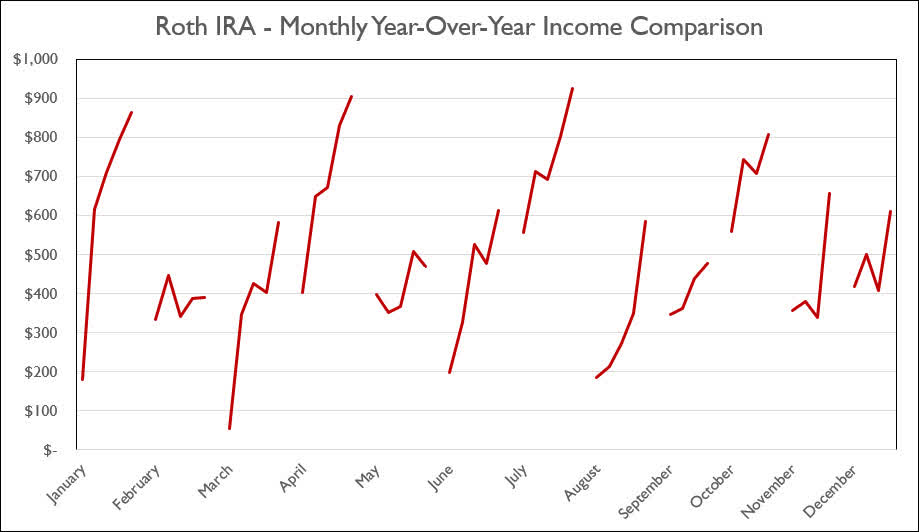
The last two graphs show how dividend income has increased, stayed the same, or decreased in each respective month on an annualized basis. I believe that the graph will continue to become more valuable as more years of data become available (with the fifth year of data being added, we can really see the trajectory of the income change for each month).
Traditional IRA – 2022 – August – Monthly Year-Over-Year Comparison (CDI) Roth IRA – 2022 – August – Monthly Year-Over-Year Comparison (CDI)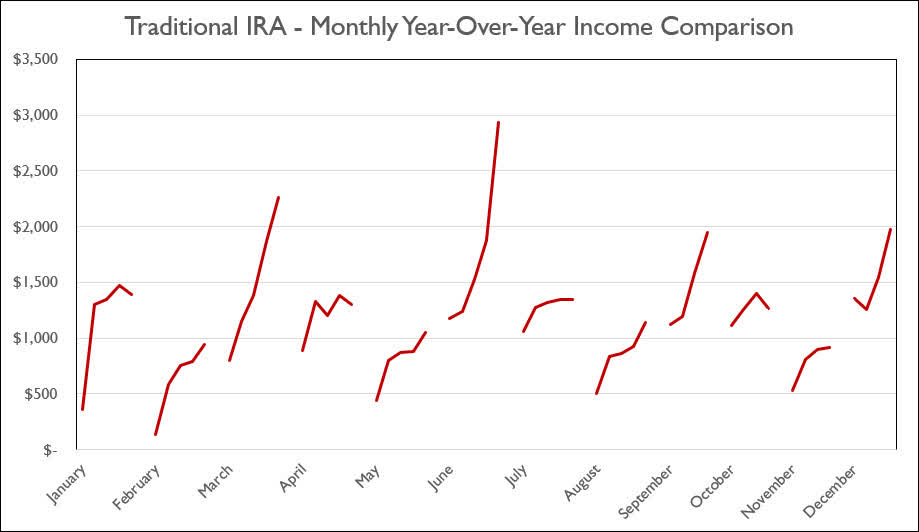
Conclusion
Dividend income growth continues to be strong as both Jane’s Traditional and Roth IRAs will likely generate double-digit dividend growth in 2022 (compared to 2021).
I think it is worth pointing out that the growth both accounts are experiencing is not due to any sort of weak/negative dividend growth as a result from market struggles in 2020 and 2021. John’s portfolio did see some negative dividend growth in 2020/2021 which is why his dividend growth for 2022 in both of his retirement accounts is basically double the growth rate seen in Jane’s accounts.
I think it’s pretty incredible when you consider that Jane’s accounts are on track to produce double the dividend income (when using future estimates) over the last five years (January 2018 through December 2022). Here is the same image from the previous section to show this.
Retirement Projections – 2022 – August (CDI)
A few people have complained about John and Jane’s Taxable Account dividends because the funds in this account have fluctuated considerably due to major sales (which resulted in large deposits) in major purchases (which resulted in large withdrawals). The nice part about the Traditional and Roth IRAs is that these numbers cannot be manipulated in the same way because they are the only retirement assets that John and Jane have ever had (no 401k rollovers for example) so the largest change the accounts have experienced are from $7000 annual contributions when they were working. Now that both of them are retired there is nothing coming into these accounts, and if anything, we will soon see more regular withdrawals to supplement their retirement income.
August Articles
I have provided the link to the August 2022 Taxable Account below.
The Retirees’ Dividend Portfolio: John And Jane’s August Taxable Account Update
Below is my most recent article for purchases and limit trades. I try to make sure I get a new one out this week.
The Retirees Dividend Portfolio: Recent Purchases And Limit Trades Through August 19th
In Jane’s Traditional and Roth IRAs, she is currently long the following mentioned in this article: AbbVie (ABBV), Agree Realty (ADC), Agree Realty Preferred Series A (ADC.PRA), Archer-Daniels-Midland (ADM), Broadcom (AVGO), Avient (AVNT), Broadcom Preferred Series A (AVGOP), Bank of America (BAC), Black Hills Corp. (BKH), BlackRock Health Sciences Trust (BME), Bank of Montreal (BMO), Bank of Nova Scotia (BNS), BP (BP), British American Tobacco (BTI), Canadian Imperial Bank of Commerce (CM), Cummins (CMI), Concentrix (CNXC), Digital Realty (DLR), Eaton Vance Floating-Rate Advantage Fund A (EAFAX), Enbridge (ENB), EPR Properties Preferred Series E (EPR.PE), Eaton Corporation (ETN), Emera Inc. (OTCPK:EMRAF), East West Bancorp (EWBC), General Mills (GIS), GasLog Partners Preferred C (GLOP.PC), Honeywell (HON), International Business Machines (IBM), Iron Mountain (IRM), Lexington Realty Preferred Series C (LXP.PC), Lumen Technologies (LUMN), LyondellBasell (LYB), Main Street Capital (MAIN), McGrath RentCorp (MGRC), 3M (MMM), Altria (MO), Annaly Capital Preferred Series G (NLY.PG), NextEra Energy (NEE), NetApp (NTAP), New York Community Bank (NYCB), Realty Income (O), OGE Energy Corp. (OGE), Oxford Lane Capital Corp. 6.75% Cum Red Pdf Shares Series 2024 (OXLCM), Philip Morris (PM), PPG Industries (PPG), PIMCO Corporate & Income Opportunity Fund (PTY), Cohen & Steers REIT & Preferred Income Fund (RNP), Royal Bank of Canada (RY), TD SYNNEX Corp. (SNX), STORE Capital (STOR), Toronto-Dominion Bank (TD), Unilever (UL), UMH Properties (UMH), Verizon (VZ), Williams Companies (WMB), W. P. Carey (WPC).
Be the first to comment