

Justin Sullivan/Getty Images News
In this article we are going to focus on some of the economic indicators that could help us gauge where we are in the business cycle. We are going to put emphasis mainly on leading and coincident indicators, but some lagging indicators will be highlighted as well. After that, we are going to try to gauge what implications the business cycle (the “BC”) could have on Meta Platforms, Inc.’s (NASDAQ:FB) business in the near term, and whether the current price level could be an attractive entry point.
Where are we in the business cycle?
1.) Leading indicators
Leading economic indicators usually have turning points that are expected to precede those of the overall economy. These indicators are believed to be useful for predicting the economy’s future state in the near term.
Average weekly hours
Firms are not likely to immediately lay off people when a downturn occurs. First, overtime is cut normally, to avoid the costs associated with rehiring in case the downturn is short-lived. Therefore, average weekly hours tend to move up and down before the general economy.
Average weekly hours (Tradingeconomics.com)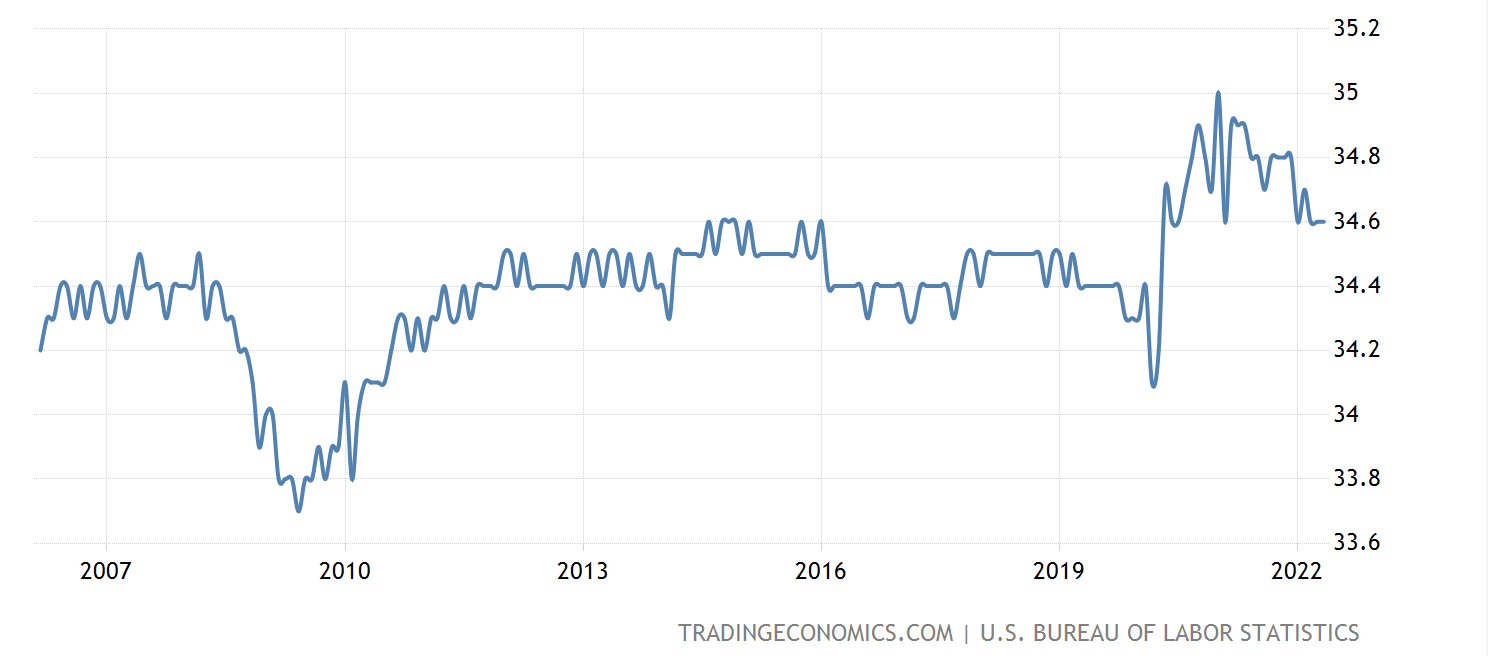
The decline in average weekly hours could signal that businesses are cutting back on overtime of the employees, meaning that the peak of the BC has potentially been reached. On the other hand, average weekly hours remain significantly above the historic values, therefore we do not interpret this indicator as clearly negative. We also have to point out that main firms in the recent weeks have already announced that they are planning to slow or completely stop their hiring.
Building permits
A building permit is an official permission to construct a new building. The number of building permits granted can serve as a leading economic indicator, as it reflects the demand for new units. A low or decreasing level of building permits could signal that the peak of the business cycle will be reached in the near future.
U.S. Building permits (Tradingeconomics.com)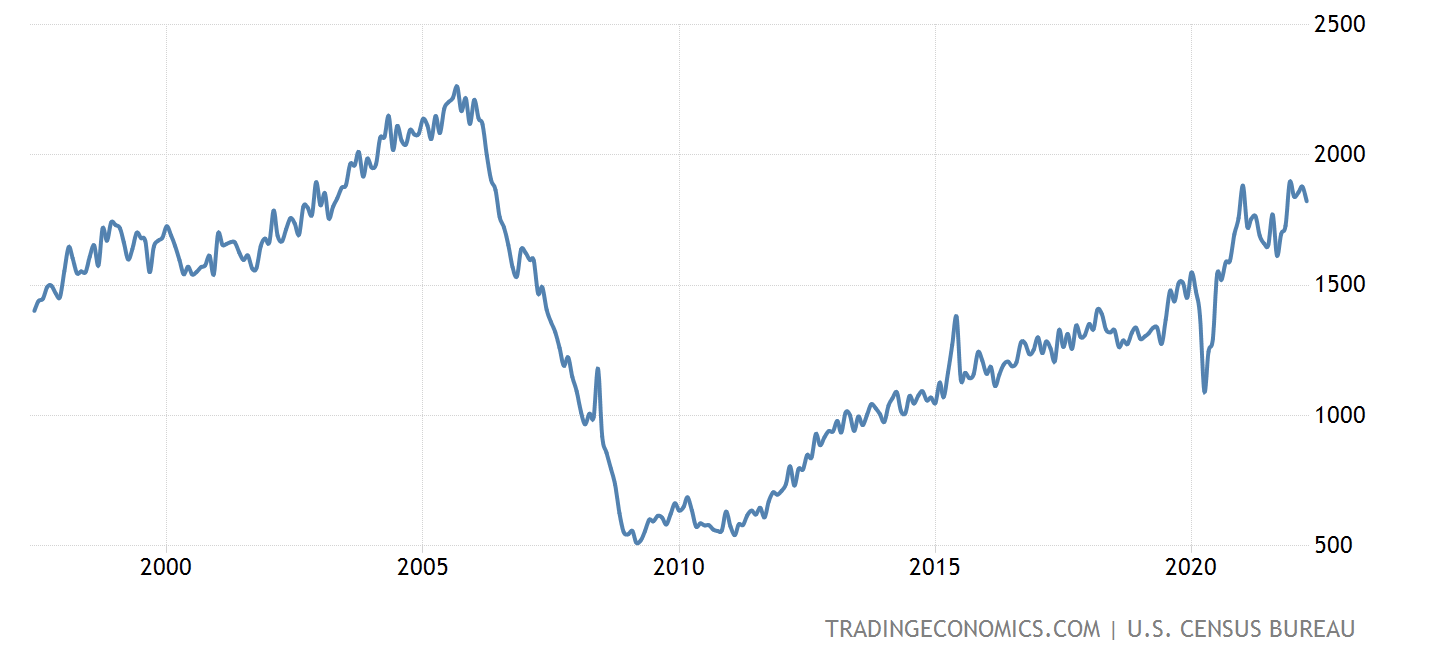
The U.S. building permits are showing the lowest reading in five months, however they remain at elevated levels. As of now, we believe this indicator is not yet indicating the peak of the cycle. On the other hand, we have to keep in mind that the increasing interest rates make mortgages much more expensive than in the previous years. As most buildings and housing units are financed through mortgages, more expensive mortgages could eventually lead to a decline in demand.
ISM Manufacturing New Orders
This indicator is actually a diffusion index, which measures the percentage of components in a group that are rising in the same period. It indicates how widespread a certain trend is among the individual components.
A reading above 50% signals that the manufacturing economy is in general expanding; below 50% signals that it is in general contracting. A significant decline could indicate weak demand and therefore could lead to recessions.
United States ISM Manufacturing New Orders (Tradingeconomics.com)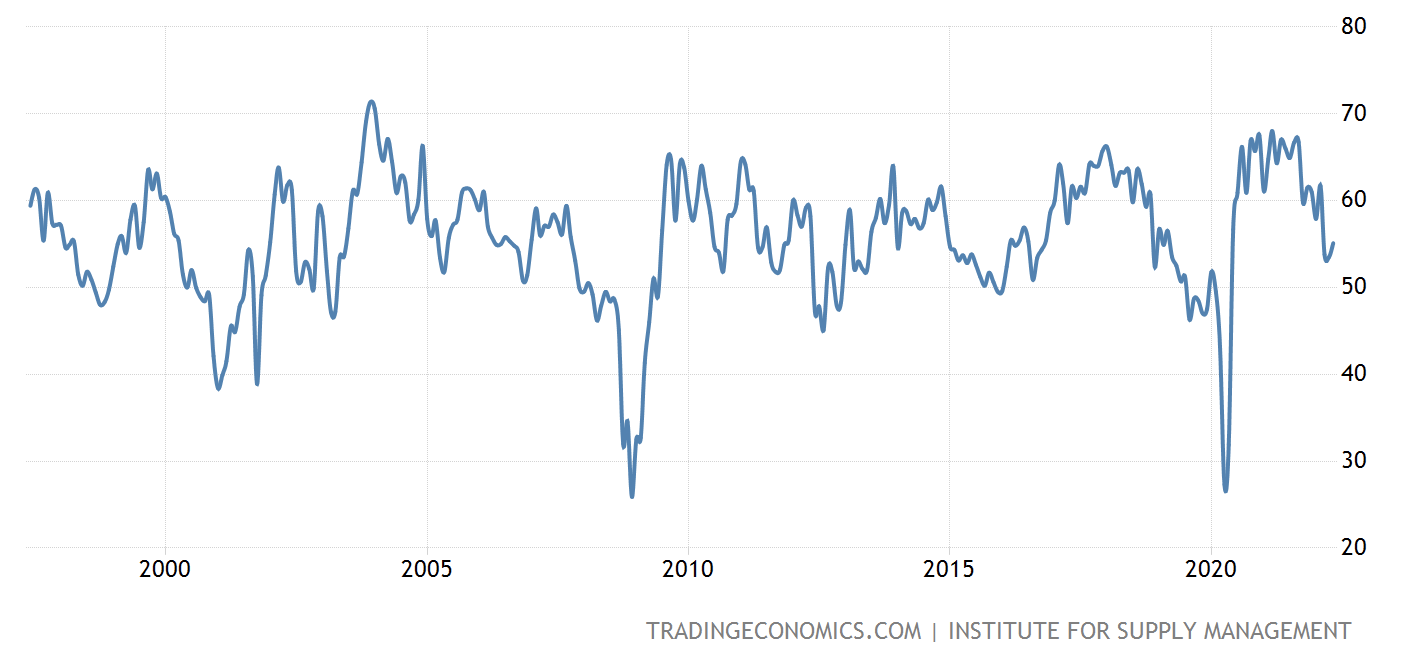
Although this indicator has declined recently, it remained above 50. Therefore our interpretation is that in general the manufacturing economy keeps expanding. Important to note that at the peak, growth could be fueled by new orders, which are intended to increase capacity.
Manufacturers’ new orders for non-defense capital goods excluding aircrafts
This indicator captures the business expectations and offers a signal of potential up or down movements of the economy.
New orders for non-defence capital goods excluding aircrafts (Tradingeconomics.com)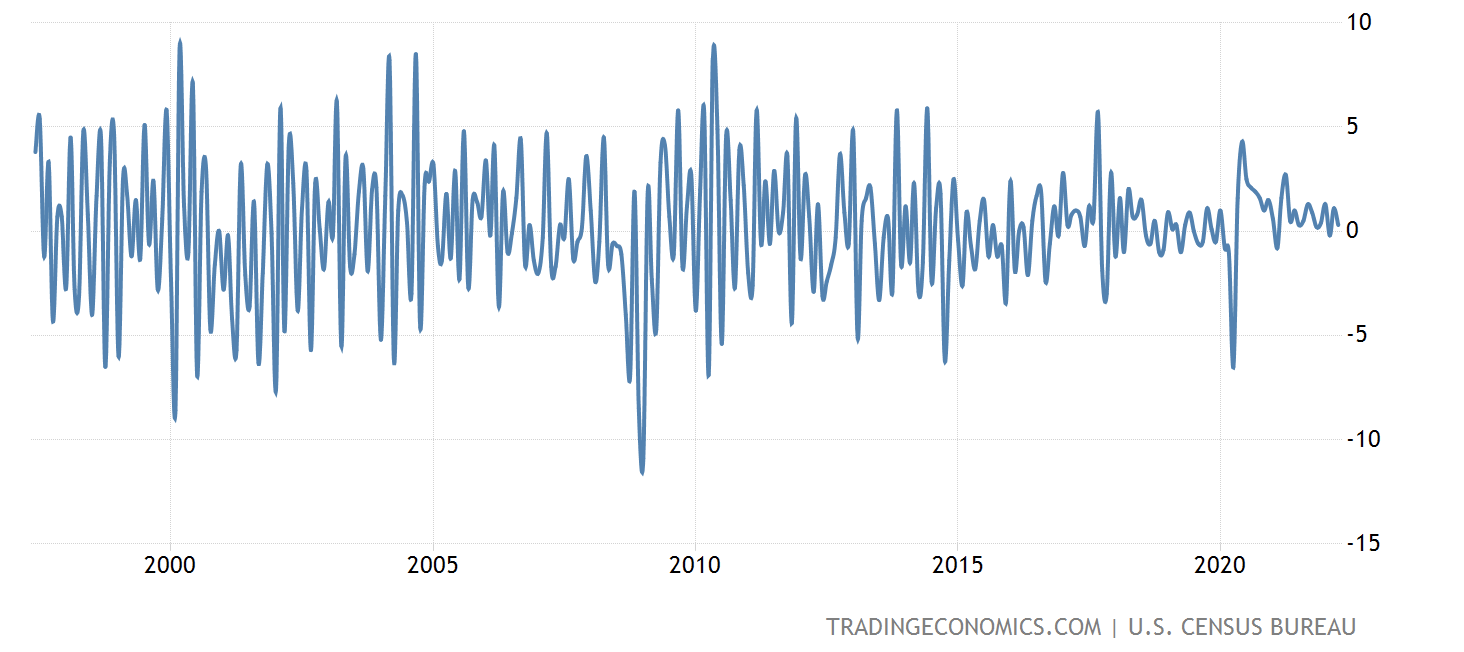
This indicator has not been the most accurate predictor of past recessions, but as its value remains above 0, it reflects positive business expectations in the near future.
Consumer confidence
Consumer confidence has been steadily declining over the past several months reaching its 10-year low and even approaching levels seen in 2008-2009.
U.S. consumer confidence (Tradingeconomics.com)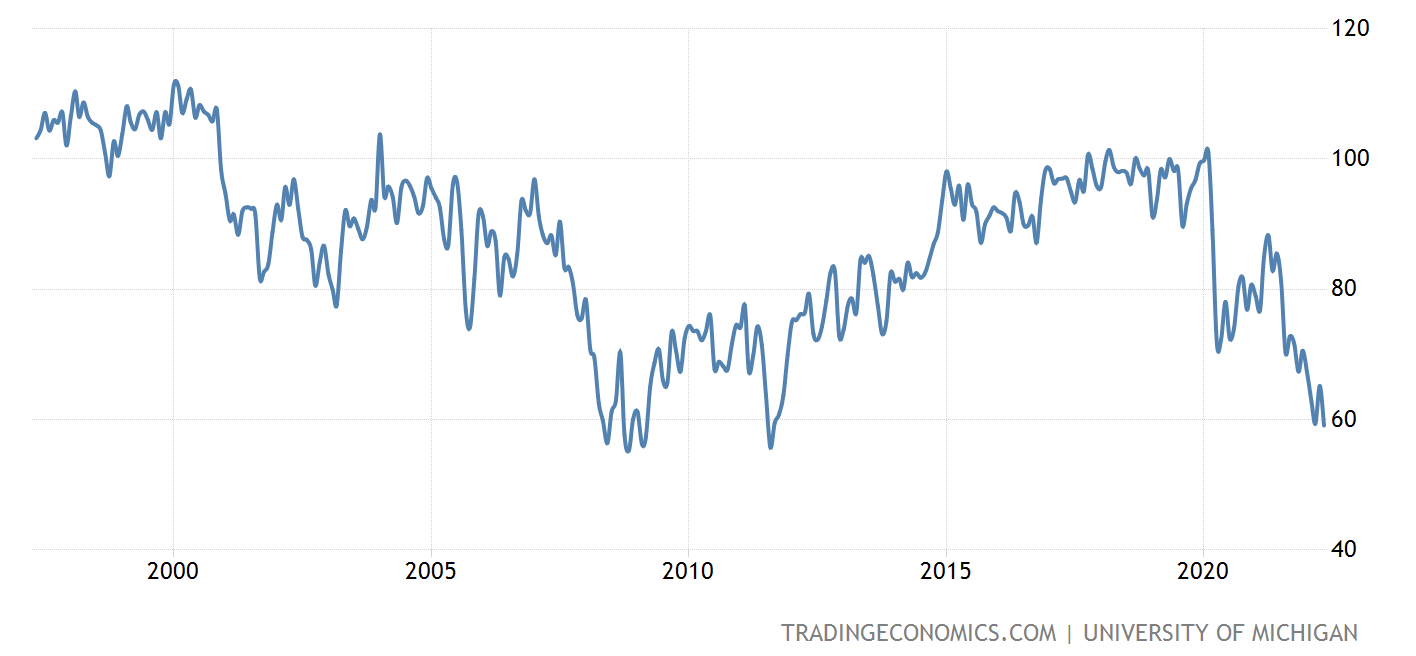
Although consumer spending has remained strong in the first quarter of 2022, we believe that the declining consumer confidence will eventually result in a decrease of spending. Such a decrease could have negative impacts on the demand for consumer durables, services, and discretionary products, which are considered non-essential. In our view, the low consumer confidence is the only indicator in our selected leading indicators that is clearly signaling that we are at or close to the peak of the cycle.
2.) Coincident Indicators
Industrial production index
This indicator measures the output of businesses integrated in the industrial sector of the U.S. economy. Manufacturing is often considered to be the most important sector as it accounts for 78% of the total production.
Industrial production index (fred.stlouisfed.org)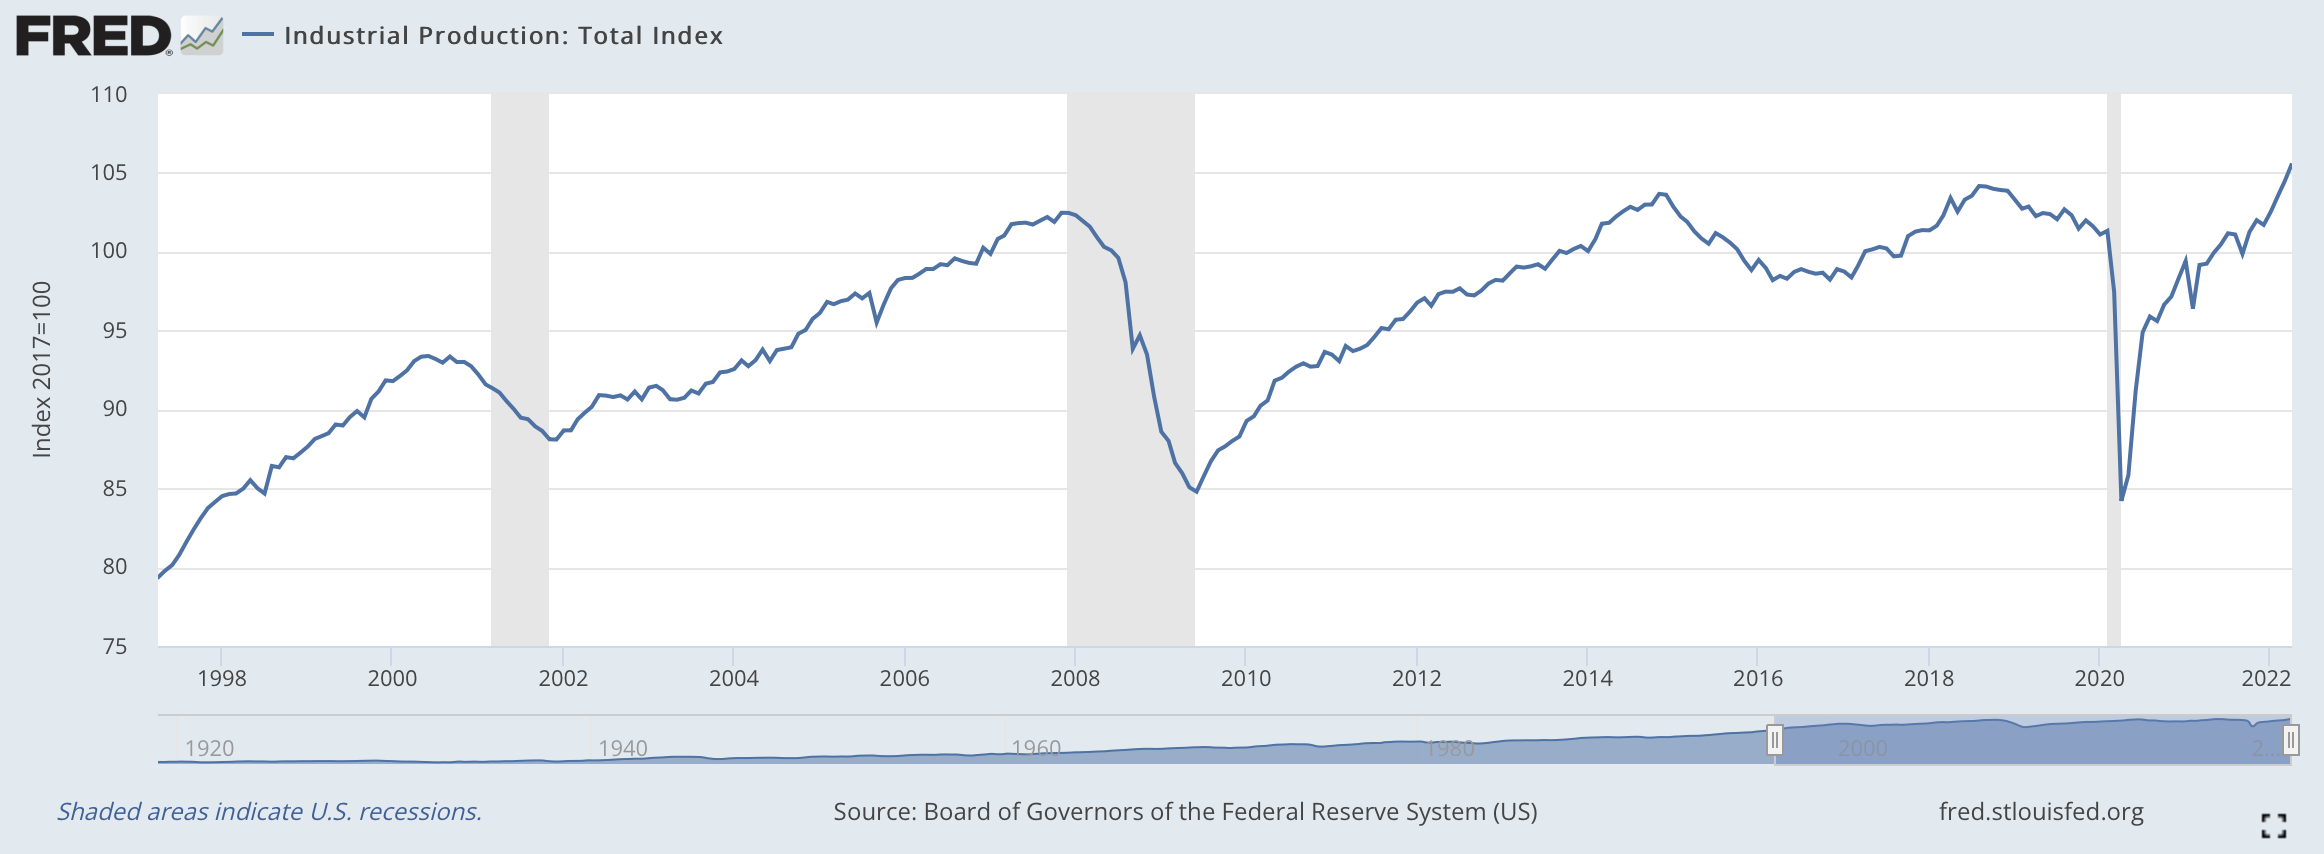
This indicator also signals that the economy currently is still the expansion phase, however this index does not provide a basis for forecasting.
3.) Lagging Indicators
Initial jobless claims
The average weekly initial claims for unemployment insurance is regarded as a sensitive test of initial layoffs and rehiring. As firing and hiring tend to come only after the cut of overtime, we regard initial jobless claims as a lagging indicator for our analysis.
U.S. Initial jobless claim (Tradingeconomics.com)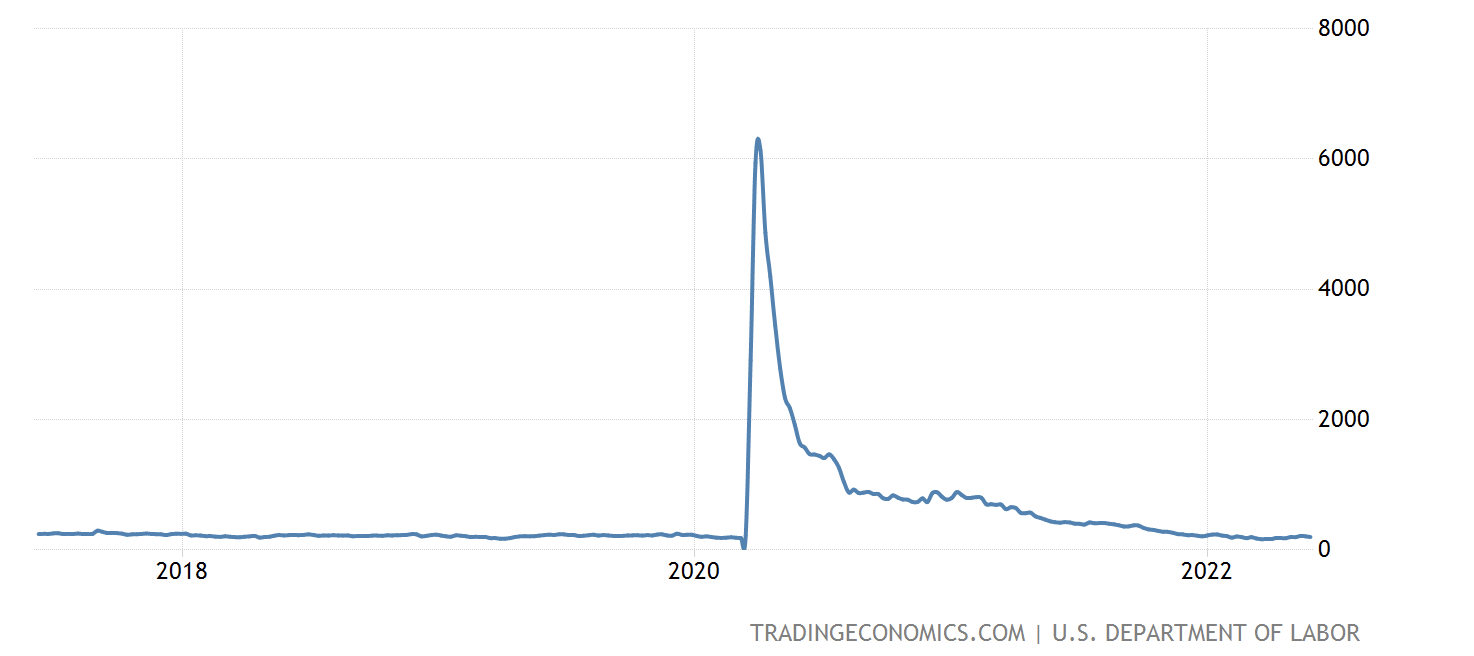
After the huge spike in 2020, the number of initial jobless claims have steadily declined to pre-pandemic levels. At the end of May, claims have been even below market expectations, signaling a tight labor market.
Unemployment rate
Unemployment tends to be at its highest slightly after the recovery has begun, while is at its lowest slightly after the economy has reached its peak.
U.S. Unemployment rate (Tradingeconomics.com)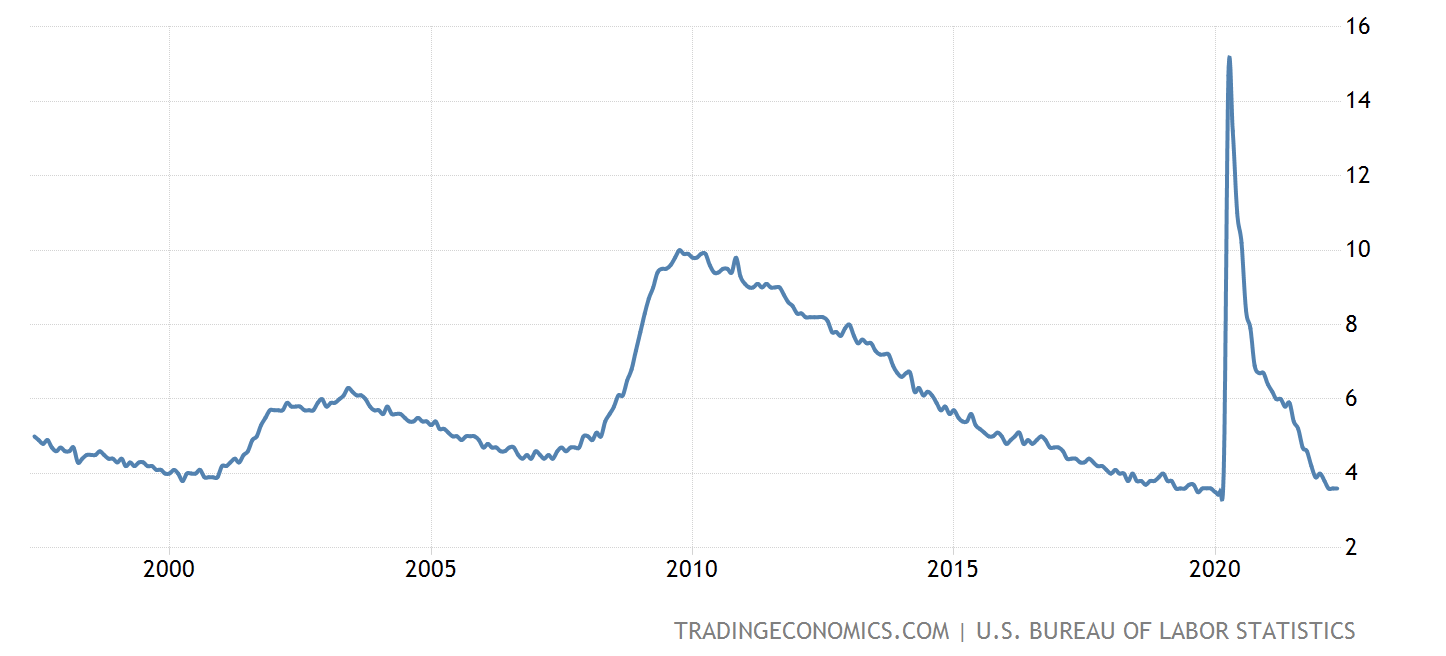
Although businesses have continued hiring in the recent period, many firms have signaled that they are intending to slow their pace. These trends indicate that we might be at the peak of the current cycle.
To sum up
According to the above mentioned indicators, we interpret that we are still in the expansion phase of the business cycle, however some indicators are signaling that we are nearing or at the peak already. Important to understand that these indicators do not always give clear signals and may even be contradictory. Further, their interpretation is often subject to the personal views of the analysts. Also, what has been presented here is not an exhaustive list of indicators, but in our opinion, they could be a quite representative group for gauging what to expect for FB’s stock in the near term.
So what could this economic environment mean for FB’s business? First, we will take a brief look at Meta Platforms’ business and their main sources of income, then we will discuss how the BC could impact these sources in the near- and long term.
Meta Platforms
Overview
Meta Platforms generates most of its revenue and all of its operating income from advertisements.
Segment results (Meta Platforms)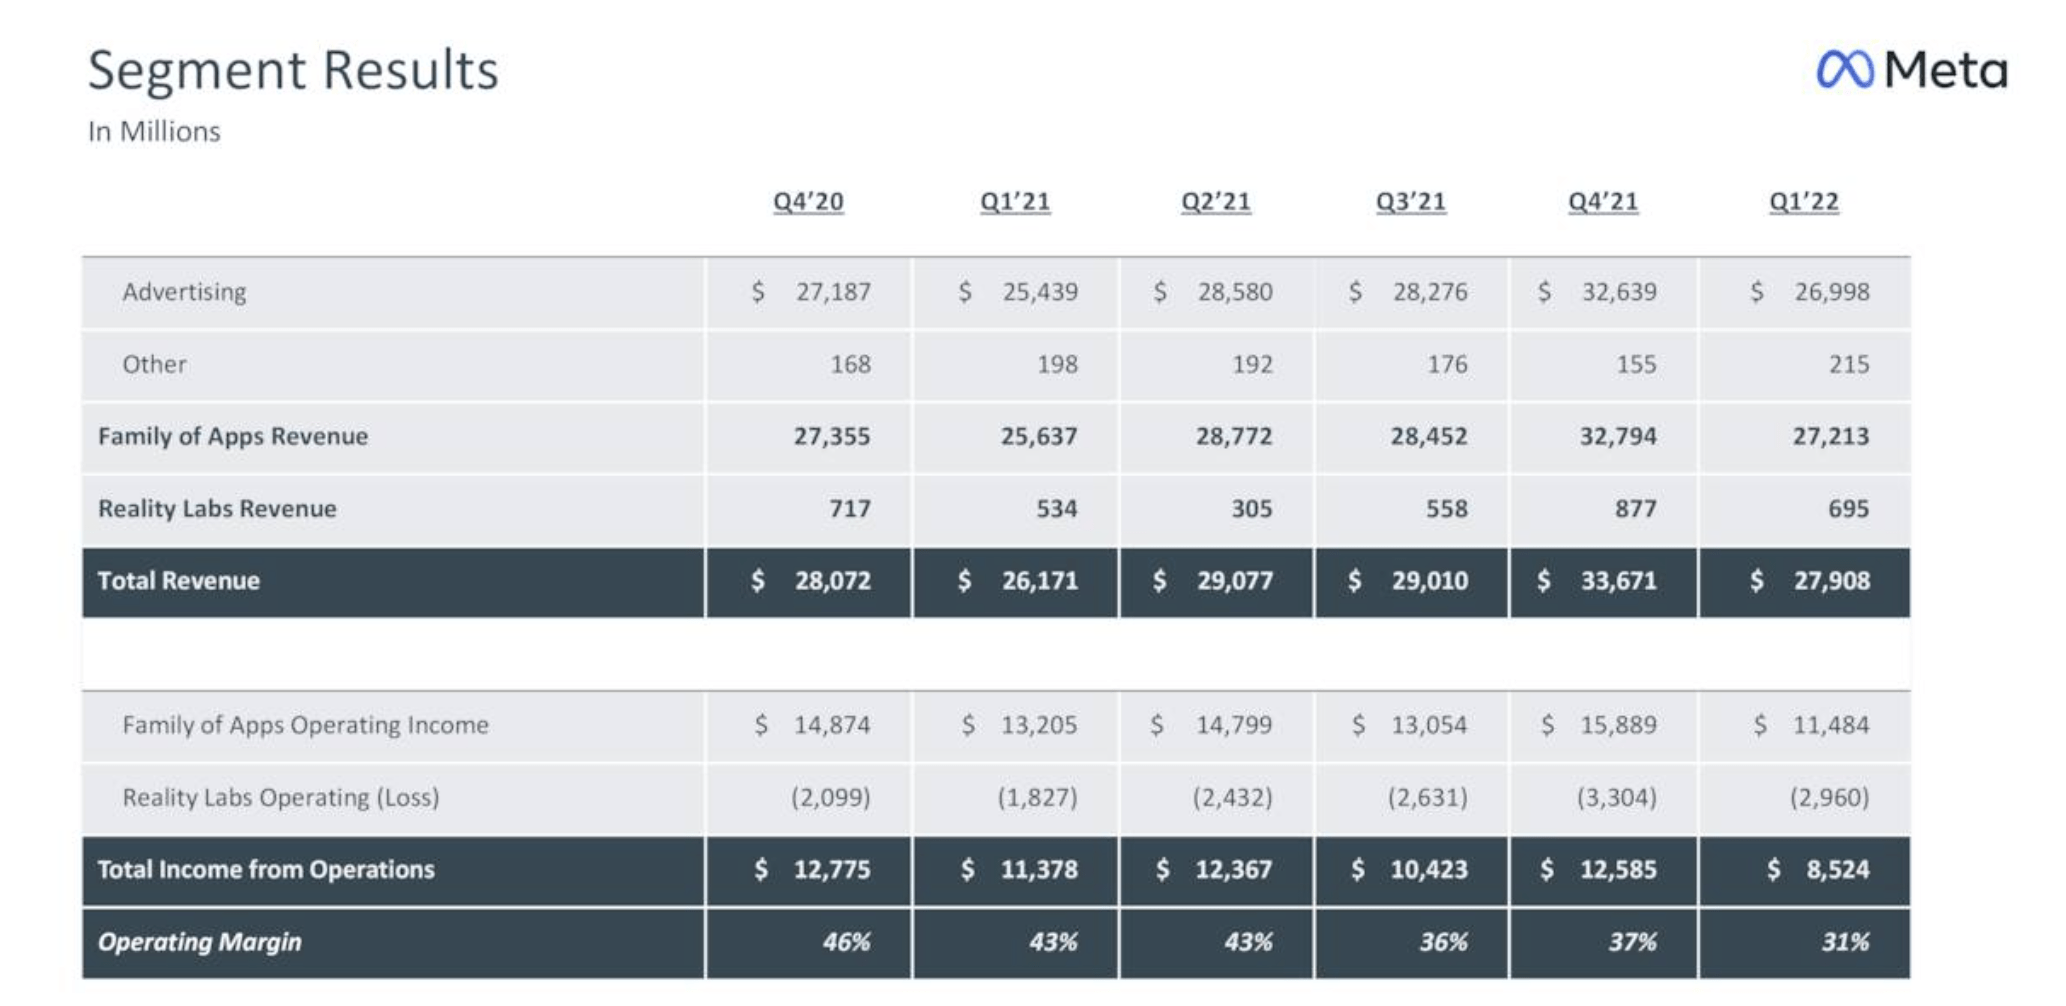
Although revenue has remained strong, Meta’s ad sales growth has been the slowest in a decade. Its operating margin has declined also significantly YoY, and not only due to the operating loss from Reality Labs.
Expenses as a percentage of revenue (Meta Platforms)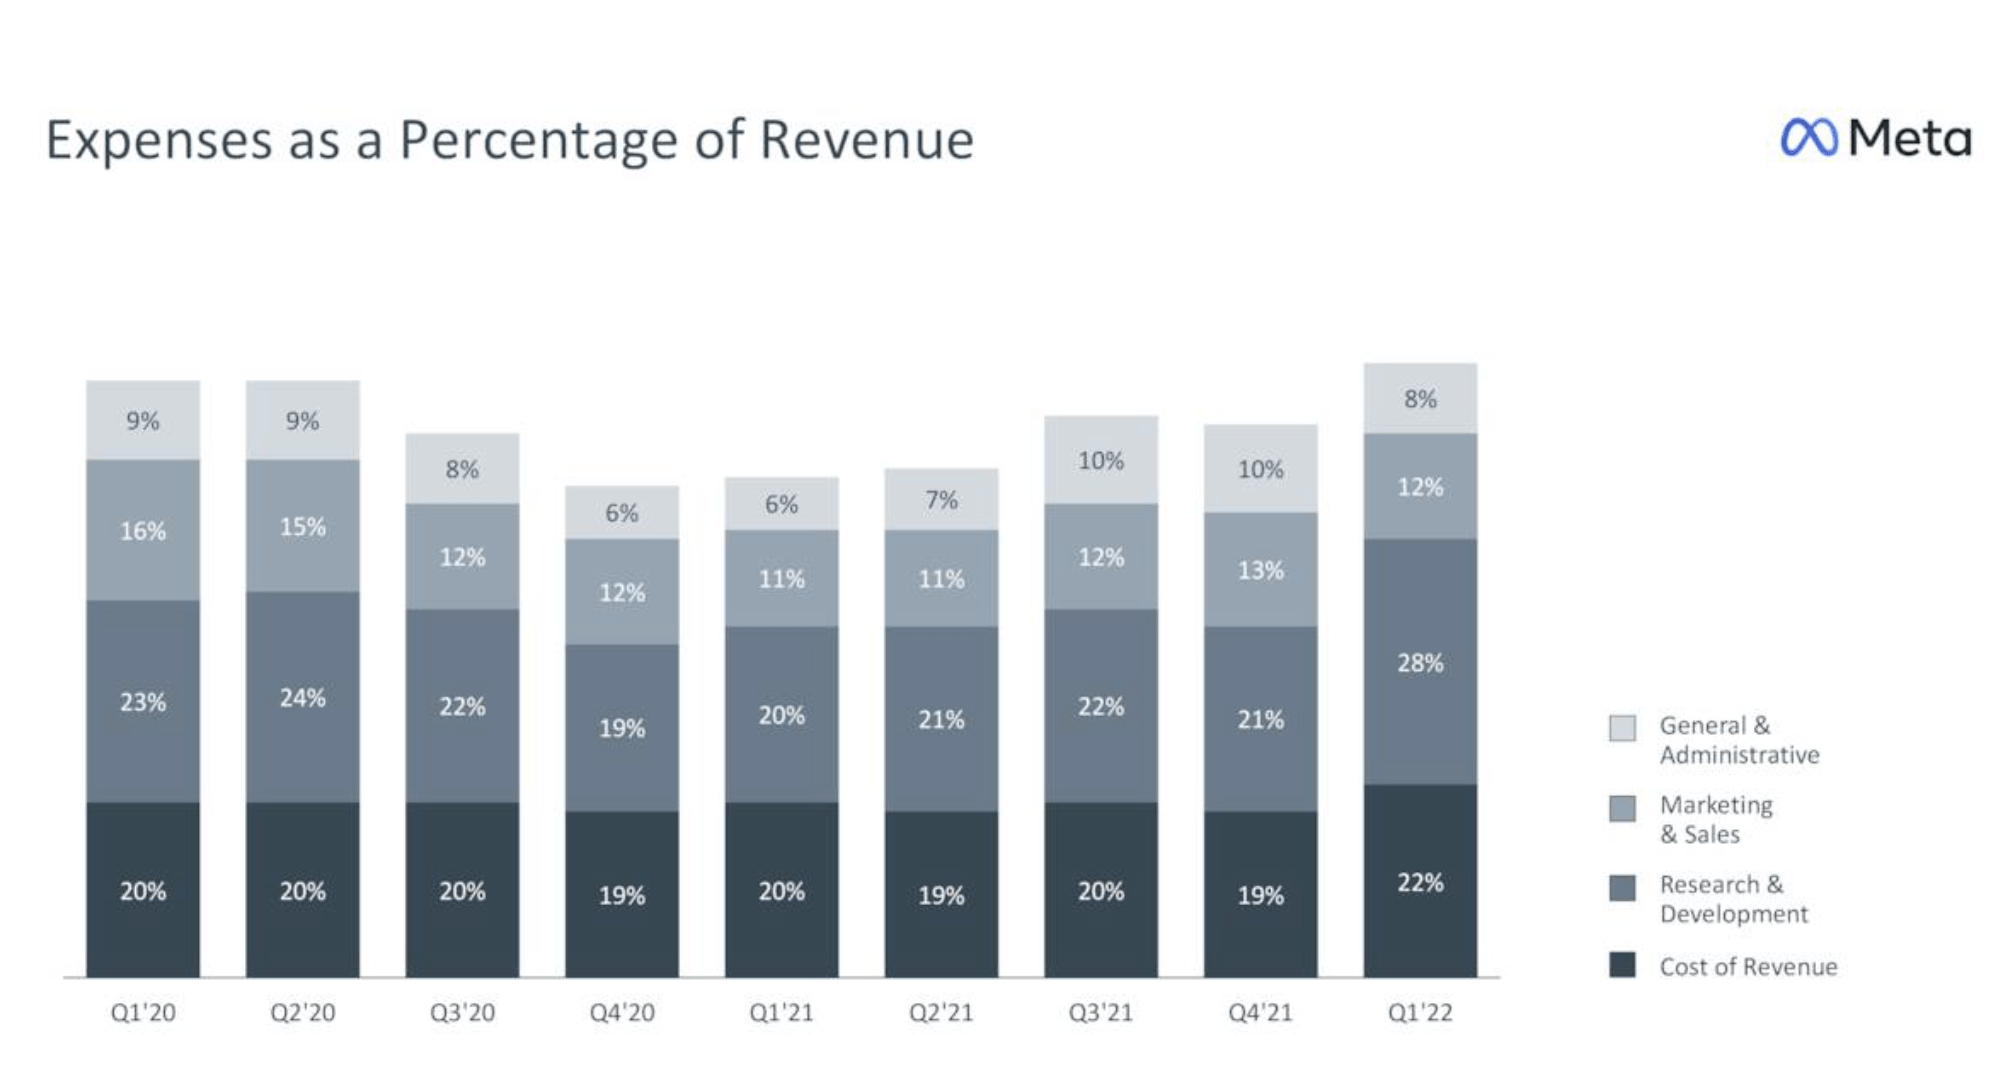
Meta’s expenses have grown in each category as a percentage of revenue, resulting in an overall decline in earnings per share year over year.
We are not too concerned about these results however, because last year Meta has already communicated that they are expecting a slow down in revenue growth due to increased competition, Apple’s (AAPL) privacy changes and their yet limited ability to monetize on reels. We believe that the investors have priced most of these bad news in already into FB’s stock price.
But we would like to look at the business from a bit broader perspective.
As currently Meta’s main source of revenue is the advertisement business, we have to understand what is the impact of the business cycle on the consumer behavior and on the overall advertisement business.
Impact of BC on consumer behavior
The business cycle has the largest impact on spending on consumer durables, including auto, motorcycles, appliances etc., and on services, including entertainment, travel, communications. Consumer discretionary items are also impacted, however consumer non-durables, like medicine, food or household products normally remain relatively unaffected.
Spending in both the expansion and slowdown phase normally remains above average, and this is the trend that we are currently still observing.
Although consumer spending has remained strong in the first quarter, based on our interpretation of the above mentioned indicators, especially the consumer confidence, we expect a decline in the consumer spending in the near term. Despite the decline, we do not necessarily expect consumers to buy less of a certain product type, but they are likely to change their spending habits by switching to cheaper products or to cheaper stores.
Impact of BC on advertising
When consumer spending declines or slows as a result of the low consumer confidence, the firms’ revenues and earnings are likely to follow this trend as well. In such times, firms generally aim to reduce costs. Several studies have shown (e.g: Deleersnyder et al., 2009, Kashmiri and Mahajan 2014) that most firms tend to cut back on advertising in times of contraction and resume once the expansion has started again. Some of the factors explaining the reduced advertisement spending during contraction are:
1.) it is a cost rather than an investment;
2.) low commitment to and flexibility in media contracts; and
3.) less competitors engage in advertising during contraction, which means that a lower spending level can be sufficient to achieve the same effectiveness.
We agree that a reduction in the aggregate advertisement is likely; however, in our view, the impact on internet advertisement may be slightly different.
Internet advertisement has significantly more flexibility, it can be more cost efficient and it offers better targeting opportunities. The success of different advertisement campaigns can also be much better measured and quantified. Due to these reasons, our personal view is that internet advertisement may not be as severely impacted as other forms of advertisements.
Although many of the ads on Facebook and Instagram are related to consumer discretionary products and services, due to the above mentioned argument, we believe that FB’s ad business will not likely be severely impacted.
Conclusions
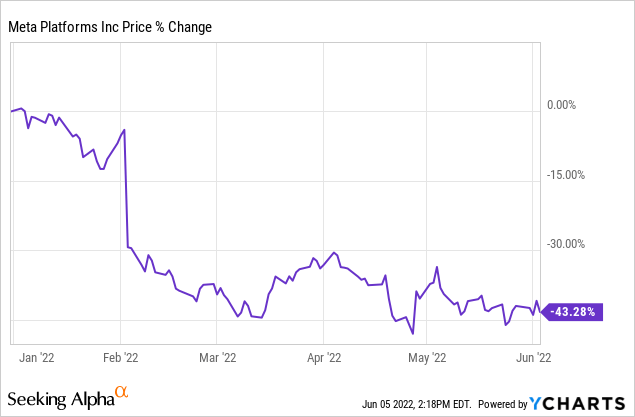
FB’s stock price has fallen sharply year-to-date, due to news related to increased competition from TikTok, headwinds due to Apple’s privacy changes, the increasing interest rates, and the development of the number of their monthly average users (“MAUs”).
Currently FB is trading at P/E ratio (FWD) of ~16x, which is slight below the communication services sector median and substantially lower than the firm’s 5 year historic average.
Despite potential temporary headwinds, including the potential decline in advertisement spendings, we believe that FB’s current valuation is very attractive for long term investors. Further, FB’s investment in the metaverse is an attractive a way to diversify the business and reduce the reliance on advertisement as the major source of income.
In our opinion FB is a great long term play and the current price level could be an attractive entry point.
Be the first to comment