

tiero
Recession risk in 2023 is on everyone’s mind and for good reason.
Daily Shot
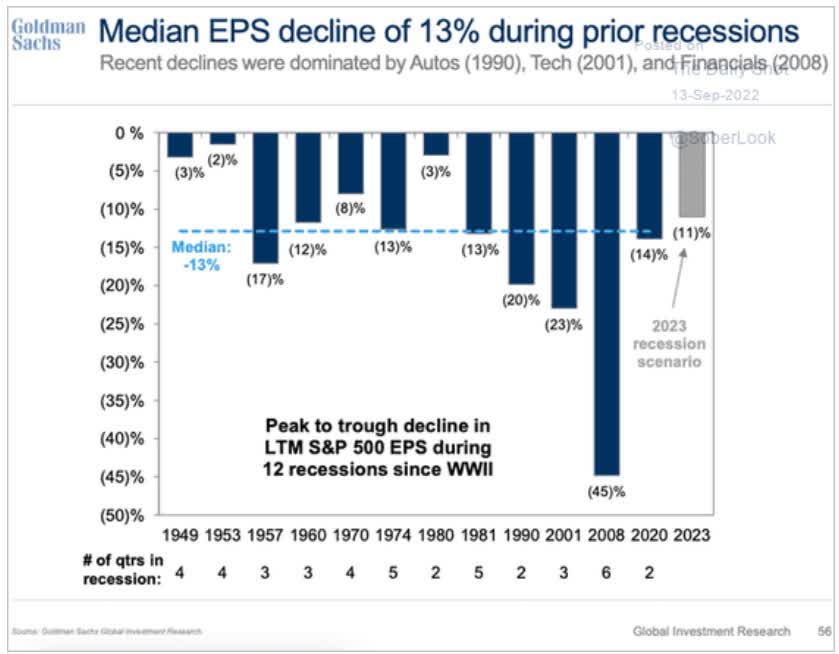
Recessions tend to result in 13% EPS declines for the S&P, and of course, the worst stock market declines.
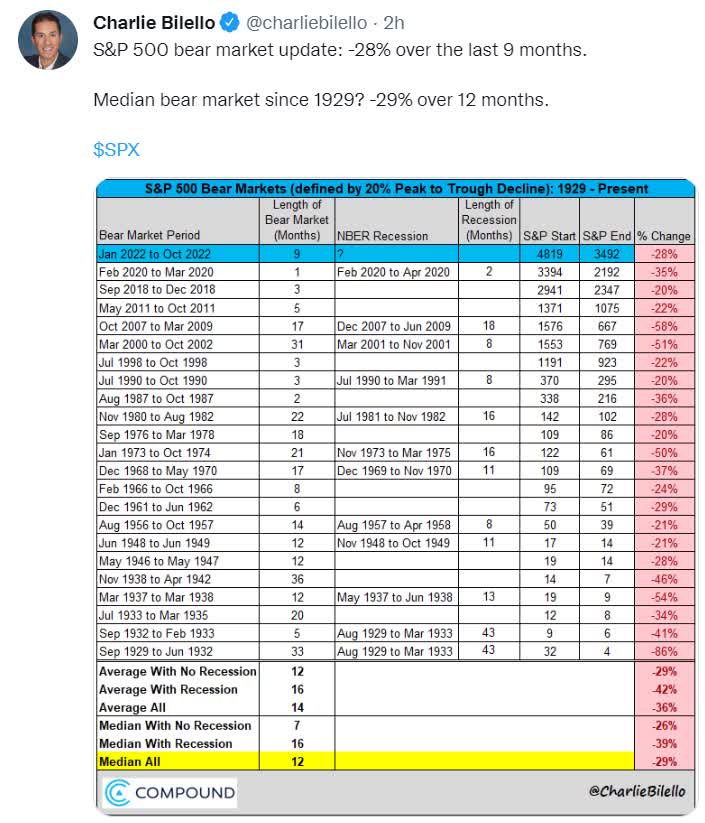
Charlie Bilello
Recessionary bear markets tend to be longer, deeper, and of course, a lot scarier, especially for anyone worried about losing their job.
According to studies from the NY, San Francisco, Cleveland, and Dallas Federal Reserves, the single most accurate recession forecasting tool is the 3m-10yr yield curve, and the New York Fed even has a model for estimating the probability of recession starting within 13 months based on this.
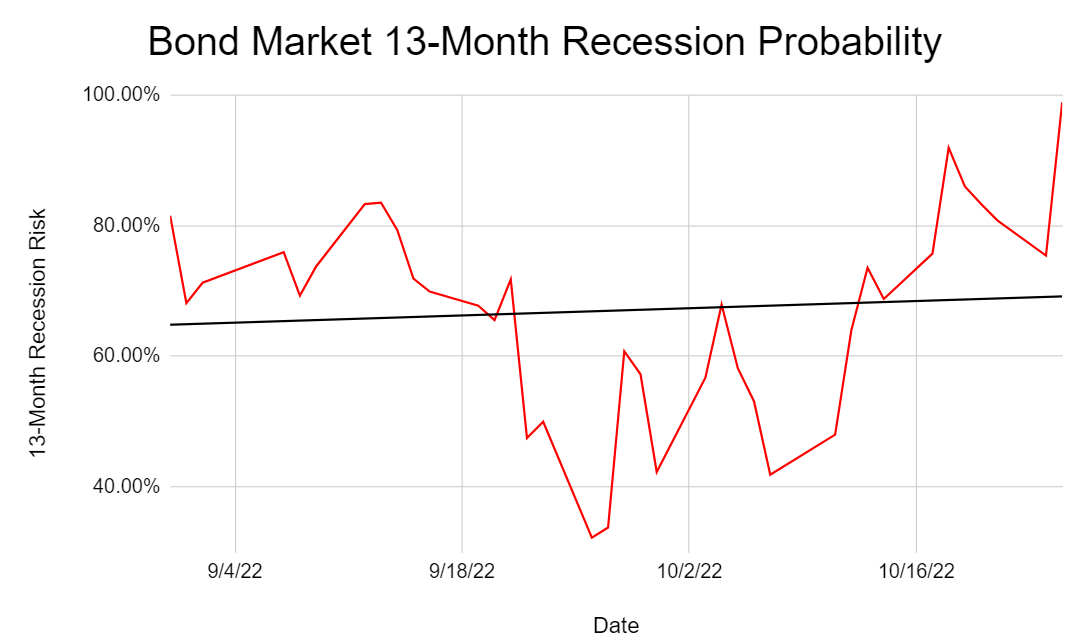
Dividend Kings S&P Valuation Tool, NY Fed, CNBC
And 13 month recession risk just hit 99% and at one point was 100% before pulling back a bit.
- Bloomberg: 100%
- Ned Davis Research: 98%
- The Conference Board: 96%
- 80% of CEOs expect a recession in 2023
The bond market broadly agrees that recession is all but certain next year.
So what’s a prudent long-term investor to do?
Time In The Market Will Make You Rich…
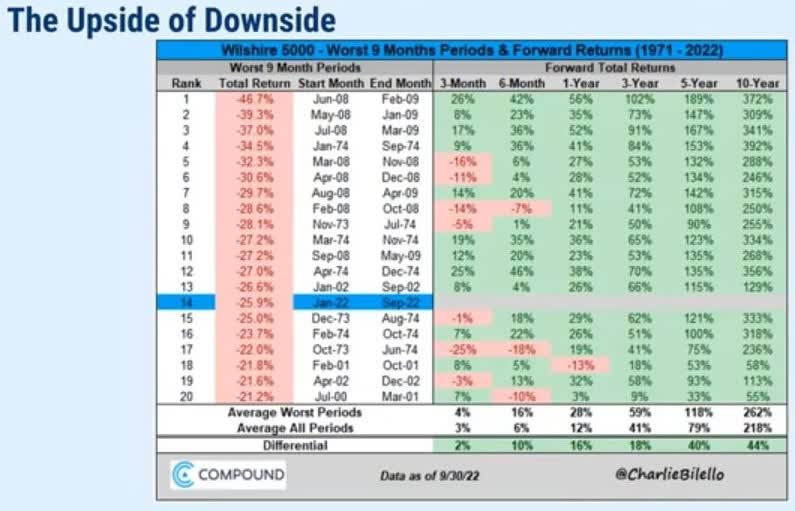
Charlie Bilello
Rejoice fellow income investor! The painful bear market we’re living through now is likely to end a lot sooner than you think. The average return from where we are now is +28% over the next year, and 10-year returns are historically 13.7% annually.
- 3.7% higher than the market’s historical returns
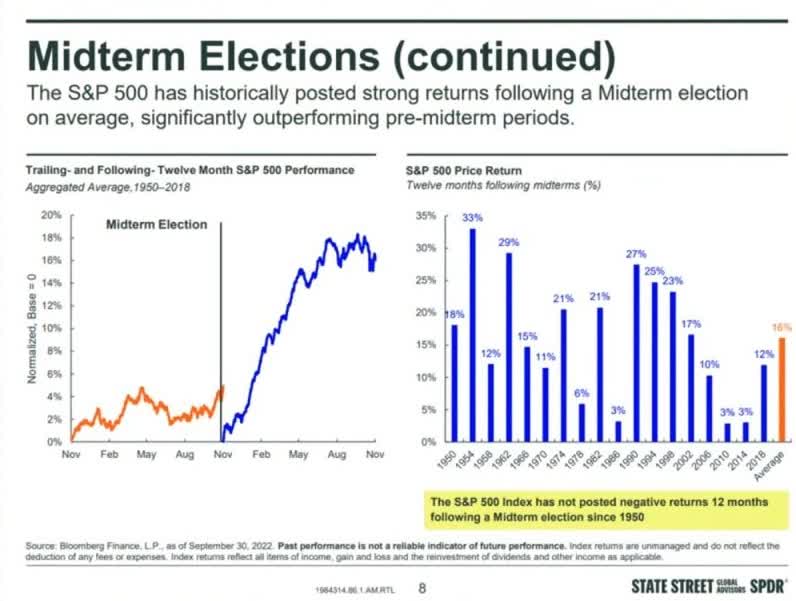
State Street
And we’re likely to enjoy a nice post-mid-term rally according to State Street and Fidelity.
Since 1950 the market has never failed to go up in the 12 months following a mid term, on average 16%.
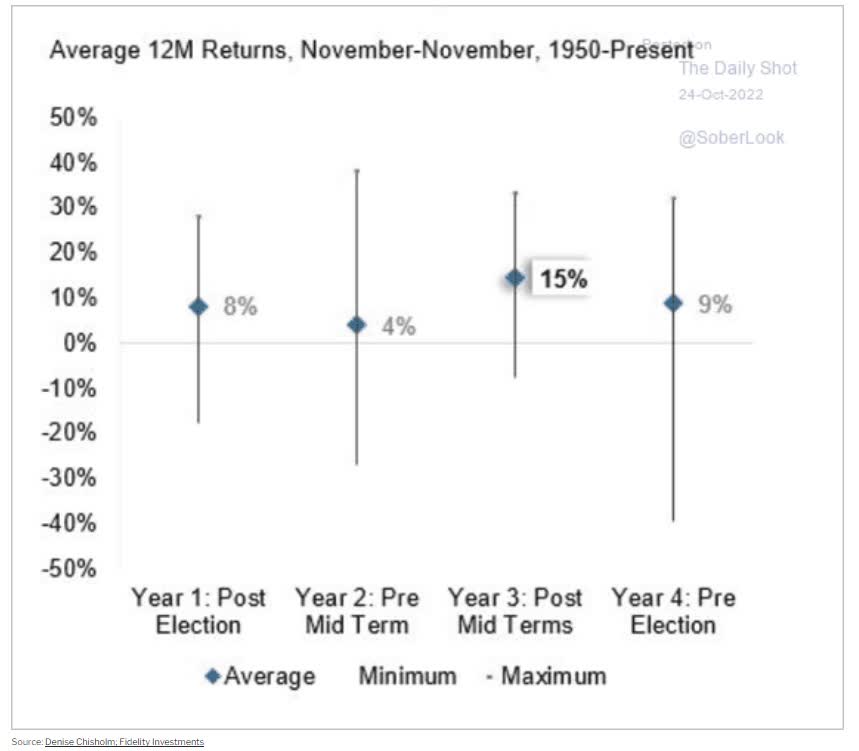
Daily Shot
Year two of the election cycle (this year) is historically the worst year for stocks, and this year has been no different.
What about the actual results of the election?
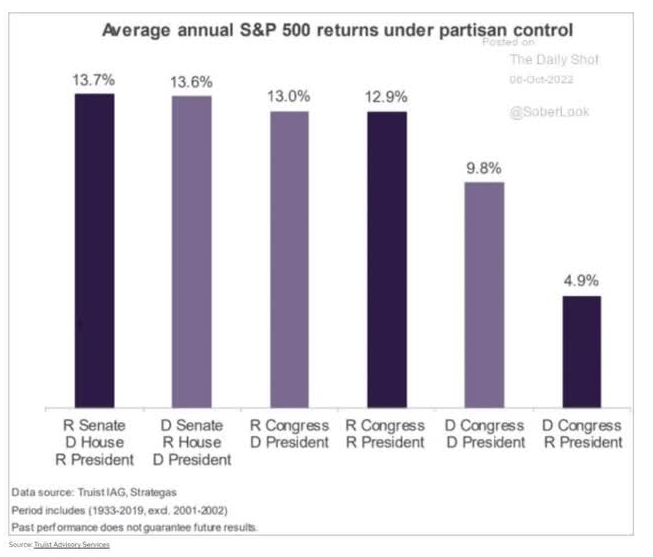
Daily Shot
It doesn’t matter. Stocks tend to do well in almost all combinations of government.
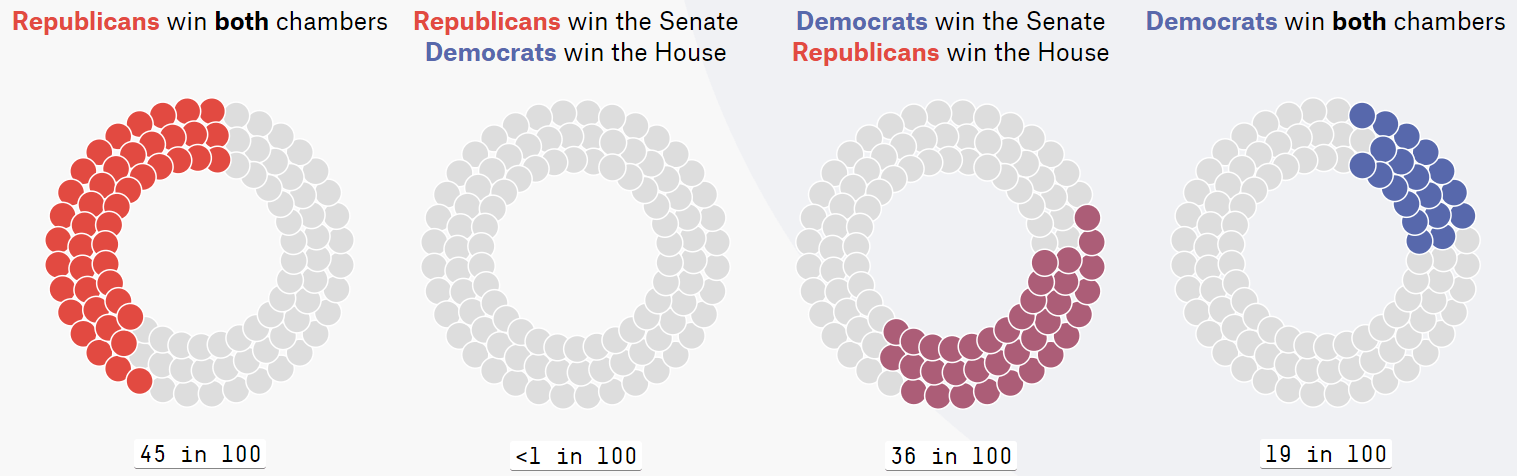
538
According to 538’s election forecasting model, there’s a greater than 99% chance that we’ll get the optimal outcome for a potential glorious rally in the coming year.
…Timing The Market Will Put Your Retirement Dreams In The Ditch
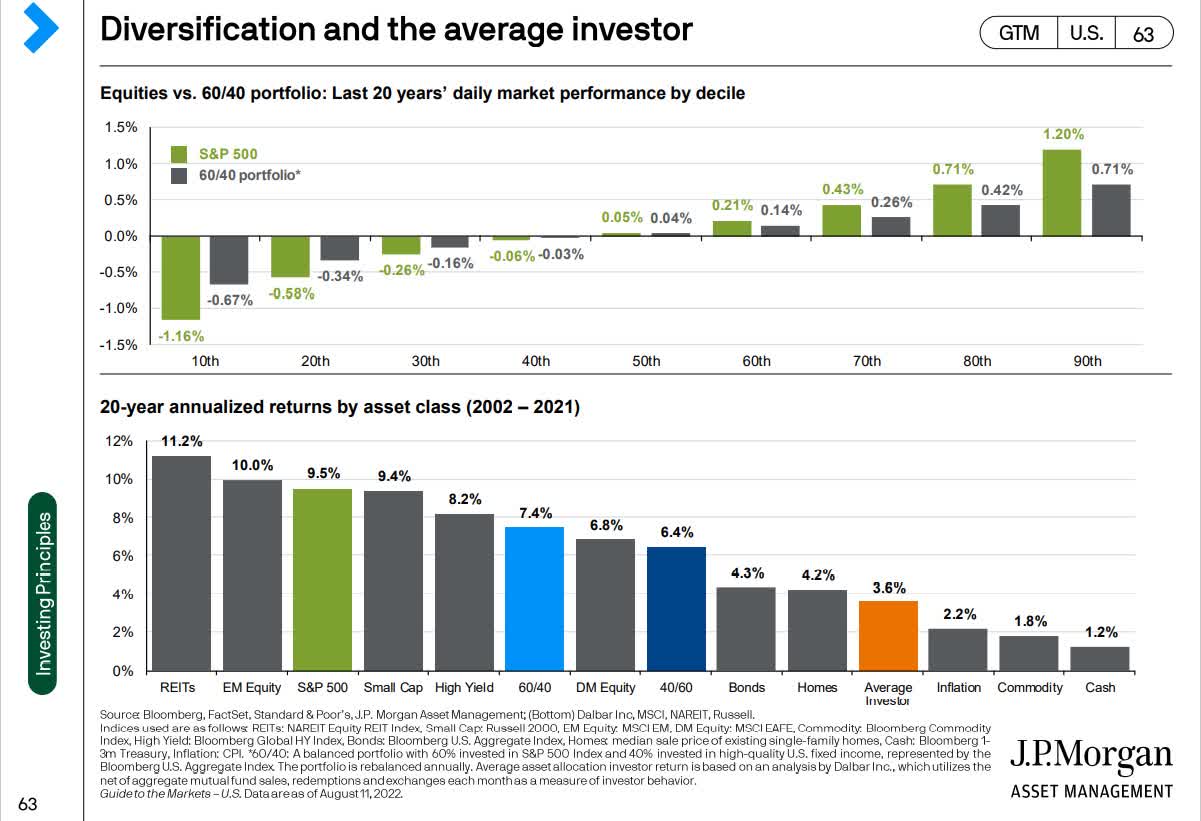
JPMorgan Asset Management
On the other hand, you could try to time the market, as most investors do.
- 98% of market timers lose money
That’s the easiest way to virtually guarantee you underperform over the long term, just as the average investor has for the last 20 years.
Why?
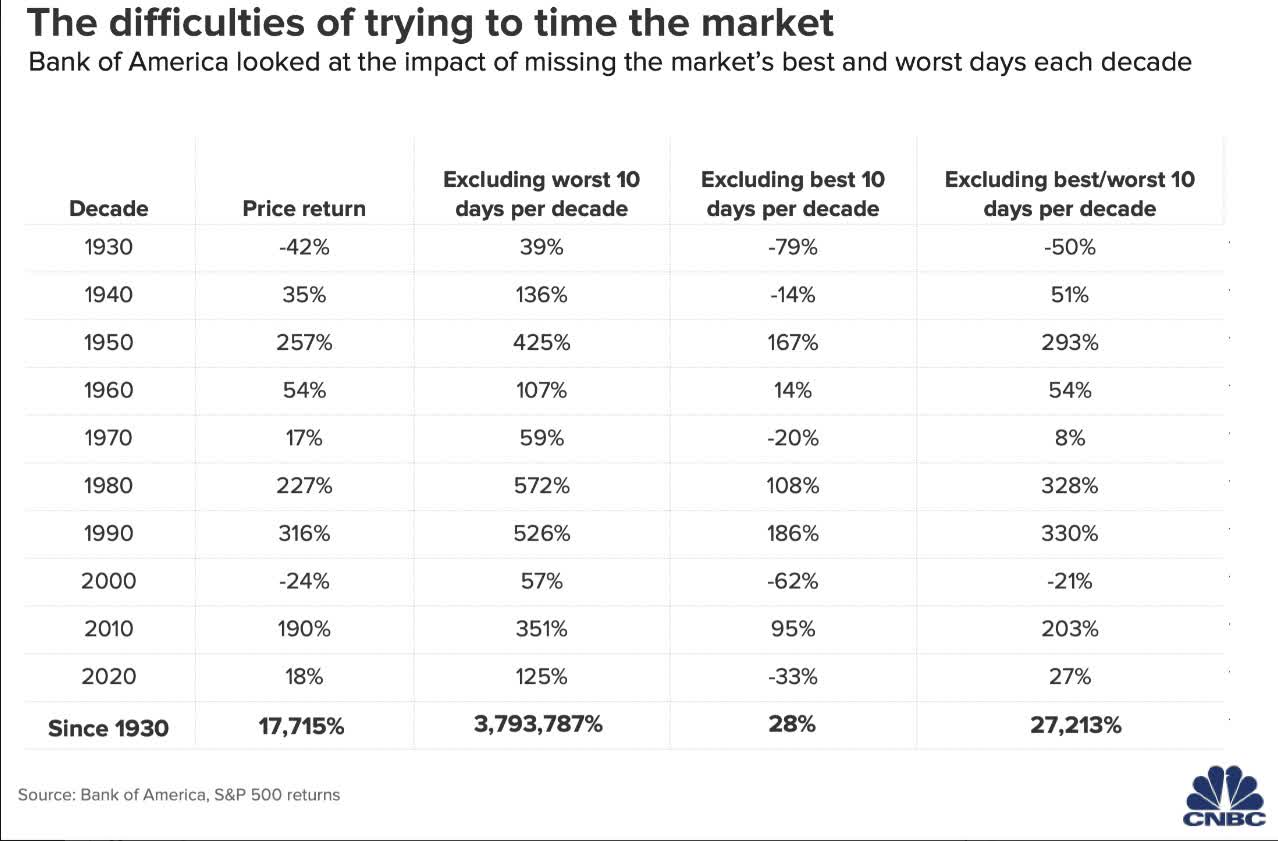
Bank of America
Because 99.84% of the market’s returns since 1930 have come from the 10 best single day gains of each decade. 80% of those come within two weeks of the single worst days.
So are we supposed to do nothing?! When we know that a recession is all but certain?
Charlie Bilello
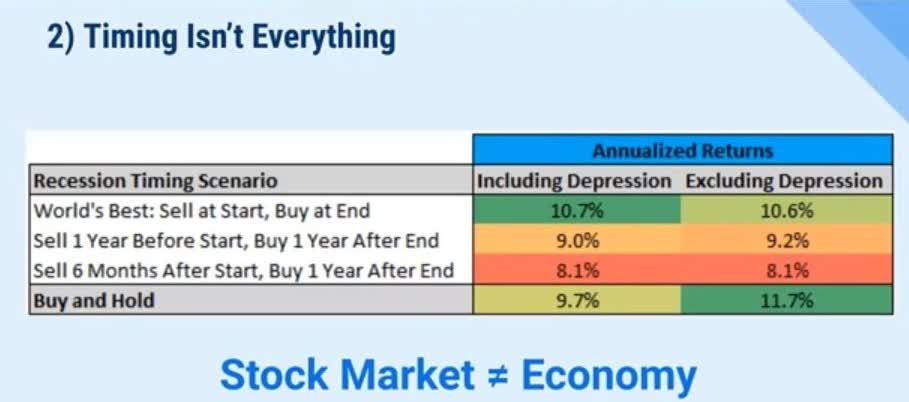
Not at all, you just have to do smart things, like not trying to time the market, which wouldn’t work even if you could predict recessions with God-like accuracy.
The Smart Way To Prepare For Recession
In 2020 and 2021 you could have made money without looking at fundamentals at all. SPACs, crypto, meme stocks, speculative growth, everything was working when the market rallied 100% in the 12 months following the Pandemic crash lows.
- the single best year for stocks in US history
Well guess what? In a recession the only things that matter are safety and quality first, and prudent valuation, and sound risk-management always.
- long-term these are also the only things that matter
Strong balance sheets, superior profitability, and well covered dividends are all important components to safe and dependable blue-chip investing in a recession.
But there’s one other aspect of recession investing that less people know about.
Long-Term Risk-Management: The Forgotten Safety Factor
Risk management is a complex thing, because the world is complex, and something is always going wrong.
Brent Beshore
There are many ways to measure, quantify, and track risk, and here’s how the Dividend Kings does it.
DK uses S&P Global’s global long-term risk-management ratings for our risk rating.
- S&P has spent over 20 years perfecting their risk model
- which is based on over 30 major risk categories, over 130 sub categories, and 1,000 individual metrics
- 50% of this model is industry specific
- this risk rating has been included in every credit rating for decades
The DK risk rating is based on the global percentile of how a company’s risk management compares to 8,000 S&P-rated companies, covering 90% of global stock market cap.
What kinds of metrics go into S&P’s risk management model?
- brand strength
- R&D efficiency
- business model stability
- business model adaptation
- supply chain management
- labor relations
- climate change mitigation
- community relations
- governance
- lawsuits
- scandals
| Classification | S&P LT Risk-Management Global Percentile |
Risk-Management Interpretation |
Risk-Management Rating |
| BTI, ILMN, SIEGY, SPGI, WM, CI, CSCO, WMB, SAP, CL | 100 | Exceptional (Top 80 companies in the world) | Very Low Risk |
| Strong ESG Stocks | 86 |
Very Good |
Very Low Risk |
| Foreign Dividend Stocks | 77 |
Good, Bordering On Very Good |
Low Risk |
| Ultra SWANs | 74 | Good | Low Risk |
| Dividend Aristocrats | 67 | Above-Average | Low Risk |
| Low Volatility Stocks | 65 | Above-Average | Low Risk |
| Master List average | 61 | Above-Average | Low Risk |
| Dividend Kings | 60 | Above-Average | Low Risk |
| Hyper-Growth stocks | 59 | Average, Bordering On Above-Average | Medium Risk |
| Dividend Champions | 55 | Average | Medium Risk |
| Monthly Dividend Stocks | 41 | Average | Medium Risk |
(Source: DK Research Terminal)
And this is how we use S&P’s data to help members decide which blue chips are best for their risk profile.
- as well as adjust margins of safety requirements and risk cap recommendations
In other words,
- while credit ratings tell you the probability of a company going bankrupt
- risk management ratings tell you the probability of the company thriving in the future.
How To Find The Best Risk Management Blue-Chips For This Recession… In 2 Minutes
If we’re riding into recession, then wouldn’t it be great if you could:
- enjoy safe, generous, and growing dividends to tide you over until it’s over?
- be confident that your money is safely being run by the world’s best risk-managers?
That sounds wonderful doesn’t? And here’s how you can go about doing it.
Let me show you how to screen the Dividend Kings Zen Research Terminal, which runs of the DK 500 Master List, to easily find the best high-yield Ultra SWANs (sleep well at night) blue-chips for retirees.
The Dividend Kings 500 Master List includes some of the world’s best companies, including:
- every dividend champion (25+ year dividend growth streaks, including foreign aristocrats)
- every dividend aristocrat
- every dividend king (50+ year dividend growth streaks)
- every Ultra SWAN (as close to perfect quality companies as exist)
- the 20% highest quality REITs according to iREIT
- 40 of the world’s best growth blue-chips
Finding The Lowest Risk Blue-Chips
| Step | Screening Criteria | Companies Remaining | % Of Master List |
| 1 | Reasonable Buy, Good Buy, Strong Buy, Very Strong Buy, Ultra Value Buy (Never Overpay For Stocks) | 380 | 75.40% |
| 2 | 10+% long-term return potential (S&P historical return) | 282 | 55.95% |
| 3 |
Add S&P Risk-Management Percentile |
0.00% | |
| 4 |
Sort by Risk Management |
0.00% | |
| 5 |
Using The Watchlist Builder To Select The Top 10 Lowest Risk Blue-Chips |
0.00% | |
| 6 | Select The Highest Yielding Stock In Each Sector | 10 | 1.98% |
| Total Time | 2 minutes |
What are the 10 lowest risk blue-chips according to S&P?
The 10 Lowest Risk High-Yield Blue-Chips For This Recession
I’ve linked to articles about each very low-risk blue-chips covering its investment thesis, growth outlook, and risk profile.
(Source: Dividend Kings Zen Research Terminal)
Here are the lowest risk high-yield blue-chips, according to S&P, in order of global risk-management percentile.
Tax Implications
- ALIZY is a German company
- 23.375% dividend tax withholding
- own in taxable account to qualify for the tax credit to recoup the withholding
- TSM is a Taiwanese company
- 20% withholding
- own in taxable accounts to qualify for the tax credit and recoup the withholding
FAST Graphs Up Front
British American Tobacco 2024 Consensus Total Return Potential
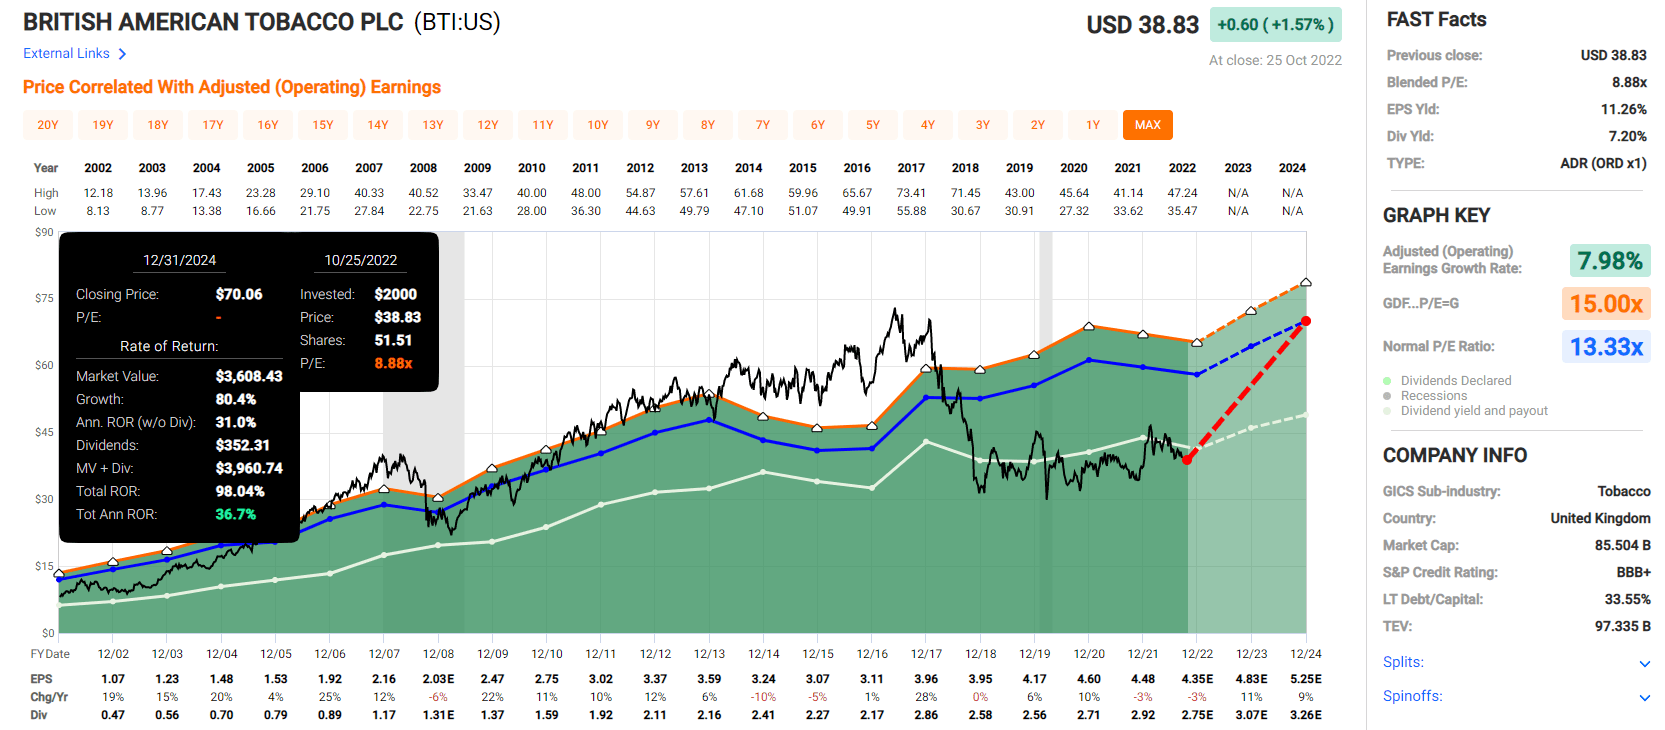
(Source: FAST Graphs, FactSet)
Siemens 2024 Consensus Total Return Potential
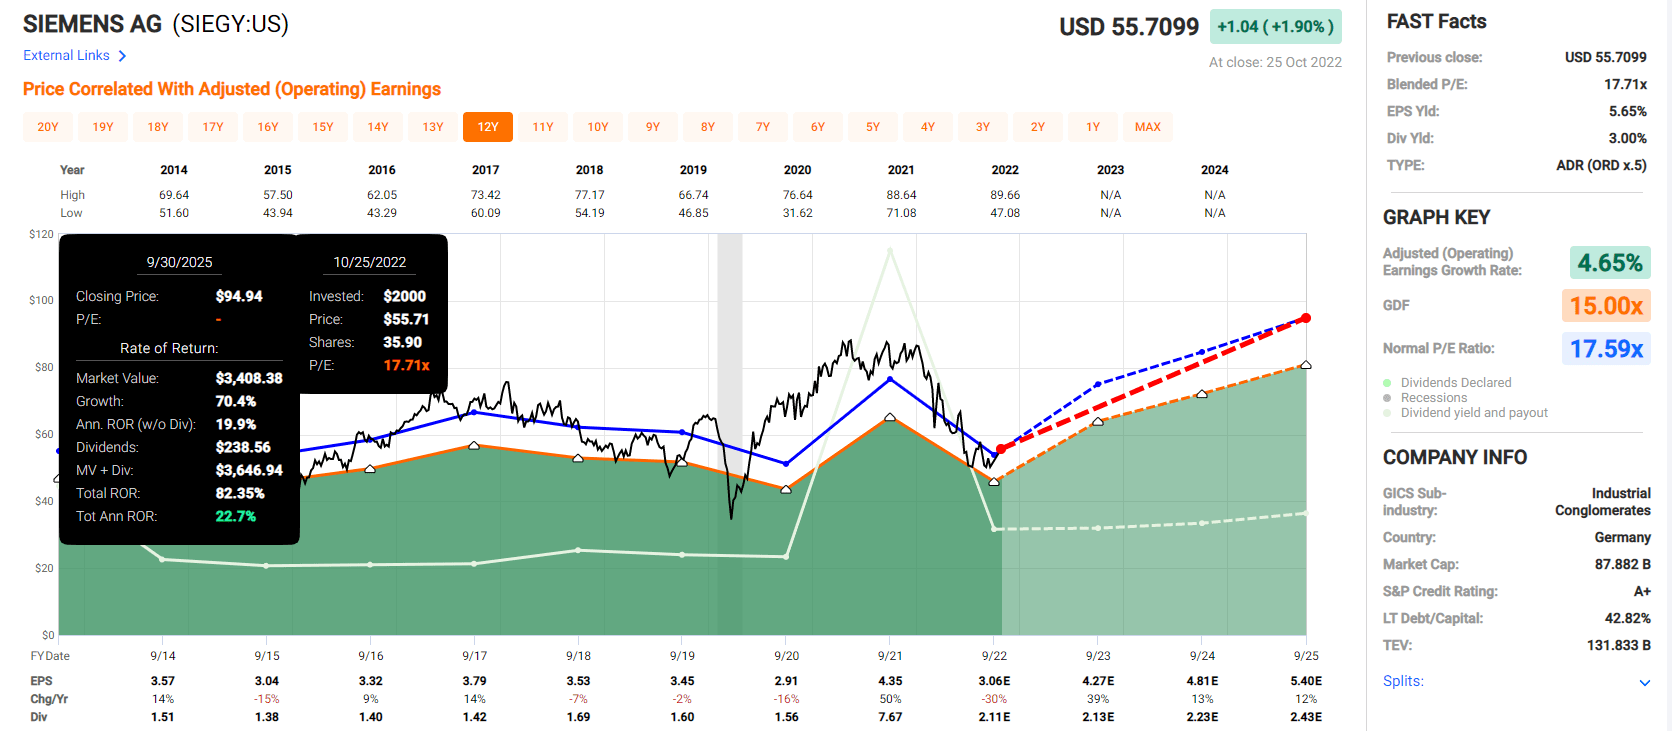
(Source: FAST Graphs, FactSet)
Cisco 2024 Consensus Total Return Potential
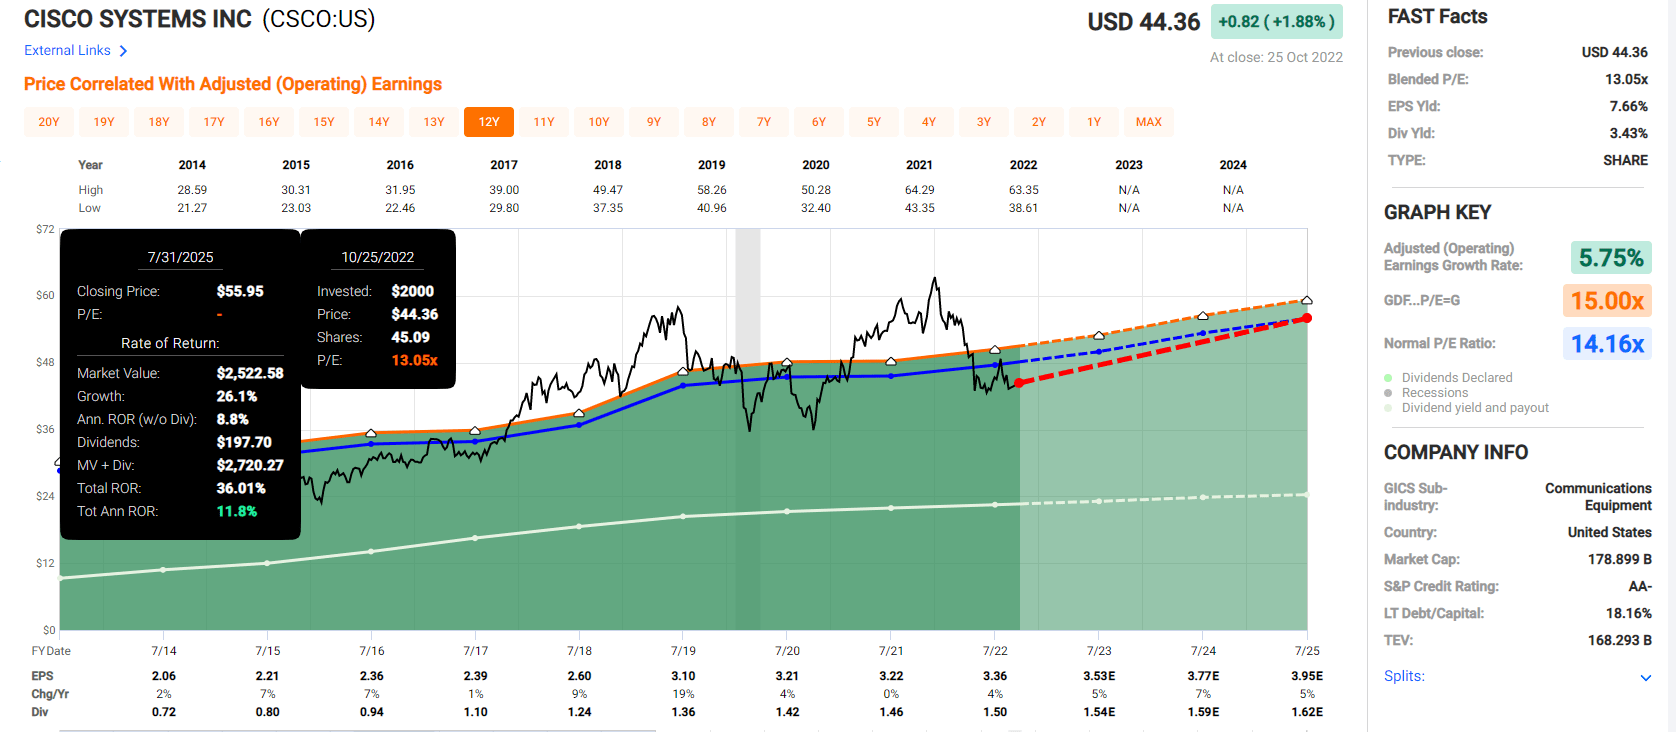
(Source: FAST Graphs, FactSet)
Adobe 2024 Consensus Total Return Potential
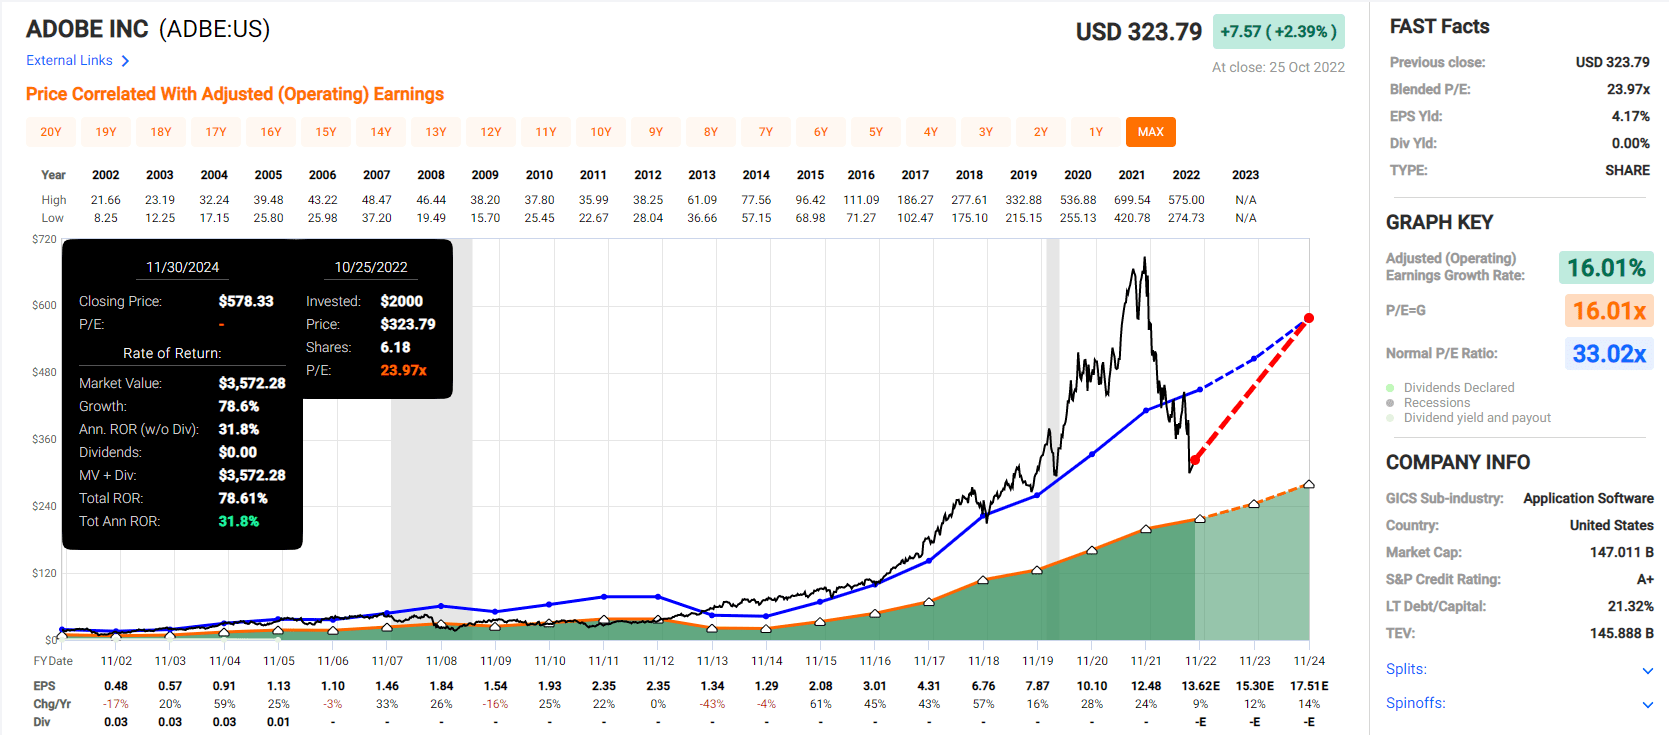
(Source: FAST Graphs, FactSet)
Linde 2024 Consensus Total Return Potential
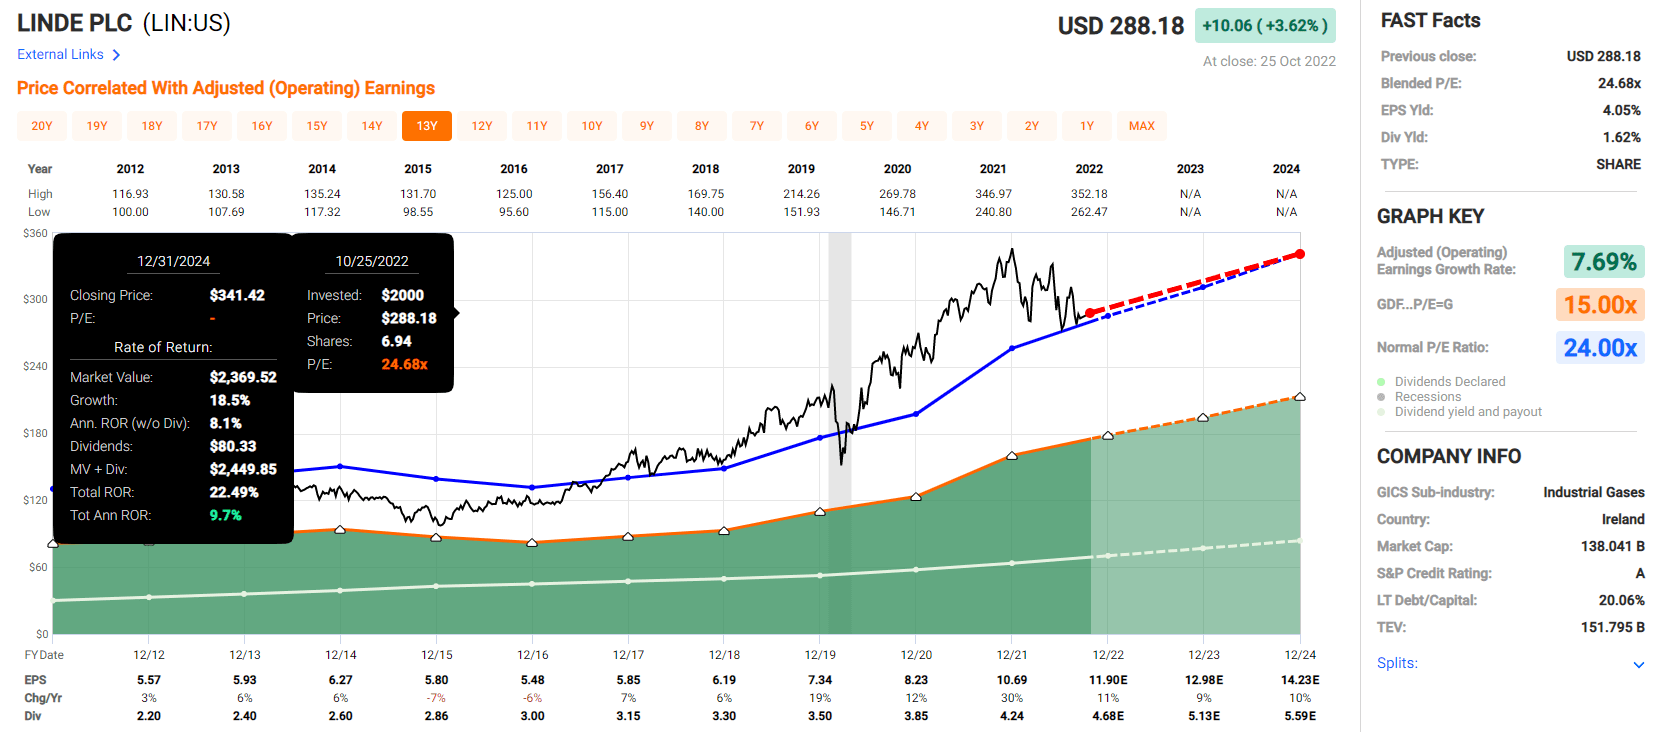
(Source: FAST Graphs, FactSet)
Allianz 2024 Consensus Total Return Potential
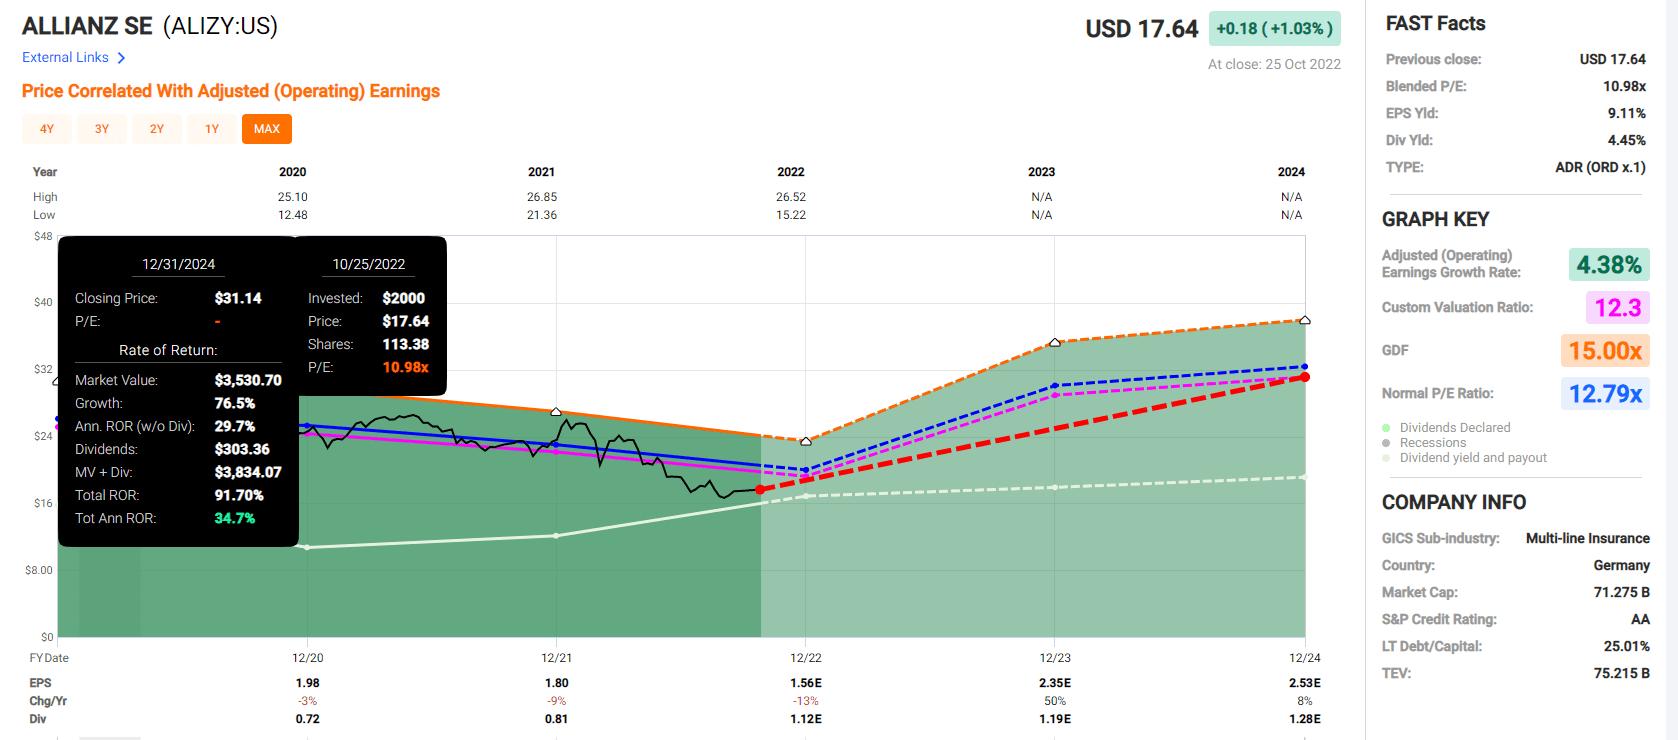
(Source: FAST Graphs, FactSet)
Taiwan Semiconductor 2024 Consensus Total Return Potential
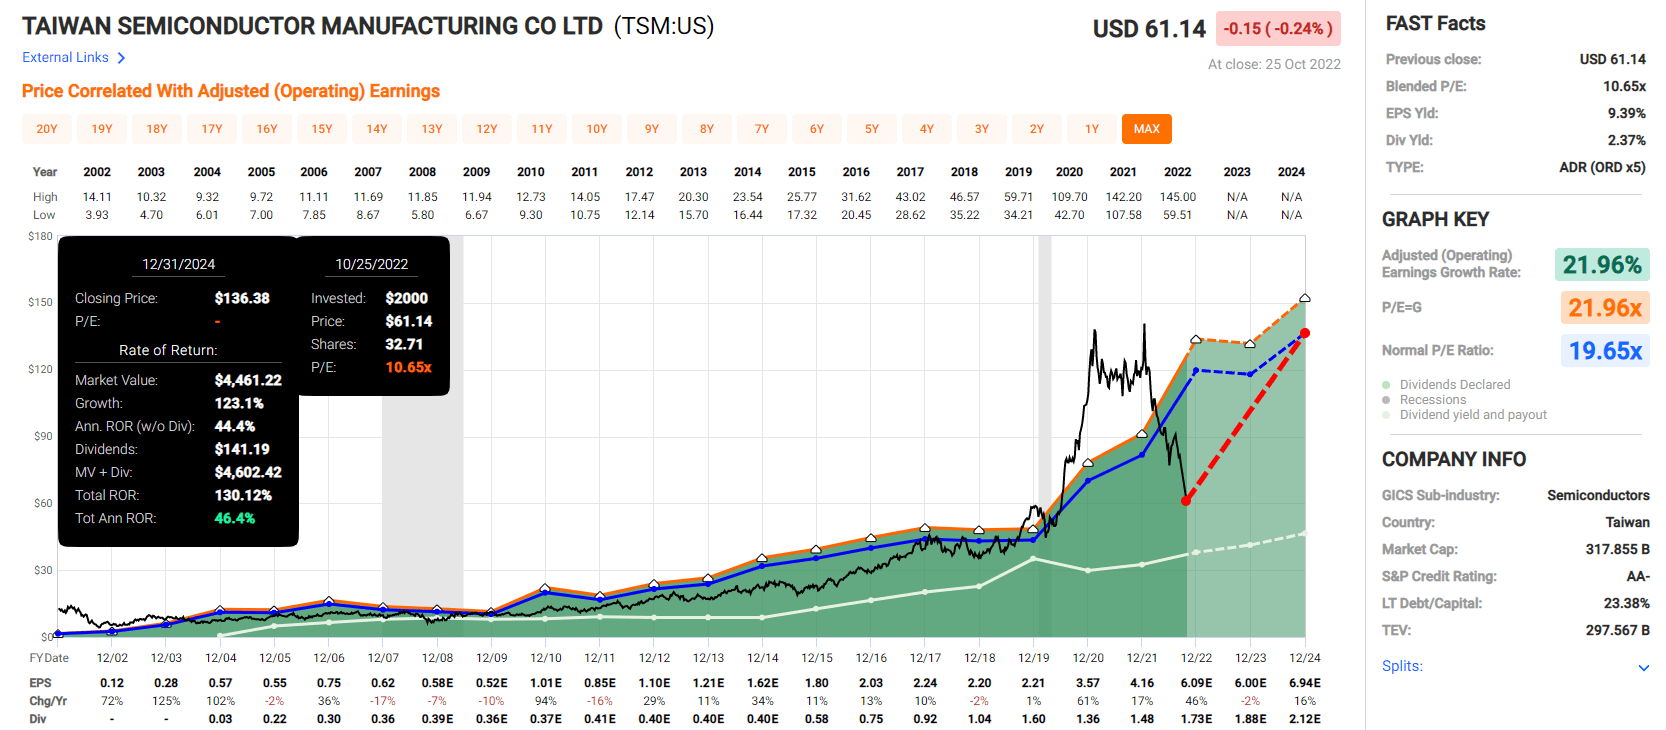
(Source: FAST Graphs, FactSet)
Stanley Black & Decker 2024 Consensus Total Return Potential
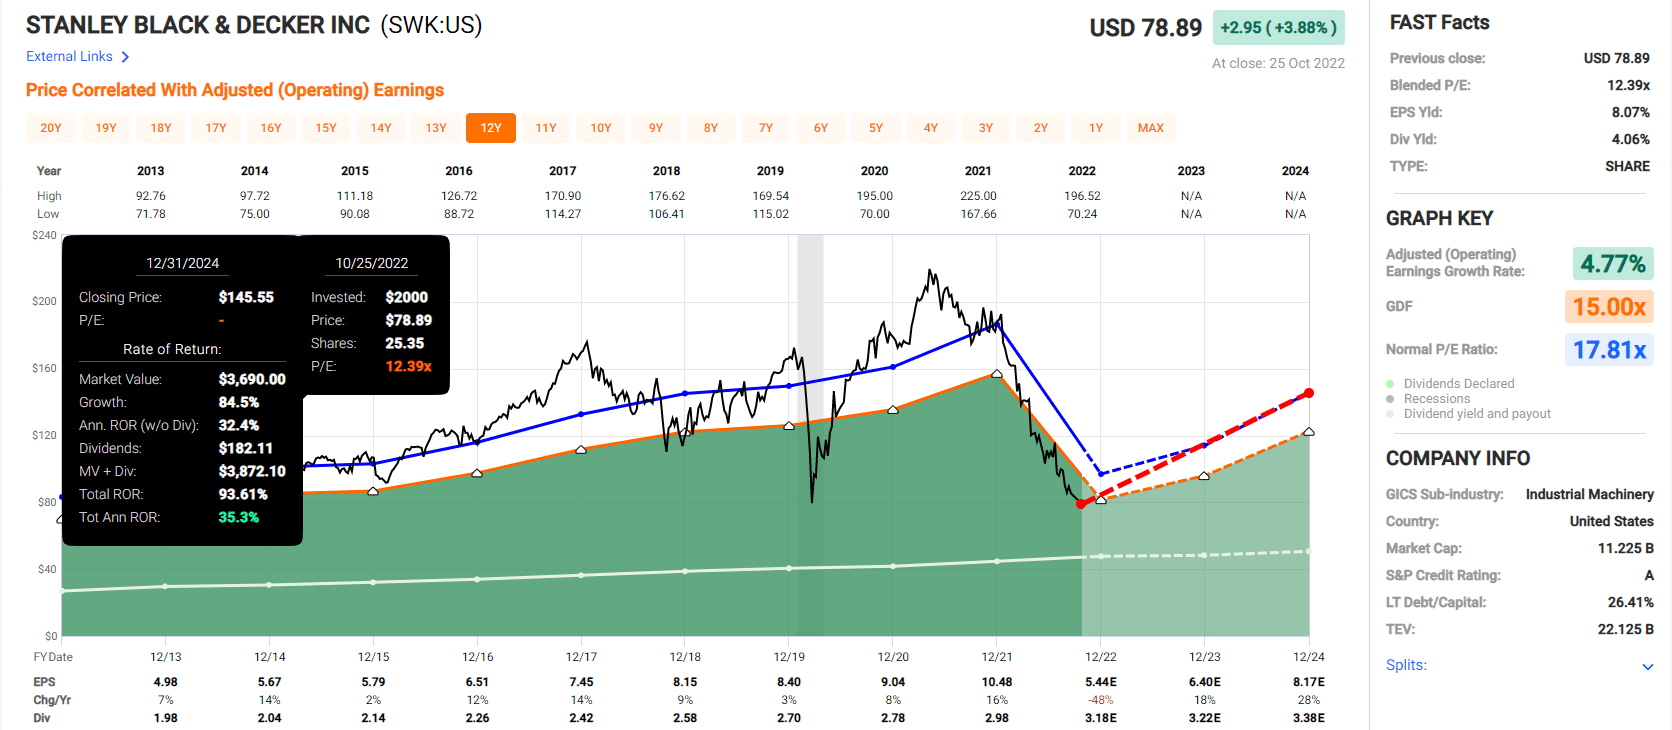
(Source: FAST Graphs, FactSet)
Kilroy Realty 2024 Consensus Total Return Potential
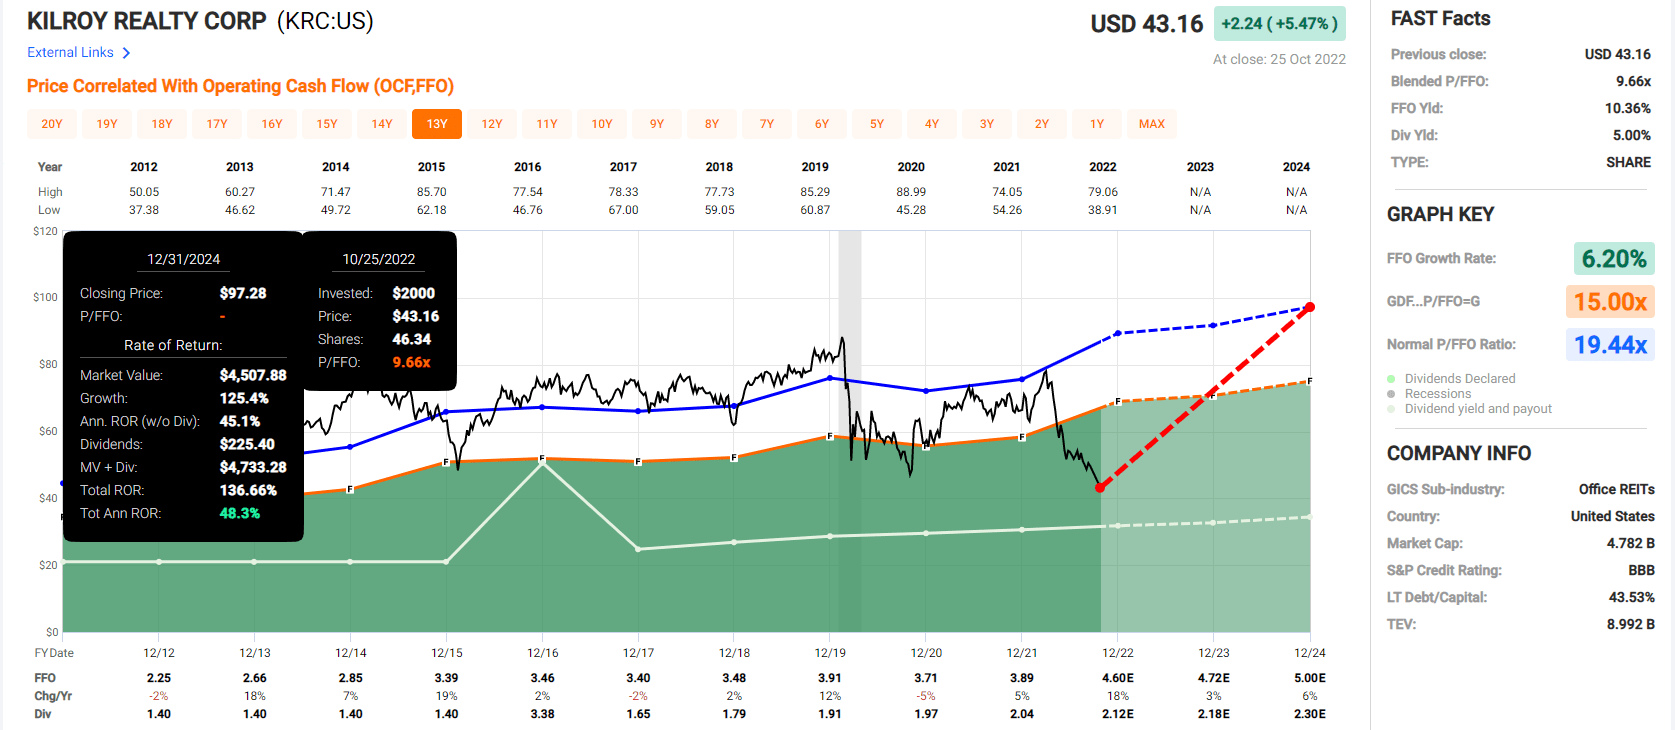
(Source: FAST Graphs, FactSet)
Microsoft 2024 Consensus Total Return Potential
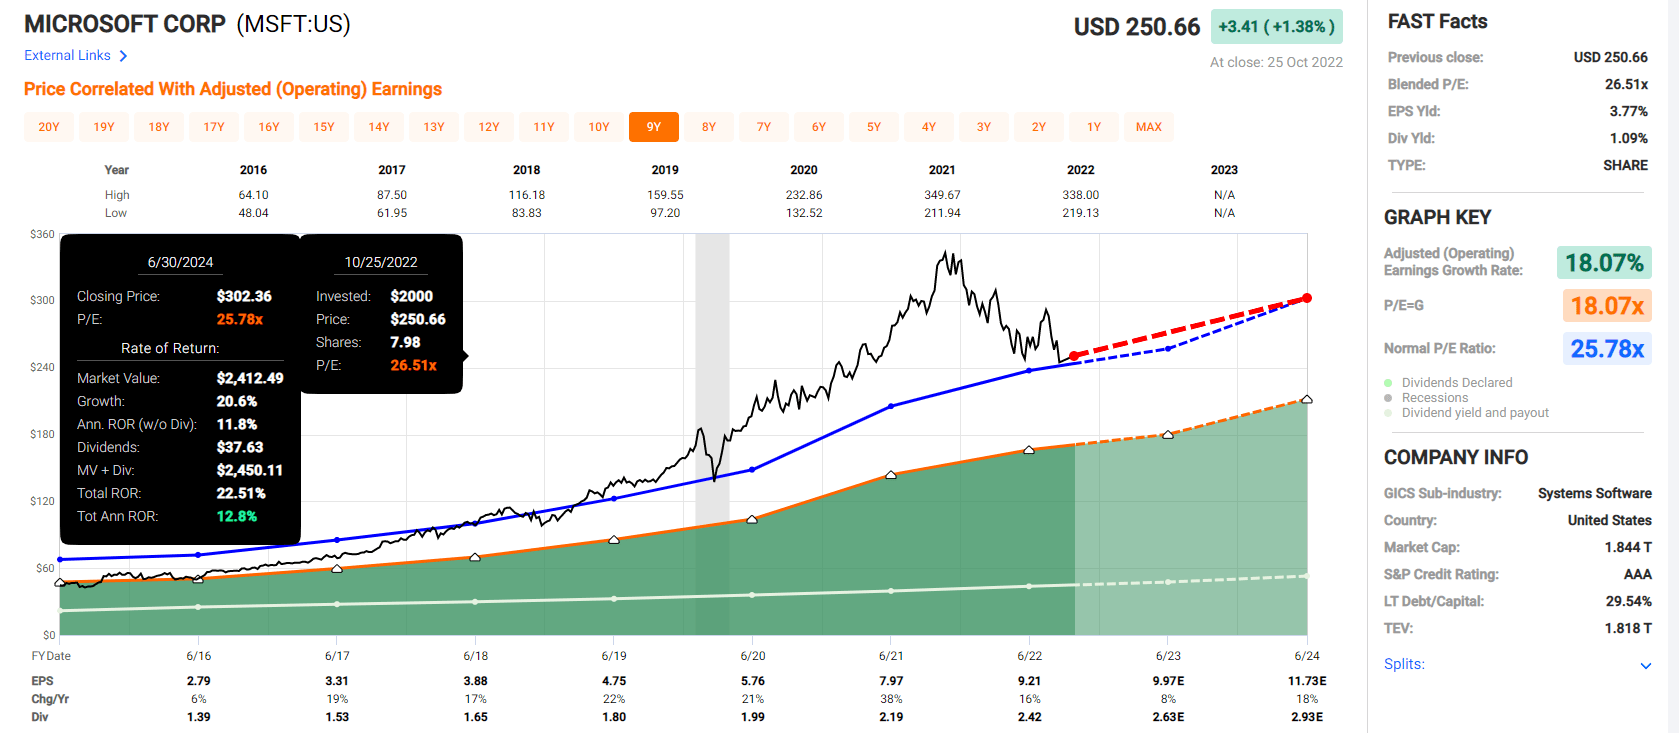
(Source: FAST Graphs, FactSet)
- average total return potential through 2024: 67%
- average annual return potential through 2024: 29.1% CAGR
- Buffett-like return potential from undervalued low risk blue-chip bargains hiding in plain sight
Now compare that to the S&P 500.
S&P 500 2024 Consensus Total Return Potential
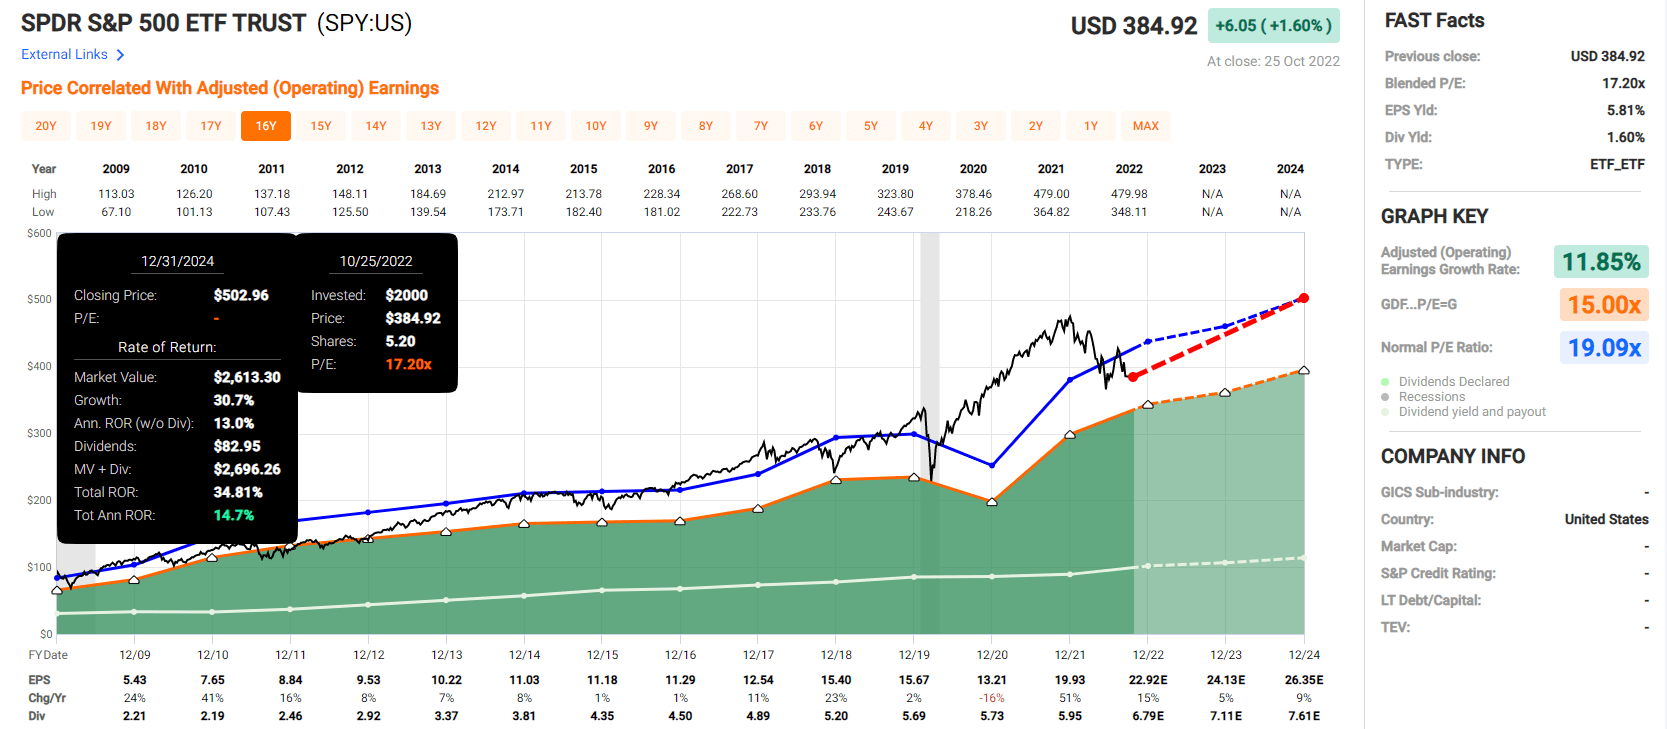
(Source: FAST Graphs, FactSet)
Analysts think these low risk blue-chips could deliver about 2X higher total returns over the next two year than the S&P 500.
But my goal isn’t to help you make 70% in two years, but earn life-changing income and wealth with the lowest long-term risk.
10 Of The Lowest Risk Blue-Chips On Earth
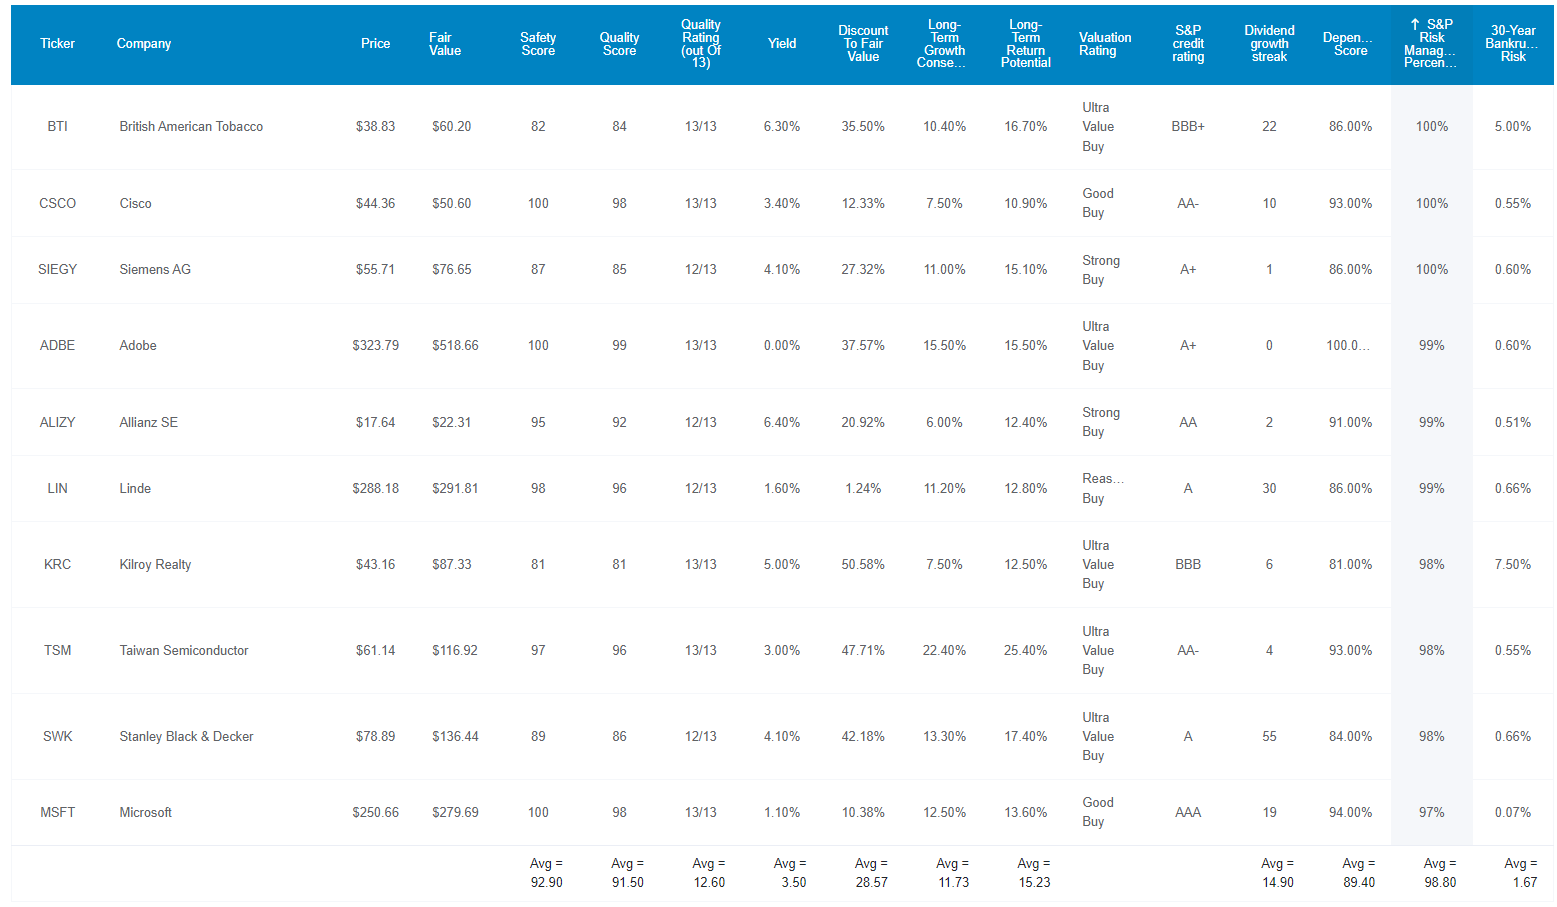
(Source: Dividend Kings Zen Research Terminal)
These aren’t just 10 low risk blue chips, they are 12.6/13 Ultra SWAN quality blue-chips, as close to perfect quality companies as exist on Wall Street.
How can we tell? By comparing their fundamentals to the dividend aristocrats, the bluest of blue chips.
Fundamentals Compared To The Dividend Aristocrats
| Metric | Dividend Aristocrats | 10 Lowest Risk Blue-Chips |
Compared To Aristocrats |
| Quality | 87% | 92% | 106% |
| Safety | 90% | 93% | 103% |
| Average Recession Dividend Cut Risk | 0.5% | 0.5% | 100% |
| Severe Recession Dividend Cut Risk | 1.50% | 1.35% | 90% |
| Dependability | 84% | 90% | 107% |
| Dividend Growth Streak (Years) | 44.8 | 14.9 | 33% |
| Long-Term Risk Management Industry Percentile | 67% Low Risk, Above-Average | 99%, Very Low Risk, Exceptional | 148% |
| Average Credit Rating | A- Stable | A- Stable | NA |
| Average Bankruptcy Risk | 3.04% | 1.67% | 55% |
| Average Return On Capital | 105% | 185% | 176% |
| Average ROC Industry Percentile | 83% | 82% | 99% |
| 13-Year Median ROC | 89% | 138% | 155% |
| Forward PE | 19.1 | 14.7 | 77% |
| Discount To Fair Value | 6% | 29% | 483% |
| DK Rating | Reasonable Buy | Very Strong Buy | NA |
| Yield | 2.7% | 3.5% | 132% |
| LT Growth Consensus | 8.6% | 11.7% | 136% |
| Total Return Potential | 11.3% | 15.2% | 135% |
| Risk-Adjusted Expected Return | 7.6% | 10.2% | 133% |
| Inflation & Risk-Adjusted Expected Return | 5.4% | 7.9% | 147% |
| Conservative Years To Double | 13.3 | 9.1 | 68% |
| Average | 131% |
(Source: Dividend Kings Zen Research Terminal)
On average these very low risk blue chips are 31% better than the dividend aristocrats.
- average dividend cut risk in a historically average recession since WWII 0.5%
- average severe recession (Pandemic, Financial Crisis level) recession is approximately 1.35%
Joel Greenblatt considers return on capital or ROC the gold standard of quality and moatiness.
- using cash-adjusted PEs and ROC he achieved 40% annual returns for 21 years
- one of the greatest investors in history
The S&P 500’s ROC in 2021 was 14.6%.
The dividend aristocrats over the last year is 105%.
These very low risk blue chips have 185% ROC.
- 13X more than the S&P 500
- 76% better than the dividend aristocrats
Their ROC percentile is in the top 18% of their respective industries, a wide moat.
Their 13-year median ROC is 138%, indicating a wide and stable or even improving moat.
S&P estimates the average 30-year bankruptcy risk at 1.67%, an A- stable credit rating.
And S&P’s long-term risk management model says these 10 very low risk blue chips are in the top 1% of global companies for total risk management.
| Classification | S&P LT Risk-Management Global Percentile |
Risk-Management Interpretation |
Risk-Management Rating |
| BTI, ILMN, SIEGY, SPGI, WM, CI, CSCO, WMB, SAP, CL | 100 | Exceptional (Top 80 companies in the world) | Very Low Risk |
| 10 Very Low Risk Blue-Chips | 99 |
Exceptional |
Very Low Risk |
| Strong ESG Stocks | 86 |
Very Good |
Very Low Risk |
| Foreign Dividend Stocks | 77 |
Good, Bordering On Very Good |
Low Risk |
| Ultra SWANs | 74 | Good | Low Risk |
| Dividend Aristocrats | 67 | Above-Average | Low Risk |
| Low Volatility Stocks | 65 | Above-Average | Low Risk |
| Master List average | 61 | Above-Average | Low Risk |
| Dividend Kings | 60 | Above-Average | Low Risk |
| Hyper-Growth stocks | 59 | Average, Bordering On Above-Average | Medium Risk |
| Dividend Champions | 55 | Average | Medium Risk |
| Monthly Dividend Stocks | 41 | Average | Medium Risk |
(Source: DK Research Terminal)
OK, so now that you know why these are 10 of the lowest risk blue chips on earth, let’s see why you might want to buy some of them today.
Wonderful Very Low Risk Companies At Wonderful Prices
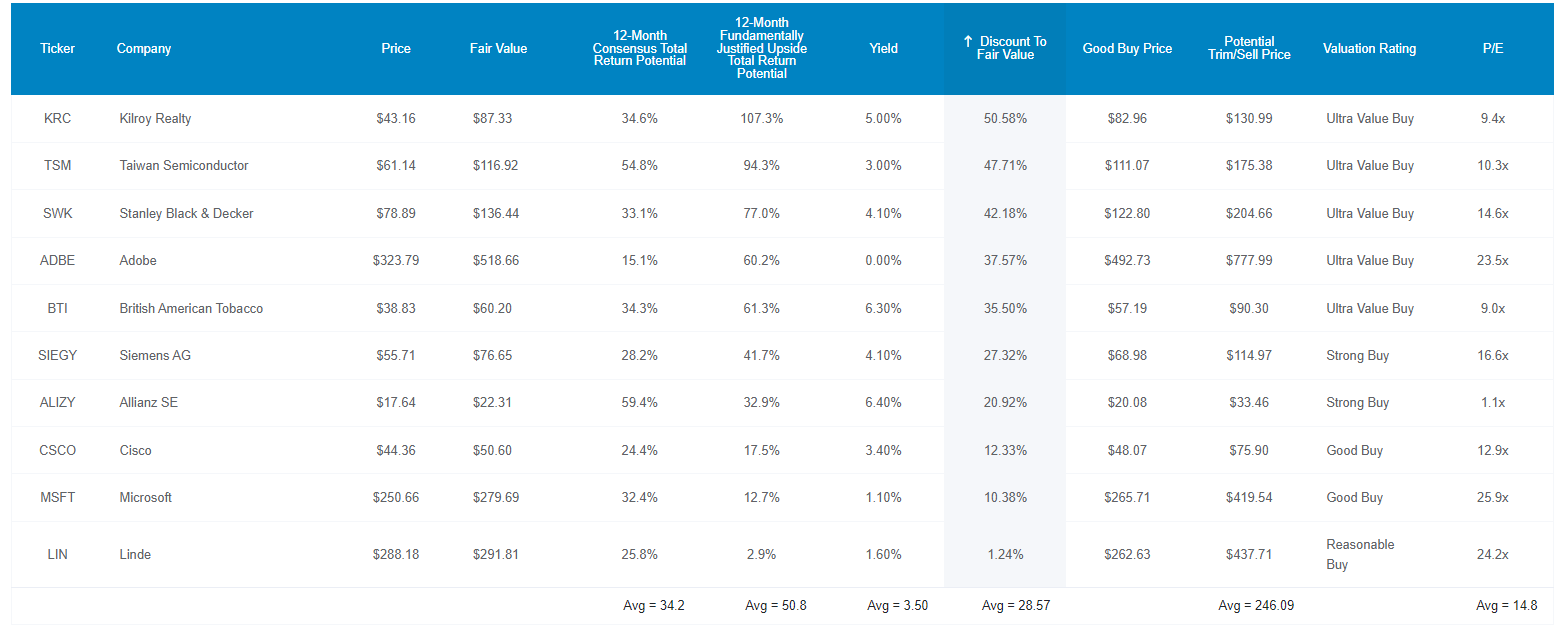
(Source: Dividend Kings Zen Research Terminal)
For context the S&P 500 trades at 16.6X forward earnings, a 2% historical discount.
The dividend aristocrats trade at 19.1X forward earnings, a 6% historical discount.
These very low risk blue chips, which Joel Greenblatt considers 13X higher quality than the average S&P company and 76% higher quality than the average aristocrat, are trading at 14.8X forward earnings, a 29% historical discount.
That’s why analysts expect a 34% total return within a year.
Their 12-month fundamentally justified total return potential is 51%.
- if all of them grow as expected over the next year and return to mid-range market-determined historical fair value you will earn 51% in the next year
But my goal isn’t to help you earn 34% in a year, 67% in two years, or even 51% in the next 12 months.
- these very low risk blue-chips have the potential to 70X over the next 30 years
How These Very Low Risk Blue-Chips Can Help You Potentially Retire In Safety And Splendor
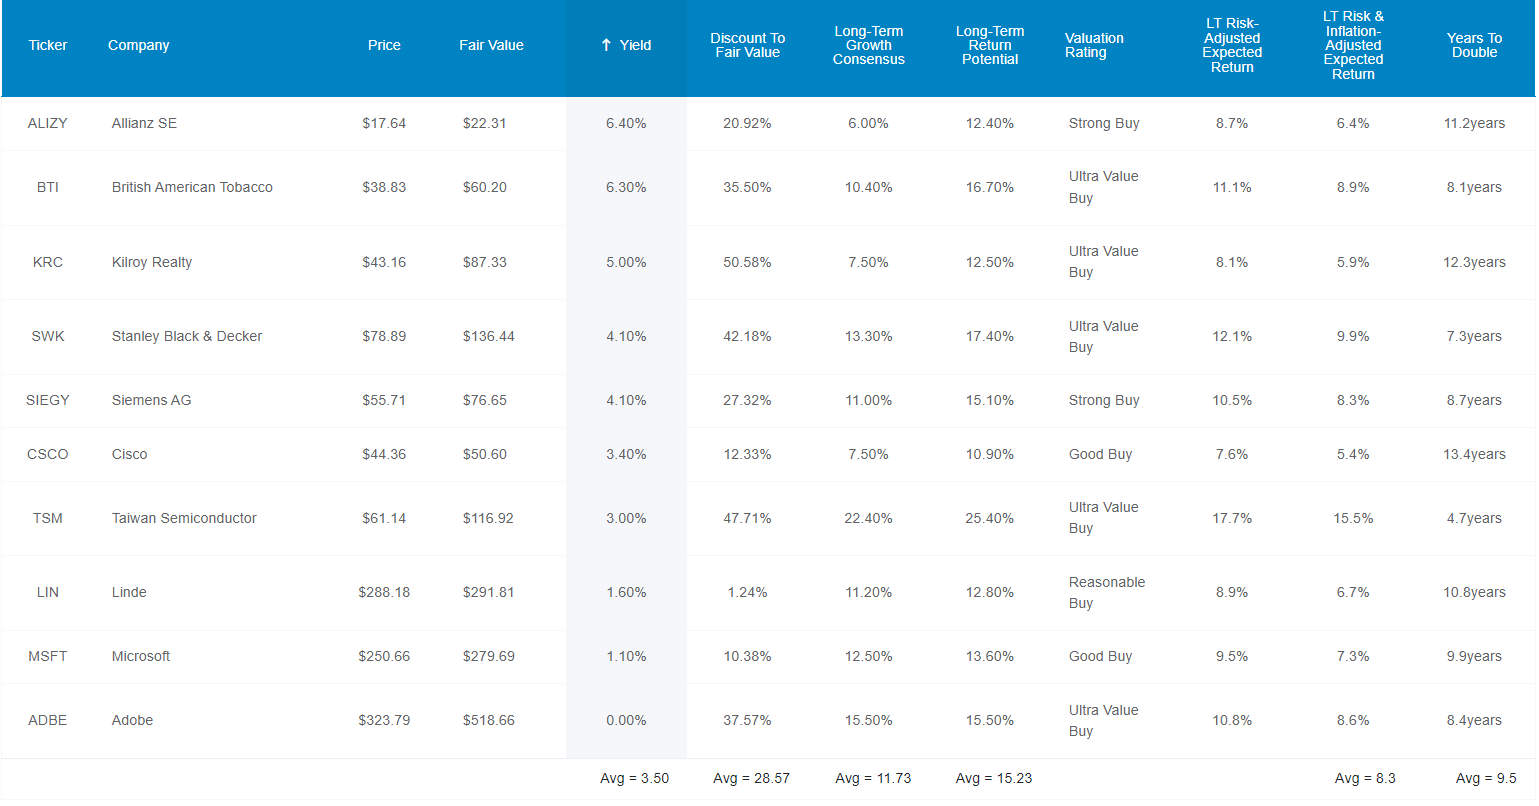
(Source: Dividend Kings Zen Research Terminal)
These 10 very low risk blue chips offer one of the safest 3.5% yields on earth and are growing at almost 12%.
- S&P is growing at 8.5% CAGR
- dividend aristocrats 8.6%
- Nasdaq 11.5% CAGR
More than 2X the yield of the S&P and faster growth than the Nasdaq? Do you know what that potentially means?
| Investment Strategy | Yield | LT Consensus Growth | LT Consensus Total Return Potential | Long-Term Risk-Adjusted Expected Return | Long-Term Inflation And Risk-Adjusted Expected Returns | Years To Double Your Inflation & Risk-Adjusted Wealth |
10-Year Inflation And Risk-Adjusted Expected Return |
| 10 Lowest Risk High-Yield Blue-Chips | 3.5% | 11.7% | 15.2% | 10.7% | 8.4% | 8.6 | 2.24 |
| Safe Midstream | 6.1% | 6.4% | 12.5% | 8.8% | 6.5% | 11.1 | 1.87 |
| Nasdaq | 0.8% | 11.5% | 12.3% | 8.6% | 6.3% | 11.4 | 1.85 |
| Schwab US Dividend Equity ETF | 3.8% | 8.5% | 12.3% | 8.6% | 6.3% | 11.4 | 1.84 |
| Dividend Aristocrats | 2.8% | 8.7% | 11.5% | 8.1% | 5.8% | 12.5 | 1.75 |
| S&P 500 | 1.8% | 8.5% | 10.3% | 7.2% | 4.9% | 14.6 | 1.62 |
(Sources: DK Research Terminal, FactSet, Morningstar, Ycharts)
It means the potential for generous, very safe yield today, and better total returns than almost any popular investing strategy over the long term.
More than the S&P, aristocrats, SCHD, and even the Nasdaq.
Inflation-Adjusted Consensus Total Return Potential: $1,000 Initial Investment
| Time Frame (Years) | 8.0% CAGR Inflation-Adjusted S&P 500 Consensus | 9.2% Inflation-Adjusted Aristocrat Consensus | 12.9% CAGR Inflation-Adjusted 10 Lowest Risk High-Yield Blue-Chips Consensus | Difference Between Inflation-Adjusted 10 Lowest Risk High-Yield Blue-Chips Consensus And S&P Consensus |
| 5 | $1,468.65 | $1,553.50 | $1,836.74 | $368.09 |
| 10 | $2,156.93 | $2,413.37 | $3,373.60 | $1,216.67 |
| 15 | $3,167.77 | $3,749.18 | $6,196.41 | $3,028.64 |
| 20 | $4,652.33 | $5,824.36 | $11,381.16 | $6,728.83 |
| 25 | $6,832.64 | $9,048.16 | $20,904.18 | $14,071.54 |
| 30 (retirement time frame) | $10,034.74 | $14,056.34 | $38,395.46 | $28,360.71 |
| 35 | $14,737.50 | $21,836.56 | $70,522.30 | $55,784.80 |
| 40 | $21,644.21 | $33,923.16 | $129,530.82 | $107,886.62 |
| 45 | $31,787.72 | $52,699.72 | $237,913.87 | $206,126.15 |
| 50 | $46,684.97 | $81,869.16 | $436,984.88 | $390,299.91 |
| 55 | $68,563.78 | $127,183.97 | $802,625.67 | $734,061.89 |
| 60 (investing lifetime) | $100,696.06 | $197,580.66 | $1,474,211.14 | $1,373,515.08 |
| 100 (institutional time frame, multi-generational wealth) | $2,179,486.17 | $6,702,560.00 | $190,955,782.45 | $188,776,296.28 |
(Sources: DK Research Terminal, FactSet)
Over the next 30 years analysts currently think these 10 very low risk high-yield blue chips could potentially deliver 70X returns, which is 38X inflation-adjusted returns.
Over an investing lifetime even a modest $1,000 invested today could provide life-changing income and wealth.
| Time Frame (Years) | Ratio Inflation-Adjusted 10 Lowest Risk High-Yield Blue-Chips Consensus/Aristocrat Consensus | Ratio Inflation-Adjusted 10 Lowest Risk High-Yield Blue-Chips Consensus vs. S&P consensus |
| 5 | 1.18 | 1.25 |
| 10 | 1.40 | 1.56 |
| 15 | 1.65 | 1.96 |
| 20 | 1.95 | 2.45 |
| 25 | 2.31 | 3.06 |
| 30 | 2.73 | 3.83 |
| 35 | 3.23 | 4.79 |
| 40 | 3.82 | 5.98 |
| 45 | 4.51 | 7.48 |
| 50 | 5.34 | 9.36 |
| 55 | 6.31 | 11.71 |
| 60 | 7.46 | 14.64 |
| 100 | 28.49 | 87.62 |
(Sources: DK Research Terminal, FactSet)
Over 30 years these very low risk high-yield blue-chips could potentially 4X the S&P 500 and almost triple the dividend aristocrats.
Over and investing lifetime they could deliver 7X to 15X better returns than the dividend aristocrats, and S&P respectively.
OK, this sounds amazing, but what evidence is there that these very low risk blue-chips can deliver anything close to 15% long-term returns?
Historical Returns Since 1997 (Annual Rebalancing)
The future doesn’t repeat, but it often rhymes. – Mark Twain
In our case, “past performance is no guarantee of future results.”
Still, studies show that blue chips with relatively stable fundamentals offer predictable returns based on yield, growth, and valuation mean reversion over time.
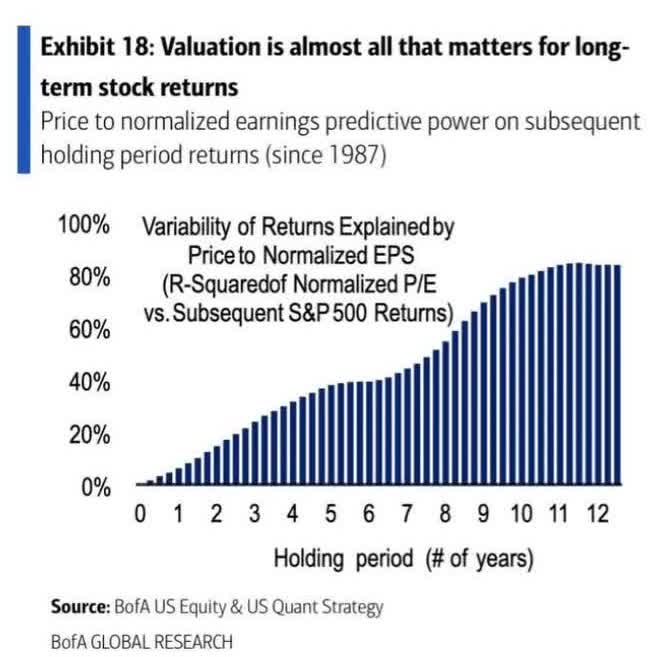
Bank of America
25 years is a time frame in which 95% of total returns are due to fundamentals, not luck.
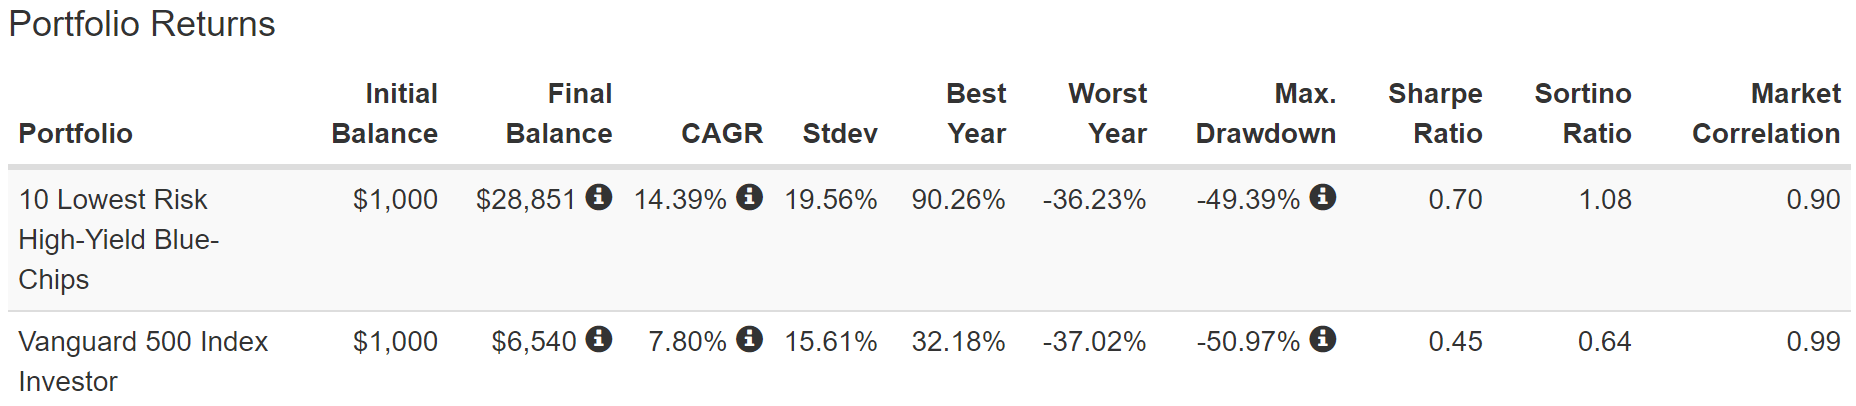
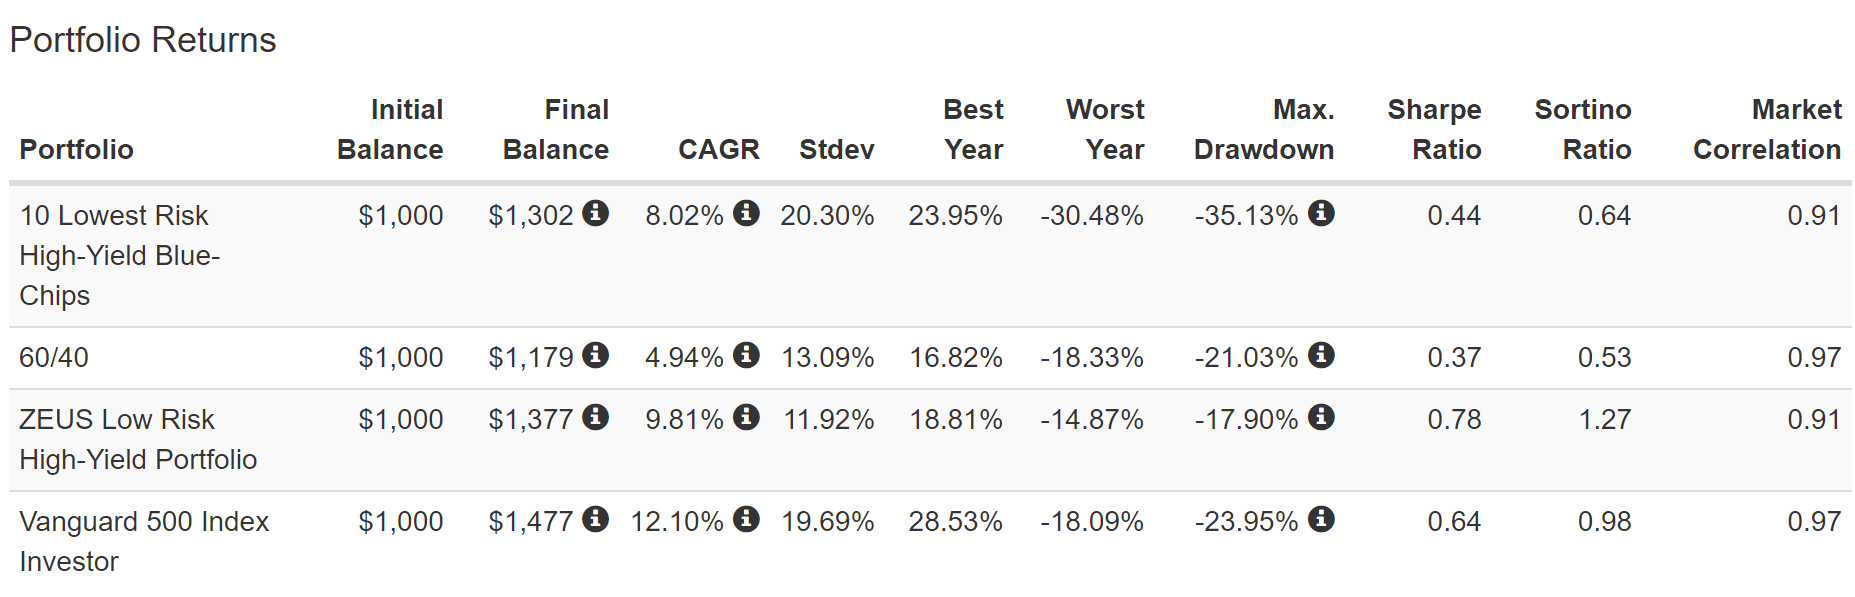
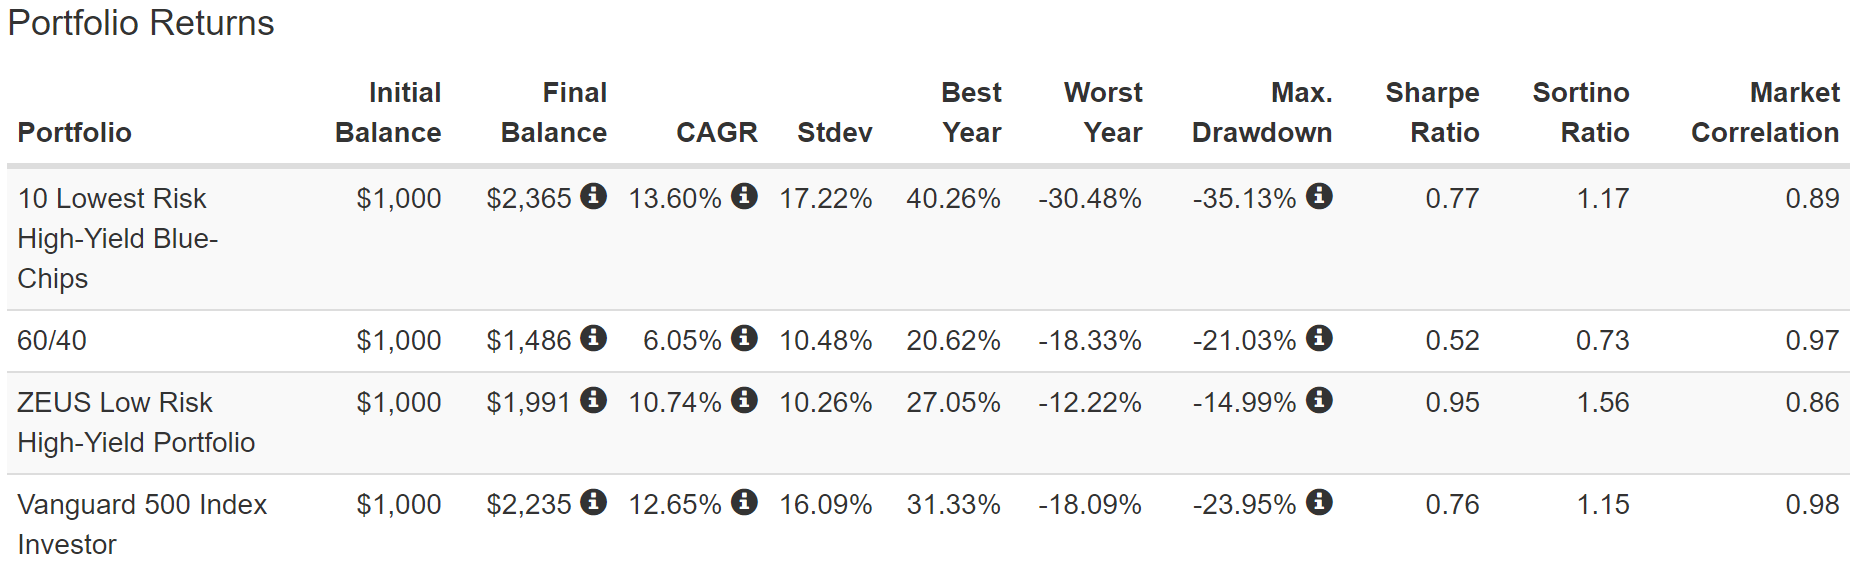
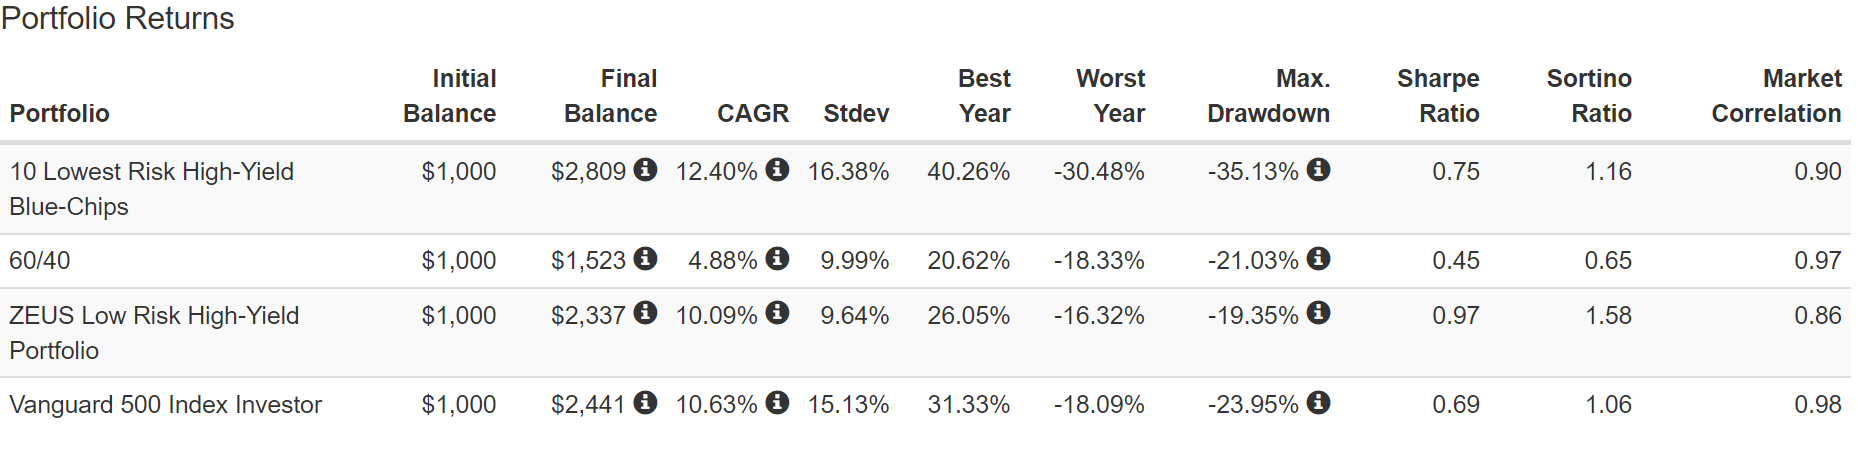
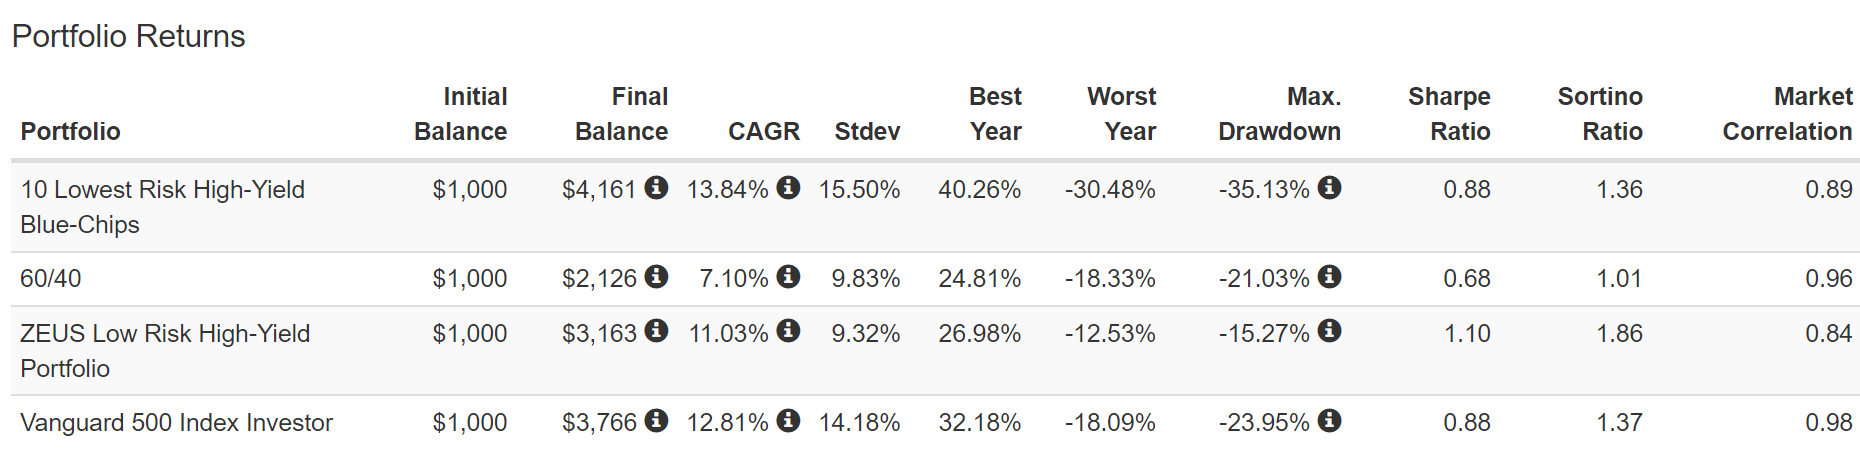
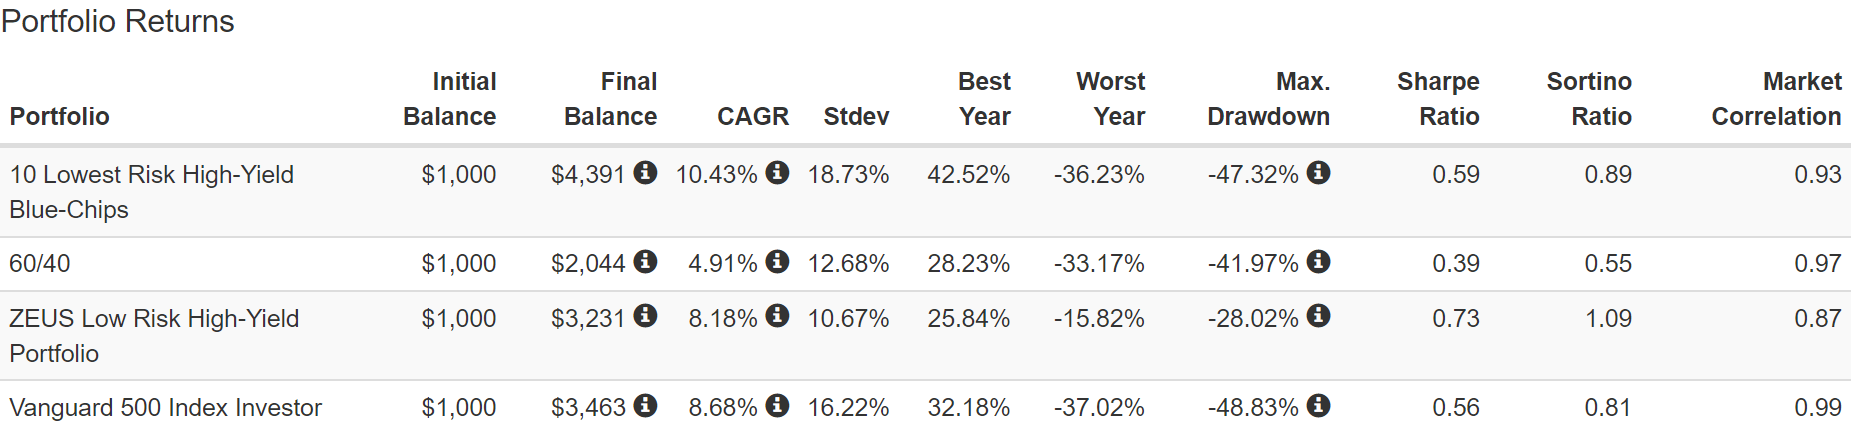
(Source: Portfolio Visualizer Premium)
Double the market’s returns for a quarter century, resulting in life-changing wealth.
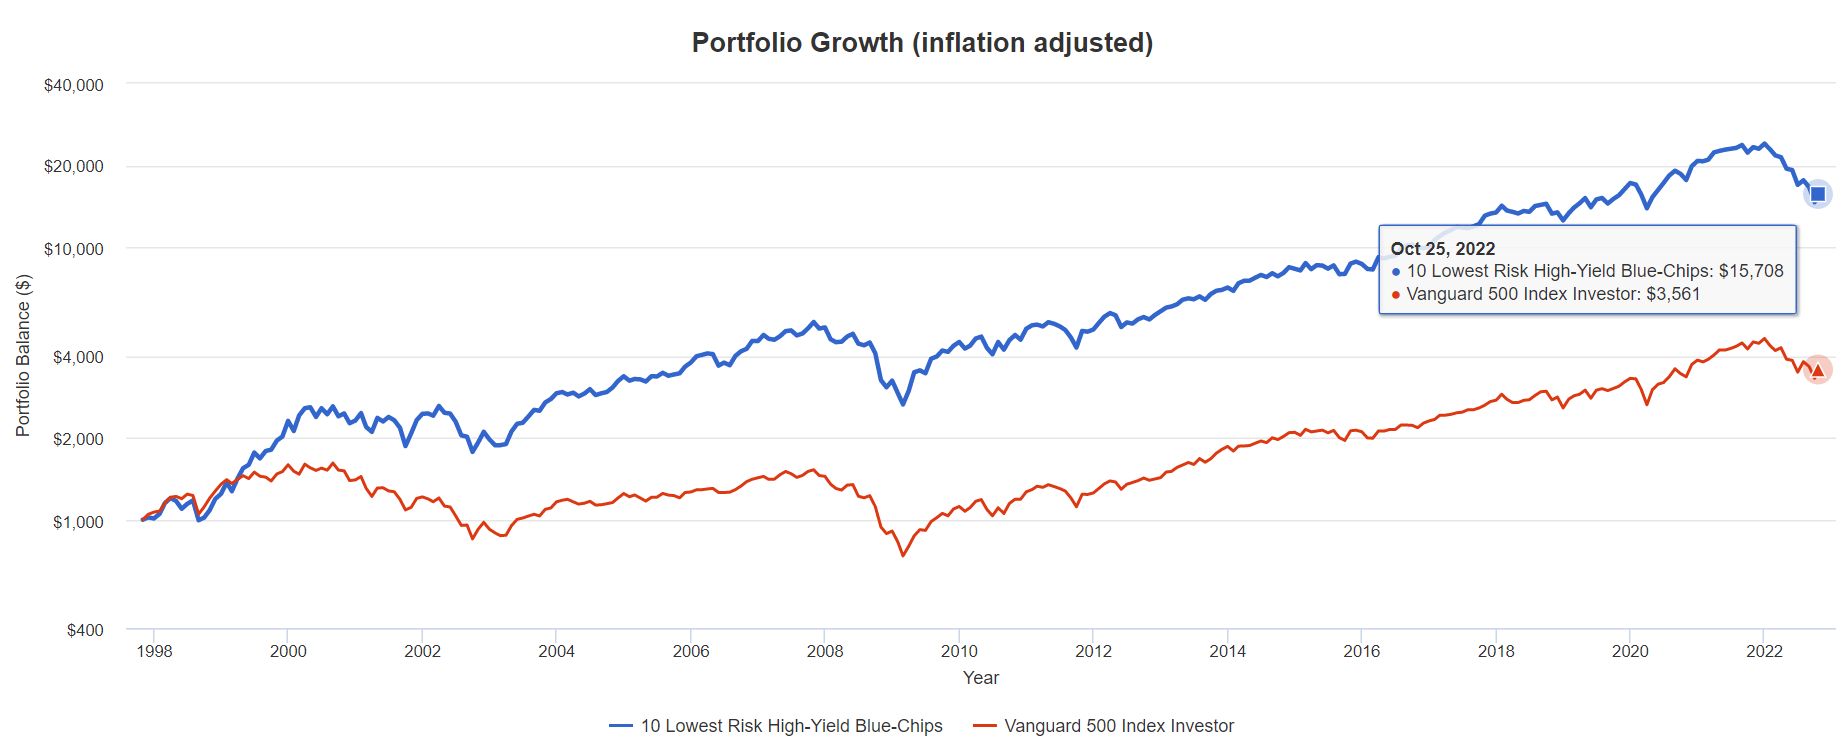
(Source: Portfolio Visualizer Premium)
16X inflation-adjusted returns vs. 21X analyst consensus real returns for the next 25 years.
- 4.4X better than the S&P 500 vs 3.1X consensus for the next 25 years
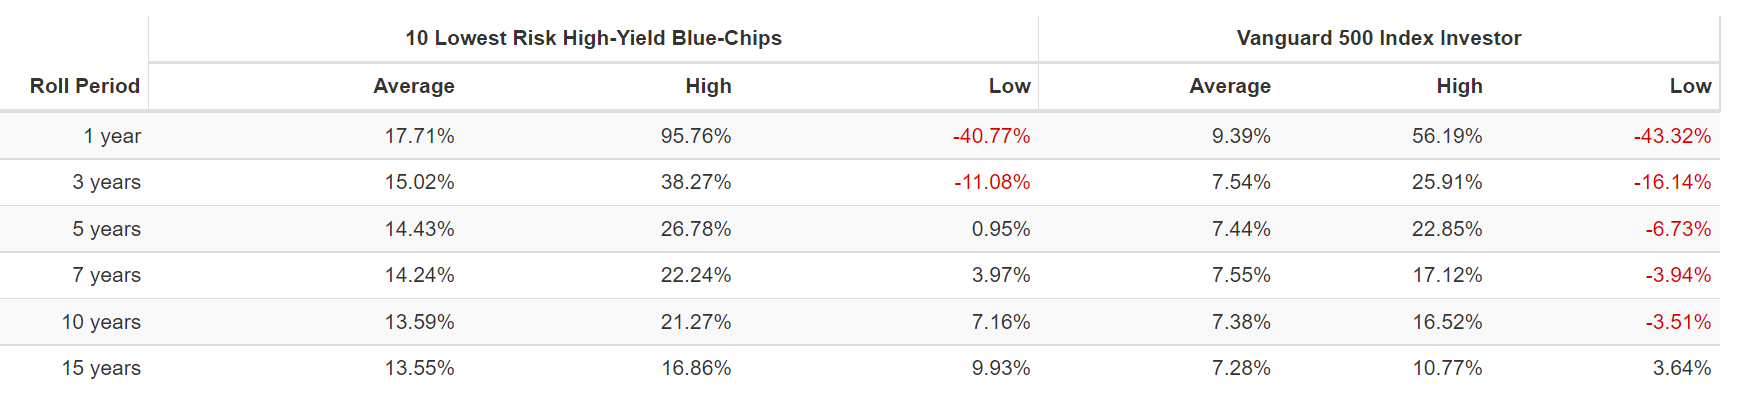
(Source: Portfolio Visualizer Premium)
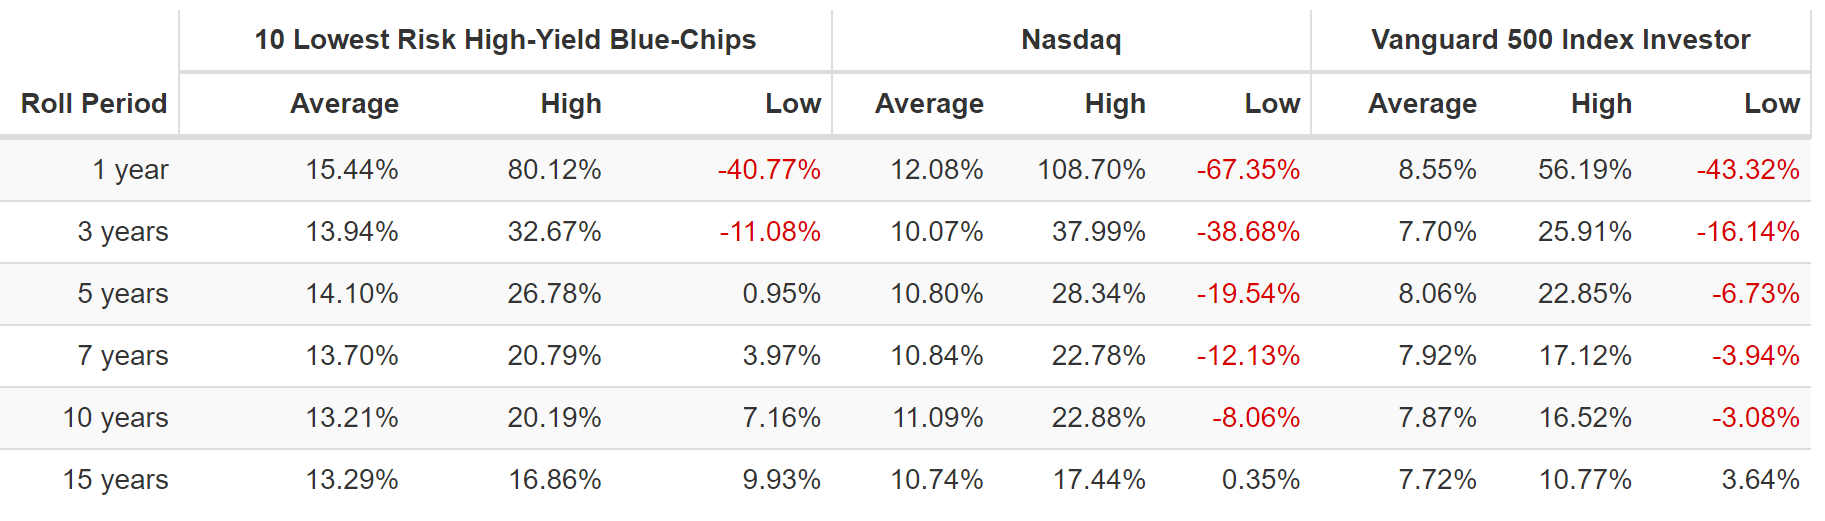
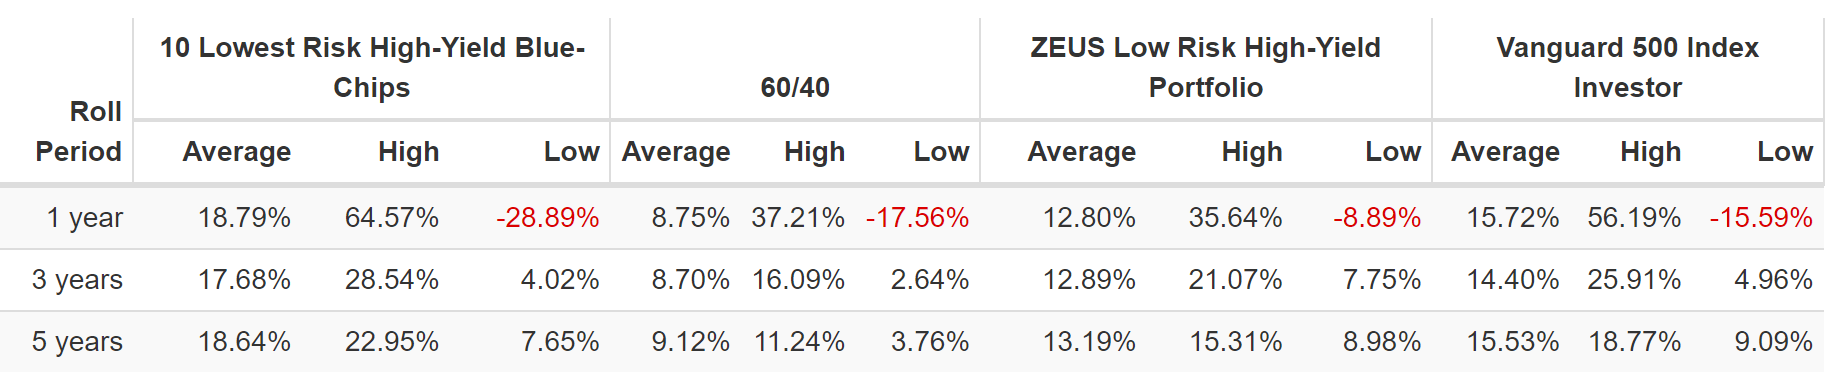
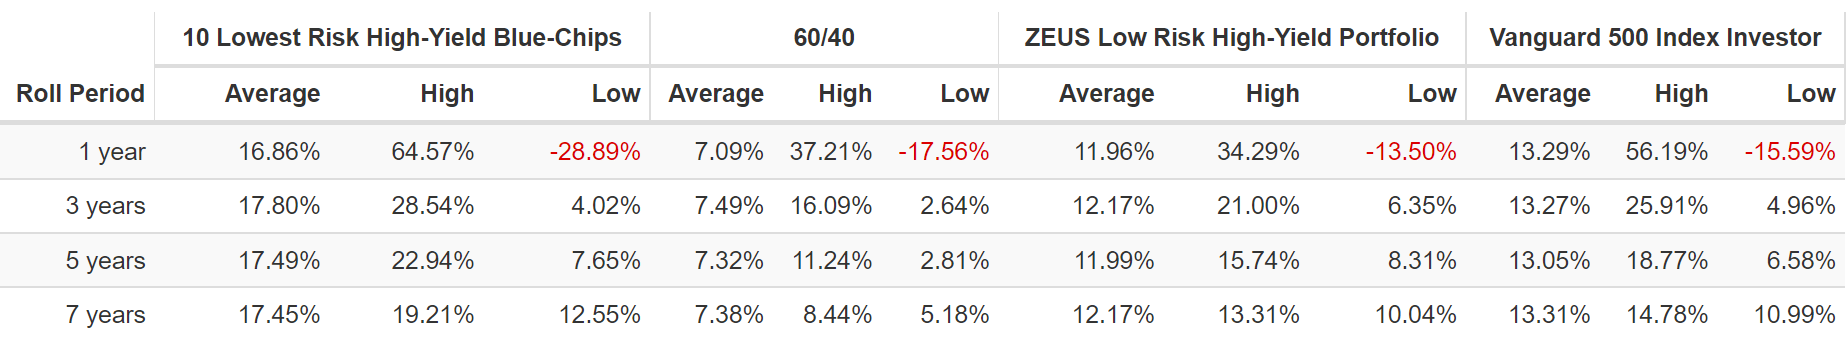
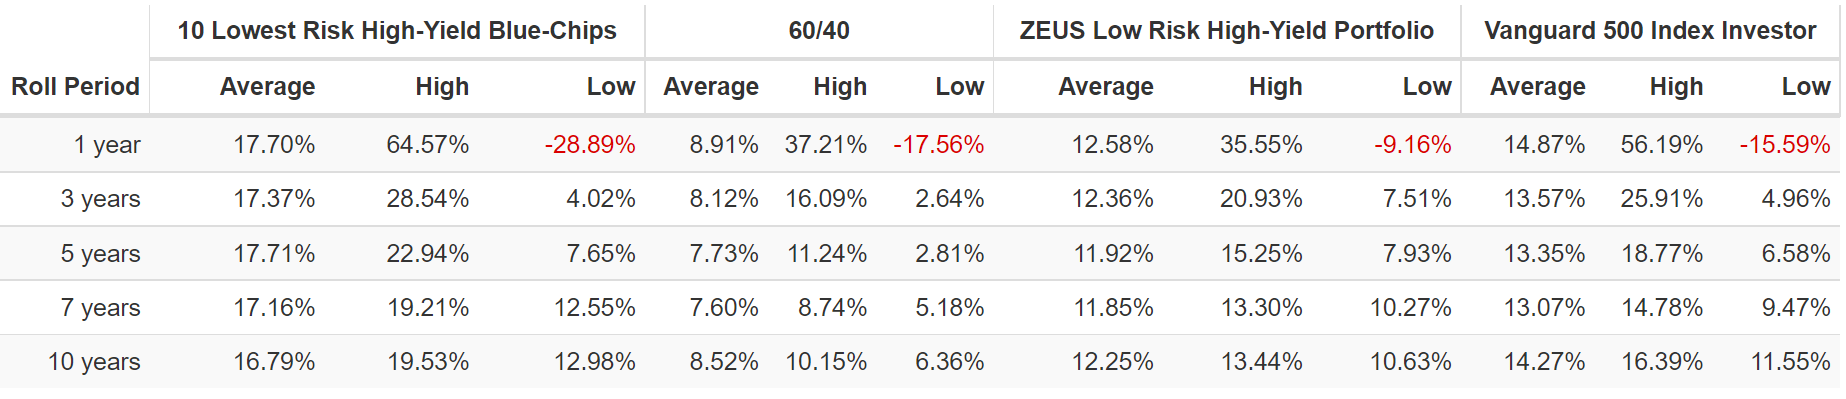
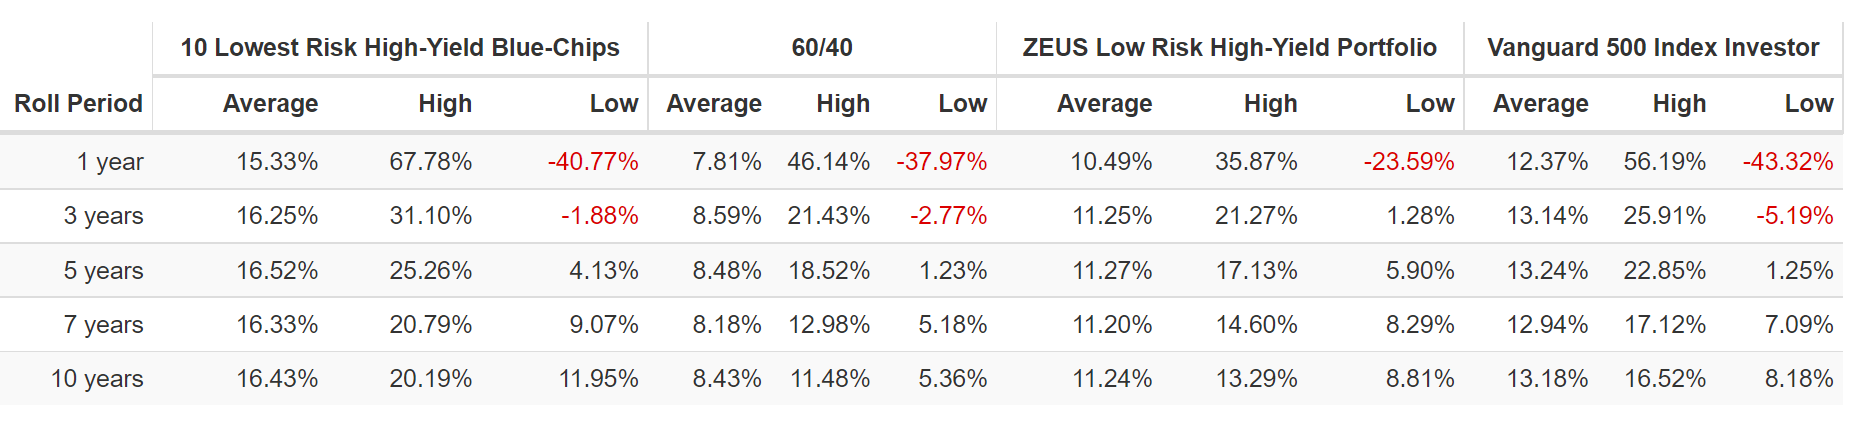
Double the market’s average rolling return in every time frame, for a quarter century.
- The market has spoken and confirmed a 95% statistical probability that these very low risk blue-chips are far superior to the S&P 500.
Historical Returns Since April 1999 (Nasdaq 100 Inception)
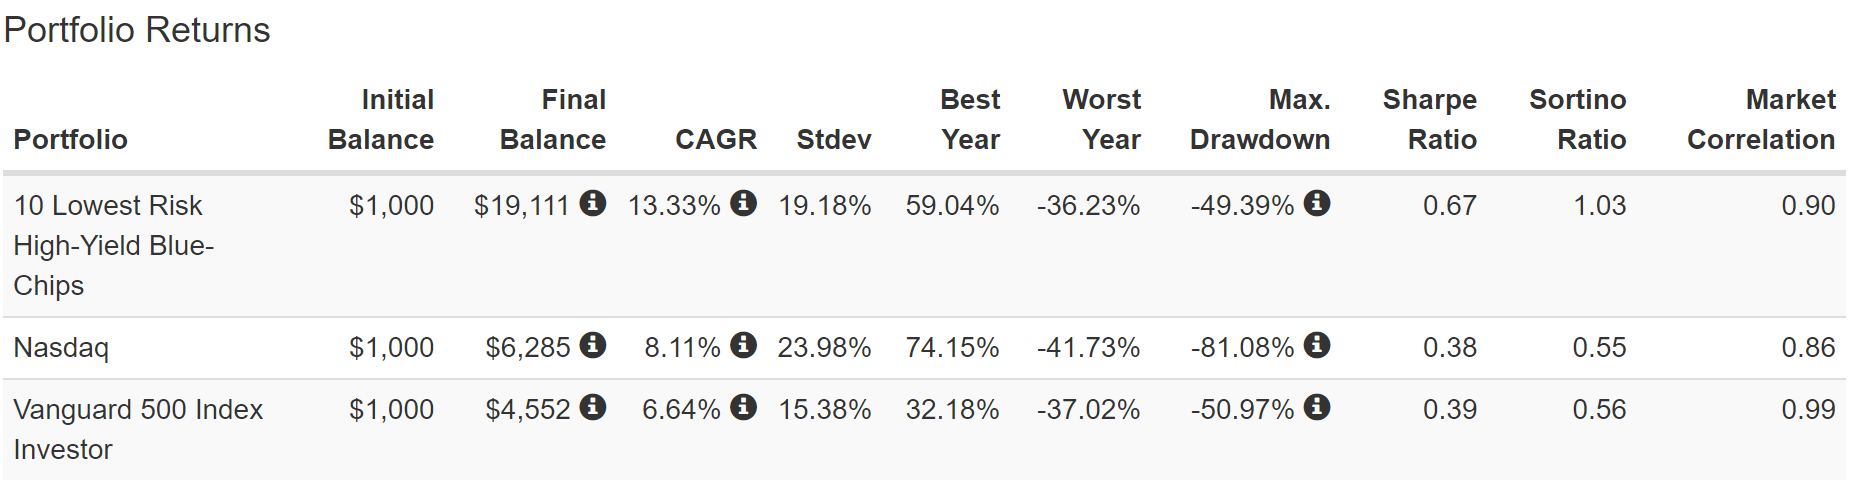
(Source: Portfolio Visualizer Premium)
Don’t think these very low risk blue-chips can beat the Nasdaq over time? They’ve been doing it for 23 years.
(Source: Portfolio Visualizer Premium)
Nasdaq’s average 12-month rolling return? 12.1% CAGR. Factset consensus for future returns? 12.3% CAGR.
Ten very low risk blue-chip average 12-month total returns? 15.4% vs 15.2% CAGR FactSet consensus.
And let’s not forget about income.
Very Safe Dividends You Can Trust In Any Economy
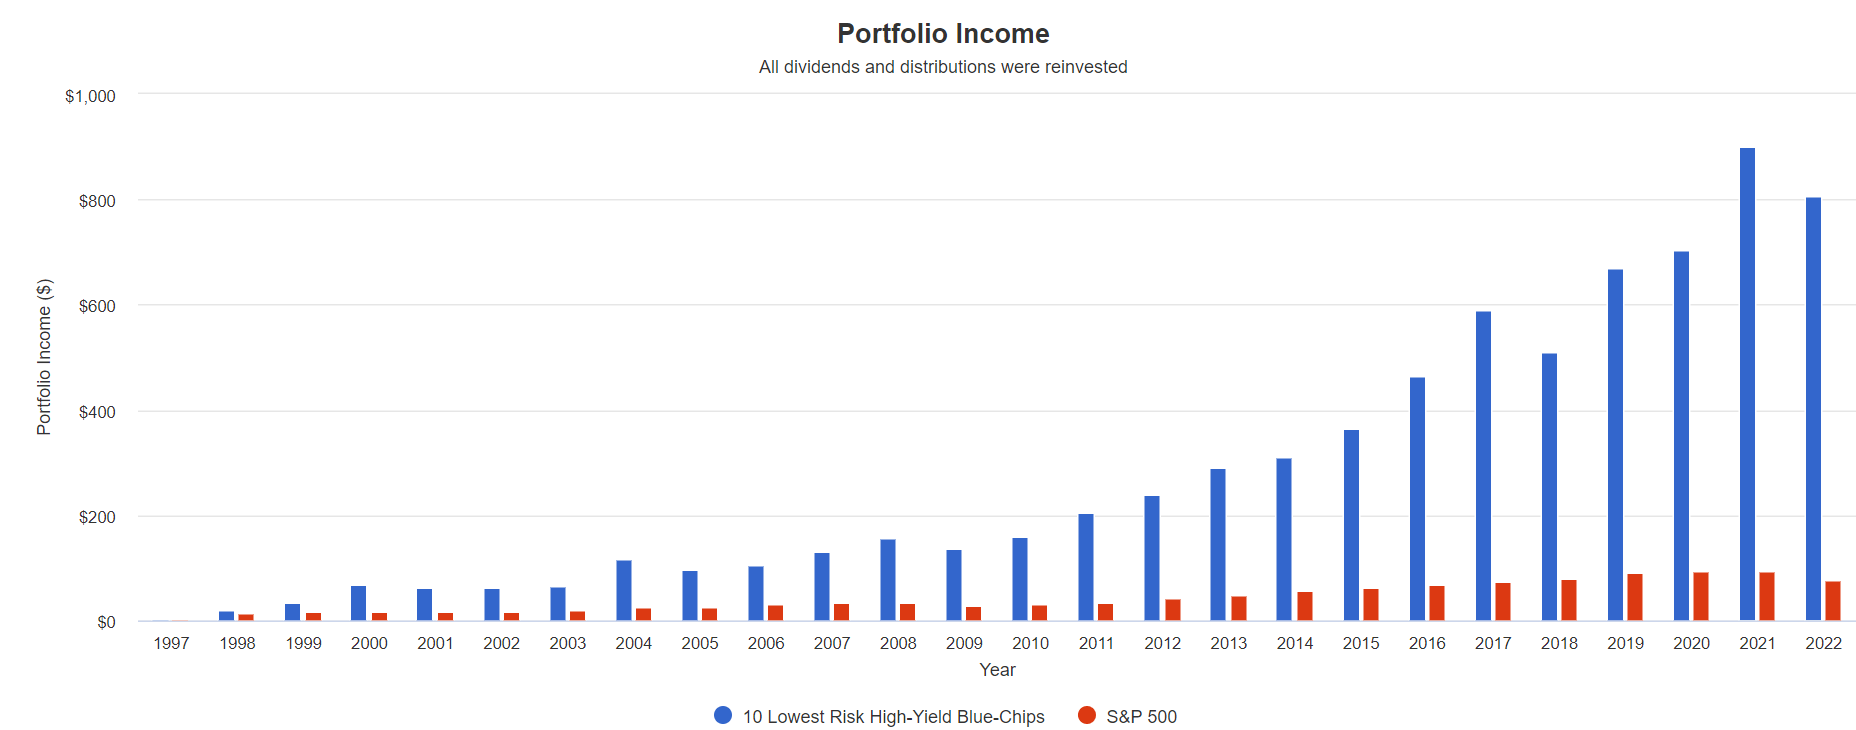
Per $1000 Initial Investment, In USD ((Source: Portfolio Visualizer Premium))
Even with currency fluctuations, these 10 very low risk high-yield blue-chips delivered fast, dependable, and consistent income growth.
- through three recessions
- 3 market crashes
- 2 economic crises
- stagflation
- five bear markets
- dozens of corrections and pullbacks
Cumulative Dividends Since 1998: Per $1,000 Initial Investment
| Metric | S&P 500 | 10 Lowest Risk High-Yield Blue-Chips |
| Total Dividends | $1,157 | $7,544 |
| Total Inflation-Adjusted Dividends | $639.23 | $4,167.96 |
| Annualized Income Growth Rate | 8.0% | 17.8% |
| Total Income/Initial Investment % | 1.16 | 7.54 |
| Inflation-Adjusted Income/Initial Investment % | 0.64 | 4.17 |
| More Inflation-Adjusted Income Than S&P | NA | 6.52 |
| Starting Yield | 1.6% | 2.1% |
| Today’s Annual Dividend Return On Your Starting Investment (Yield On Cost) | 10.1% | 107.7% |
| 2022 Inflation-Adjusted Annual Dividend Return On Your Starting Investment (Inflation-Adjusted Yield On Cost) | 5.6% | 59.5% |
(Source: Portfolio Visualizer Premium)
More than 2X the dividend growth rate of the S&P 500, resulting in 6.5X more inflation-adjusted dividends and an inflation-adjusted yield on cost of 60%.
- every $1 invested in 1998 is now paying $0.60 in inflation-adjusted dividends and growing exponentially
This is the power of very low risk high-yield blue-chip investing in a bear market.
How To Turn These 10 Very Low Risk High-Yield Blue-Chips Into A Complete Ultra SWAN Retirement Portfolio
This is a tech and industrial heavy portfolio and that means that its volatility might be more than many investors can handle if these 10 very low risk blue-chips are all you own.
(Source: Portfolio Visualizer Premium)
These very low risk blue chips tend to be as volatile as the market and that means the occasional big crashes.
(Source: Portfolio Visualizer Premium)
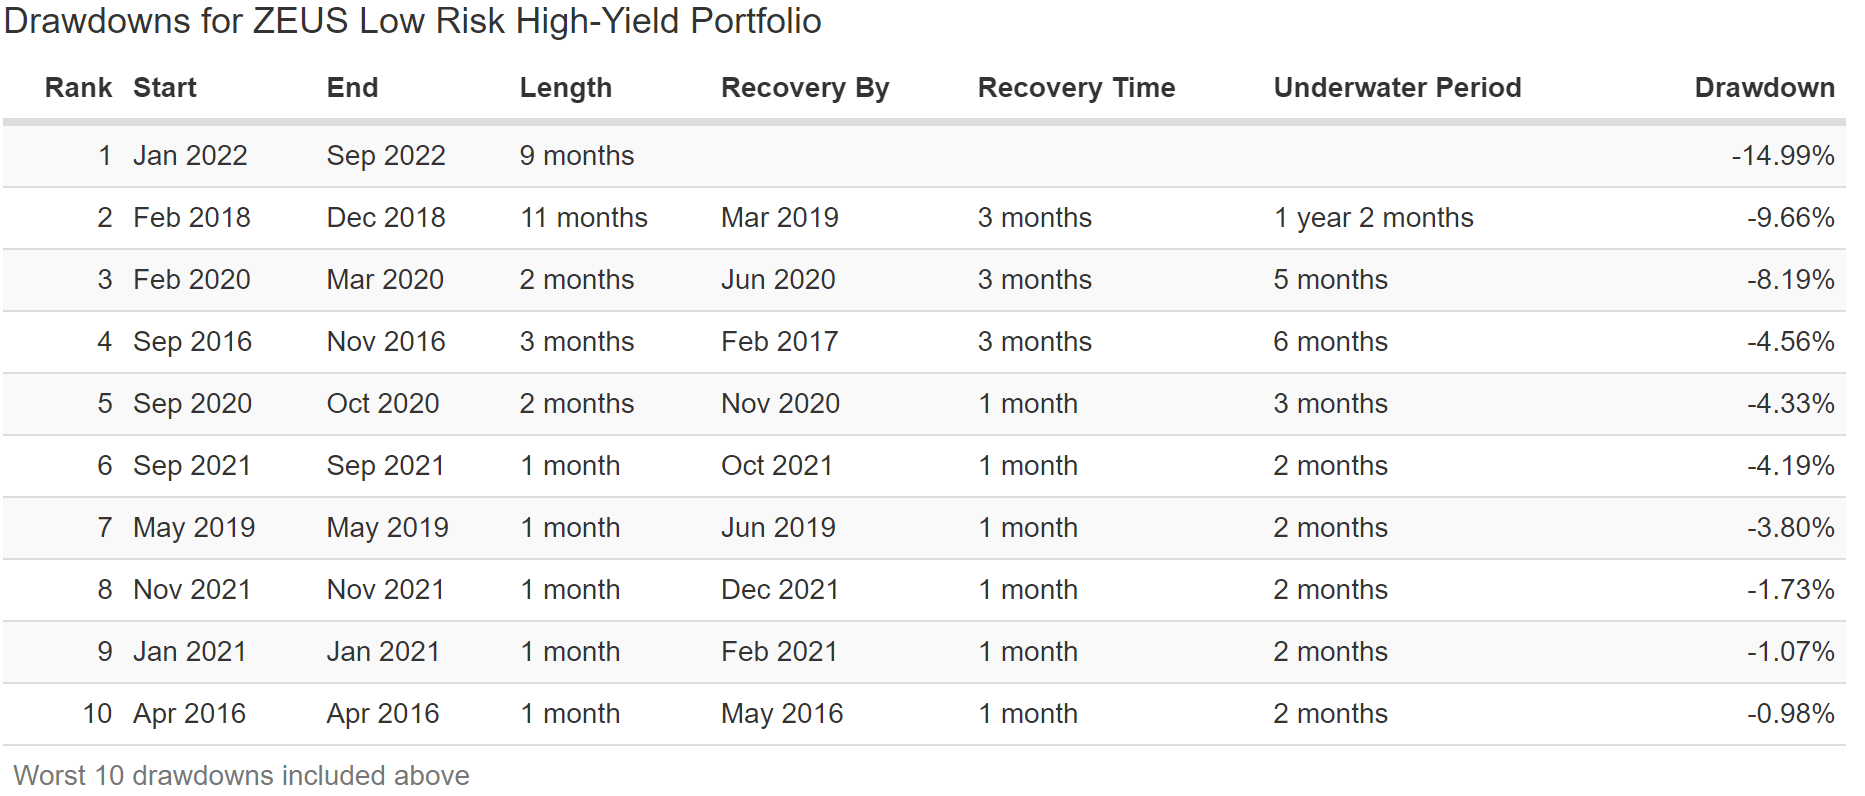
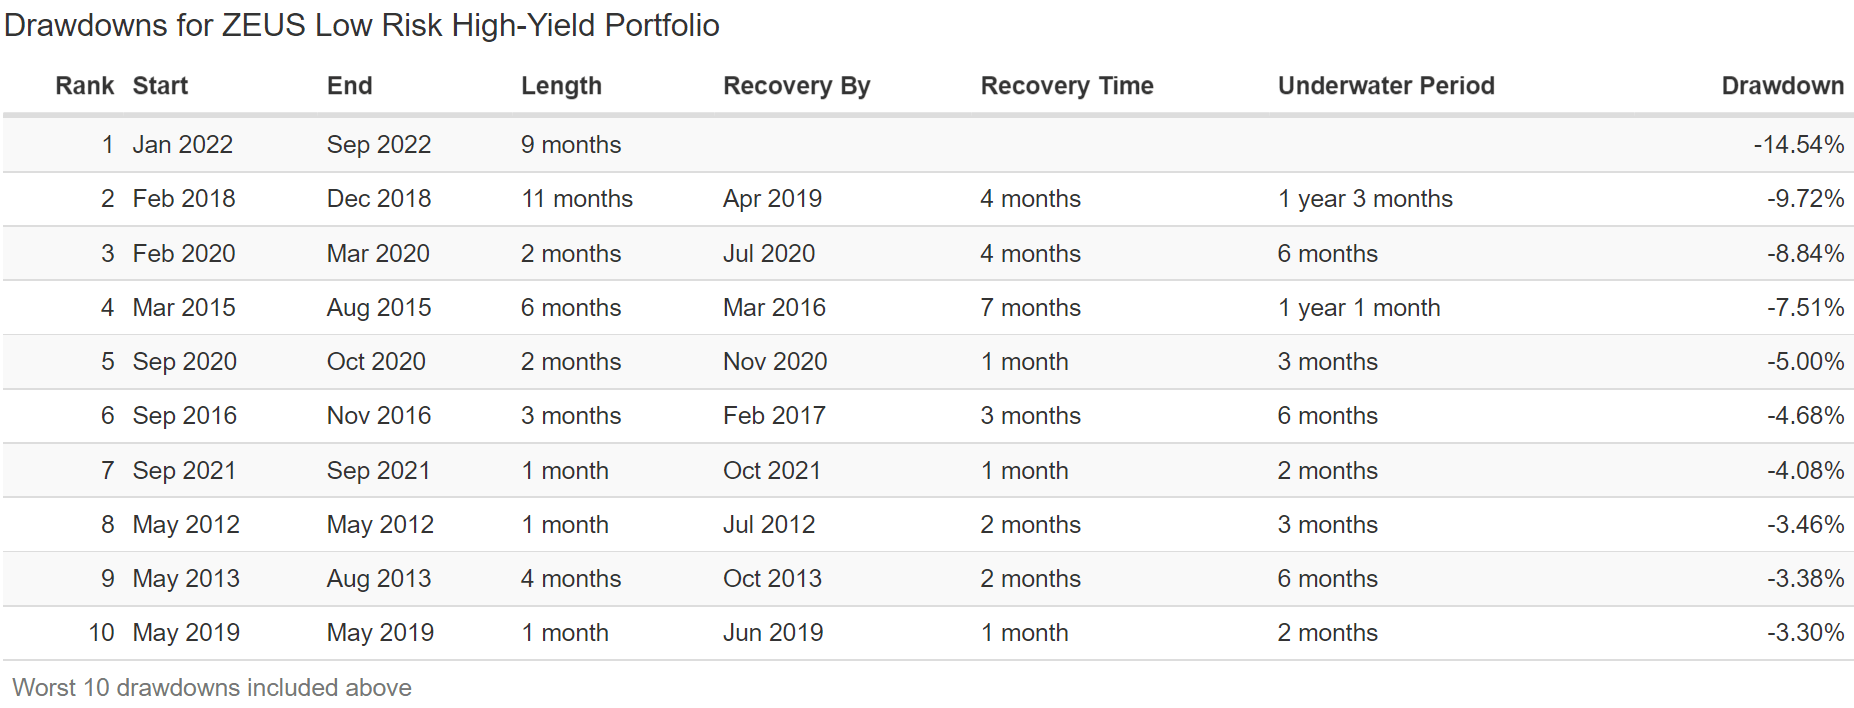
That includes a 35% peak decline in 2022’s stagflation bear market:
- Nasdaq -35%
- S&P -28%
- 60/40 -21%
But look what happens if we diversify these 10 very low risk blue chips with a prudent allocation of world-beater blue-chip assets.
- 33% SCHD or VYM (gold standard high-yield blue-chip ETFs)
- 16.7% EDV or TLT (gold standard long US treasury ETFs)
- 16.7% DBMF, GIFMX, PQTAX, AMFAX (4 or 5 star rated managed futures funds/ETFs)
- 33% these 10 very low risk high-yield blue-chips (3.3% each)
This creates the ZEUS Low Risk High-Yield portfolio.
- ZEUS = Zen Extraordinary Ultra SWAN (Sleep Well At Night)
| Metric | 60/40 | ZEUS Low Risk High-Yield | X Better Than 60/40 |
| Yield | 2.3% | 4.7% | 2.02 |
| Growth Consensus | 5.1% | 6.7% | 1.31 |
| LT Consensus Total Return Potential | 7.4% | 11.4% | 1.53 |
| Risk-Adjusted Expected Return | 5.2% | 8.0% | 1.53 |
| Safe Withdrawal Rate (Risk And Inflation-Adjusted Expected Returns) | 2.9% | 5.7% | 1.95 |
| Conservative Time To Double (Years) | 24.6 | 12.6 | 1.95 |
(Source: DK Research Terminal, FactSet)
2X the yield of a 60/40 with 53% higher consensus return potential and 2X the safe withdrawal rate.
Inflation-Adjusted Consensus Total Return Potential: $510K Average Retired Couple’s Savings At Age 65 Starting Investment
| Time Frame (Years) | 5.1% CAGR Inflation-Adjusted 60/40 | 9.1% Inflation-Adjusted ZEUS Low Risk High-Yield Consensus | Difference Between ZEUS High-Yield Income Growth Consensus and 60/40 Consensus |
| 5 | $654,320.24 | $789,388.79 | $135,068.54 |
| 10 | $839,480.35 | $1,199,624.18 | $360,143.83 |
| 15 | $1,077,037.23 | $1,839,851.33 | $762,814.09 |
| 20 | $1,381,818.17 | $2,821,761.14 | $1,439,942.98 |
| 25 | $1,772,846.27 | $4,327,706.17 | $2,554,859.90 |
| 30 | $2,274,527.85 | $6,637,358.65 | $4,362,830.80 |
| 35 | $2,918,175.72 | $10,179,648.99 | $7,261,473.28 |
| 40 | $3,743,963.62 | $15,612,423.43 | $11,868,459.81 |
| 45 | $4,803,433.69 | $23,944,613.96 | $19,141,180.26 |
| 50 | $6,162,713.53 | $36,723,609.25 | $30,560,895.72 |
| 55 | $7,906,643.56 | $56,322,623.49 | $48,415,979.93 |
| 60 | $10,144,072.43 | $86,381,430.95 | $76,237,358.52 |
| 100 | $74,468,702.13 | $2,644,359,757.57 | $2,569,891,055.44 |
(Source: DK Research Terminal, FactSet)
Analyst currently expect this ZEUS portfolio is capable of delivering about $4.4 million in additional inflation-adjusted wealth over a 30 year retirement time frame compared to a 60/40.
| Time Frame (Years) |
Ratio ZEUS Low Risk High-Yield Consensus Vs 60/40 Consensus |
| 5 | 1.21 |
| 10 | 1.43 |
| 15 | 1.71 |
| 20 | 2.04 |
| 25 | 2.44 |
| 30 | 2.92 |
| 35 | 3.49 |
| 40 | 4.17 |
| 45 | 4.98 |
| 50 | 5.96 |
| 55 | 7.12 |
| 60 | 8.52 |
| 100 | 35.51 |
(Source: DK Research Terminal, FactSet)
That’s 3X the inflation-adjusted returns of a 60/40. That’s the power of twice the long-term returns from a superior combination of world-beater blue-chip assets.
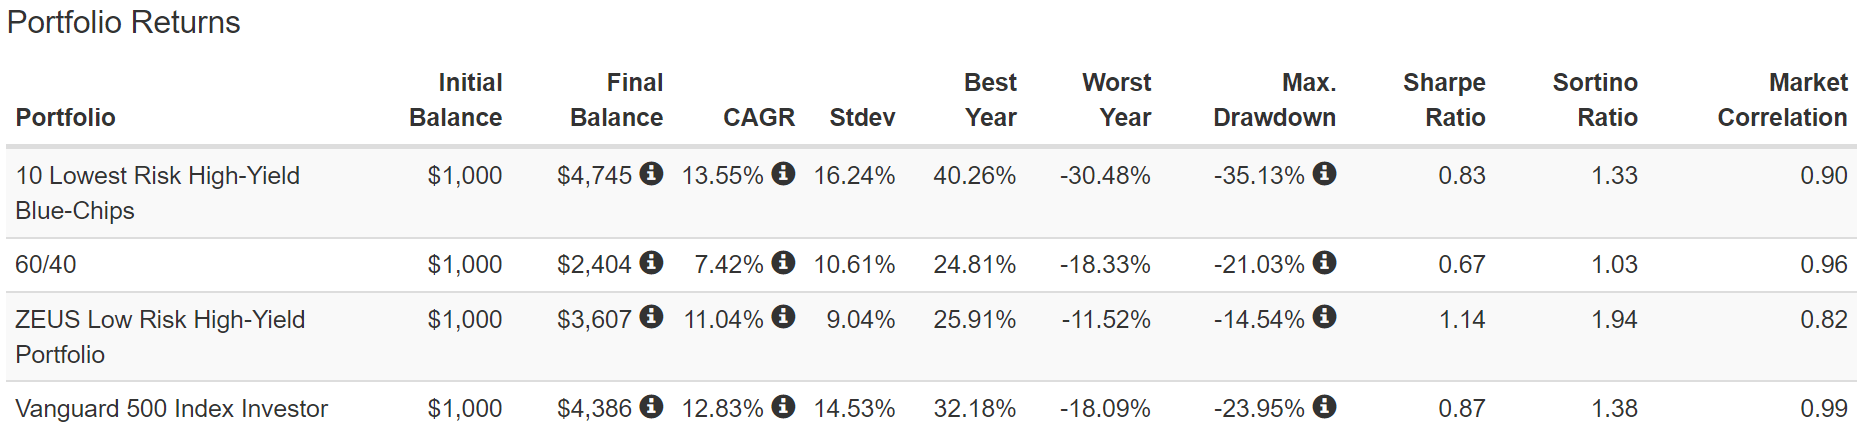
Historical Returns Since June 2019 (DBMF, EDV, SCHD, 10 Very Low Risk High-Yield Blue-Chips)
(Source: Portfolio Visualizer Premium)
ZEUS delivered higher returns than the 10 individual very low risk blue chips and with just 12% annual volatility, about half that of the blue chips themselves.
The peak decline is half as bad during the 2022 bear market.
- negative volatility-adjusted total returns (Sortino ratio) is 2X better than the blue-chips alone
- more than 2X better than a 60/40
- 30% better than the S&P 500
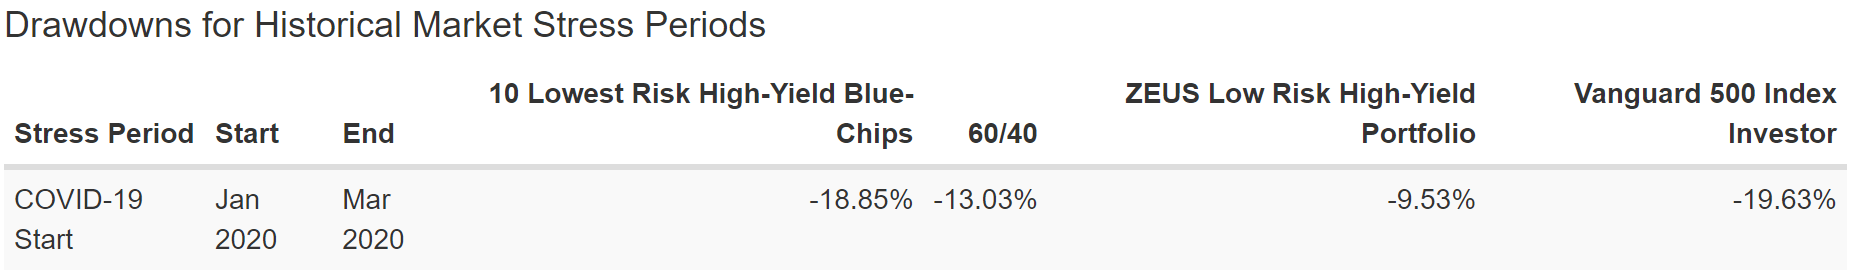
(Source: Portfolio Visualizer Premium)
In the Pandemic ZEUS fell less than 10%, half as much as the blue-chips on their own, and 30% less than a 60/40.
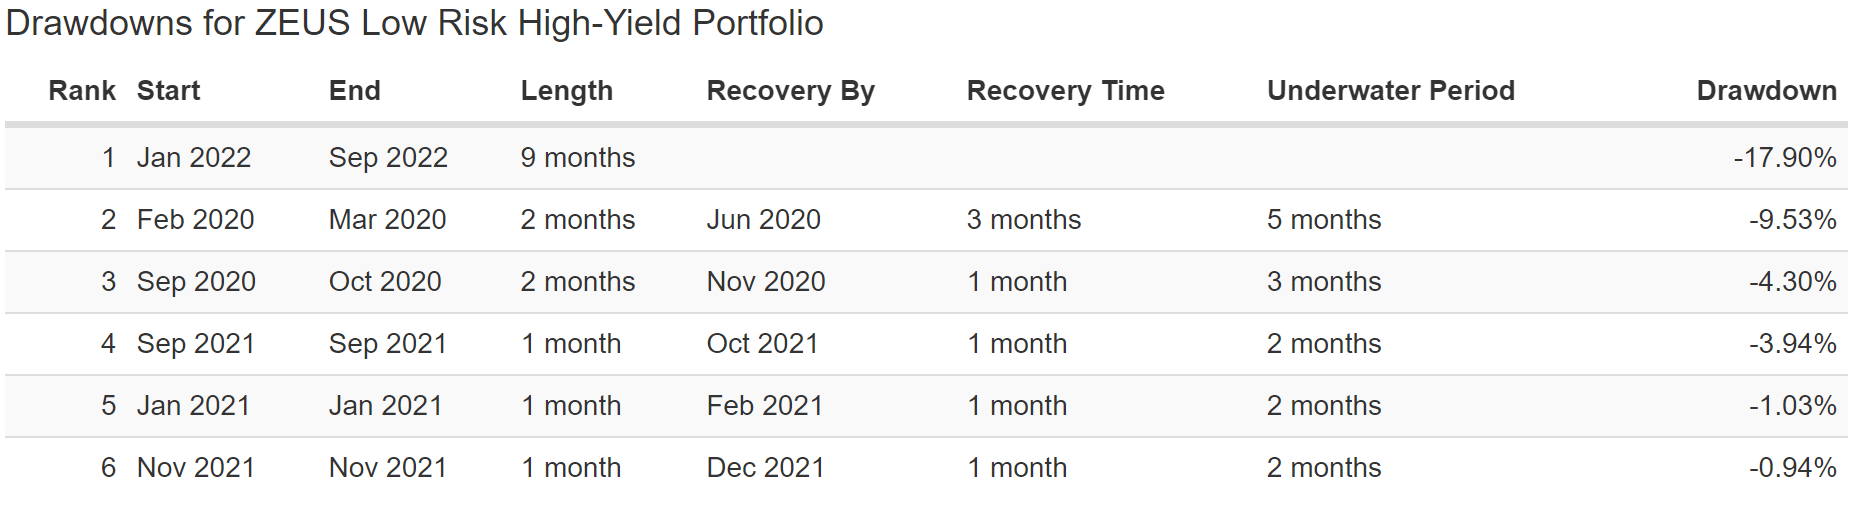
(Source: Portfolio Visualizer Premium)
In three years just two 5%-plus pullbacks or corrections.
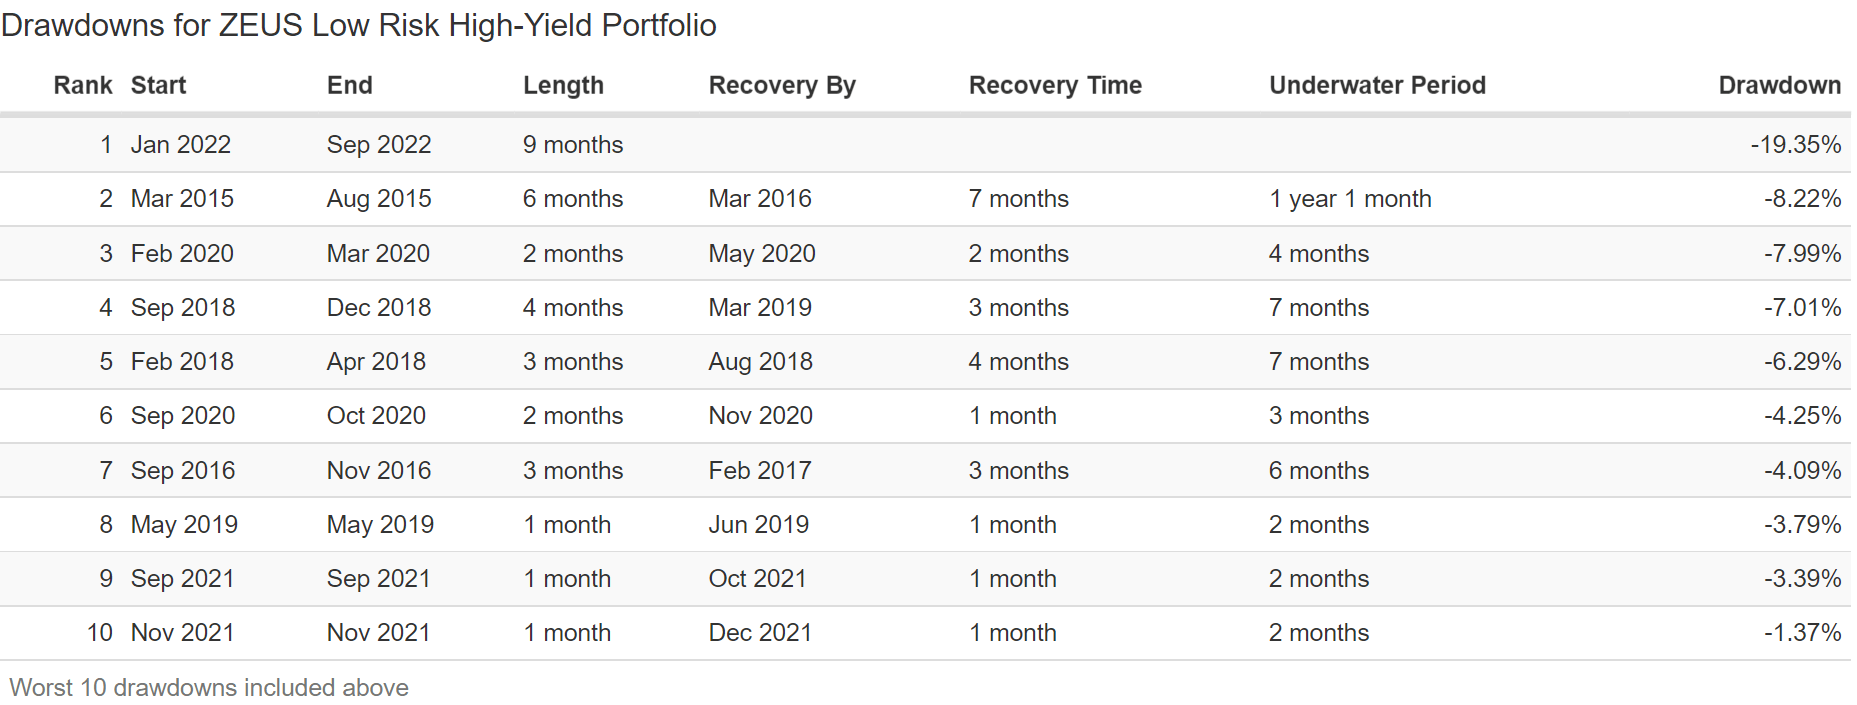
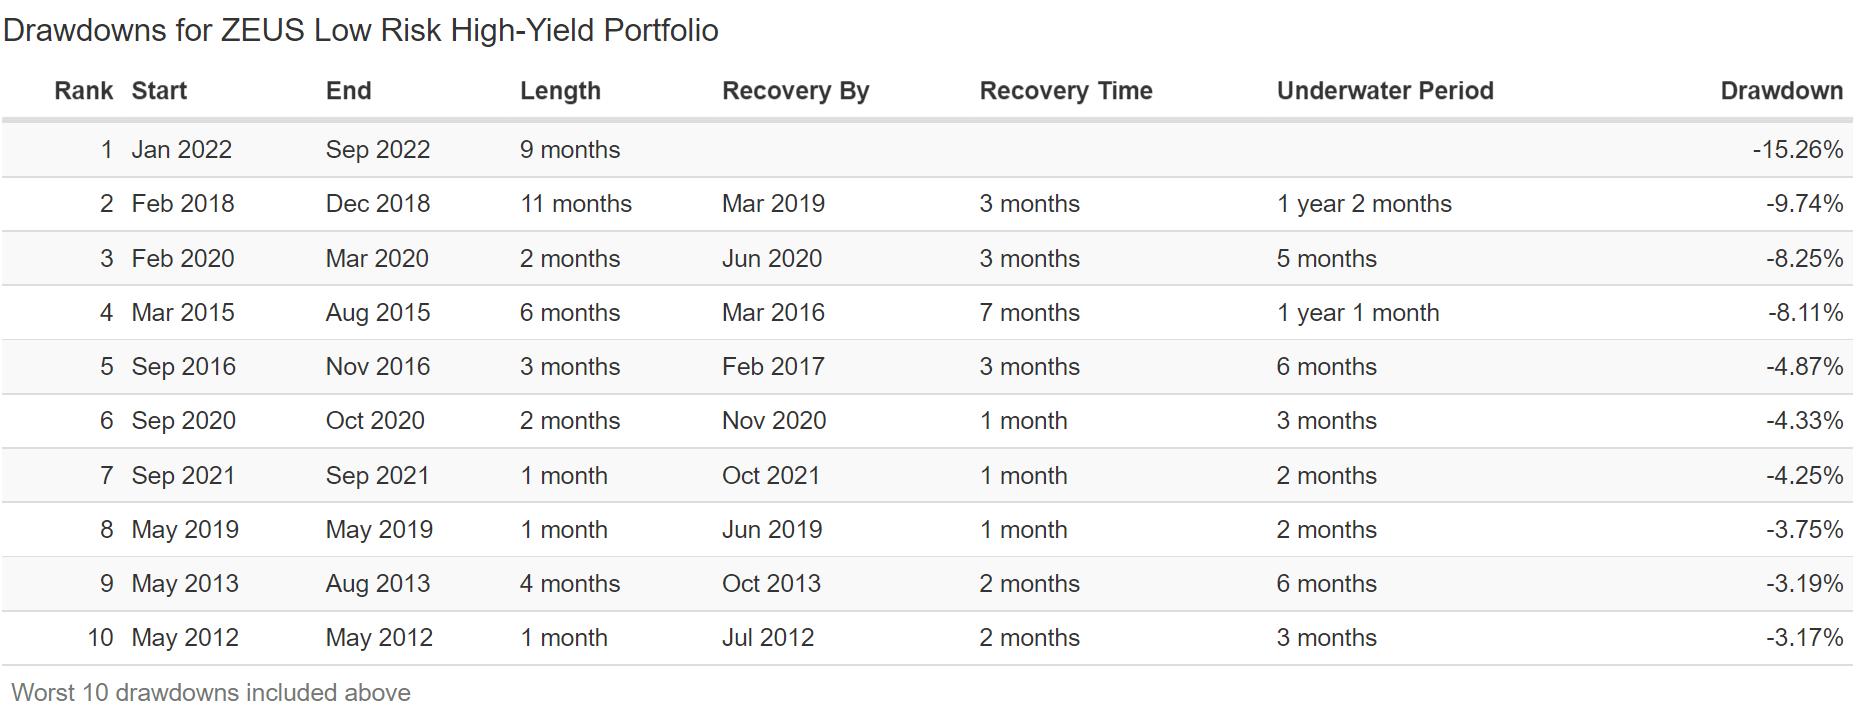
ZEUS In The 2022 Bear Market
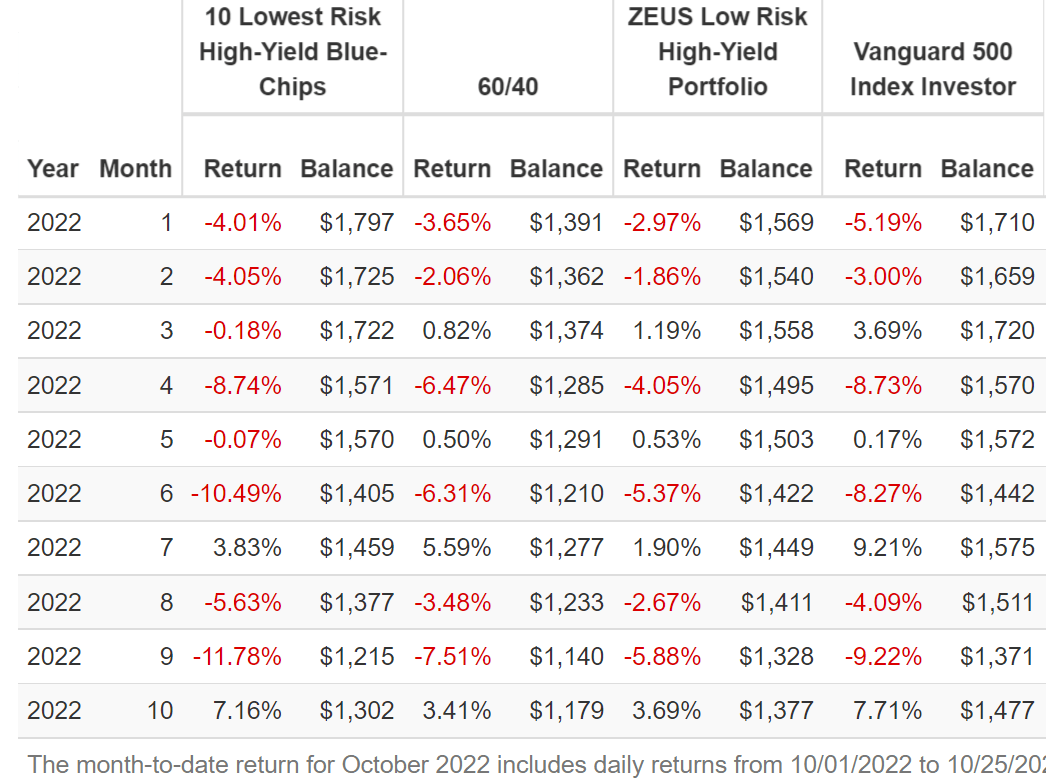
(Source: Portfolio Visualizer Premium)
ZEUS beat a 60/40 in every down month of this bear market, including falling less than 6% when the market fell 9.2% in September and the 10 very low risk blue-chips fell 12%.
- long-term risk management has nothing to do with short-term volatility
Historical Returns Since February 2016 (GIFMX, EDV, SCHD, 10 Very Low Risk High-Yield Blue-Chips)
(Source: Portfolio Visualizer Premium)
10% annual volatility that’s 41% lower than the blue-chips on their own and 60% smaller peak decline in 2022’s bear market.
- 2X the negative-volatility-adjusted returns of the 60/40 and 36% better than the S&P 500
(Source: Portfolio Visualizer Premium)
Smooth and strong returns, but with far less volatility than the stock market.
(Source: Portfolio Visualizer Premium)
In six years just three 5%-plus pullbacks, and no bear markets.
ZEUS In The Pandemic
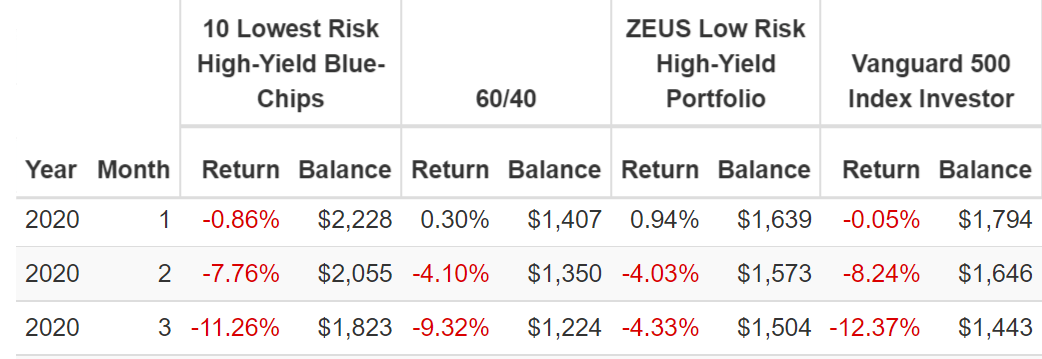
(Source: Portfolio Visualizer Premium)
In the Pandemic ZEUS was a champion falling less than 9% while the market hit a peak intra-day low of -34%.
Historical Returns Since January 2014 (PQTAX, EDV, SCHD, 10 Very Low Risk High-Yield Blue Chips)
(Source: Portfolio Visualizer Premium)
Eight years of nearly market-matching returns but with 33% less volatility and a 50% higher negative-volatility-adjusted return.
(Source: Portfolio Visualizer Premium)
Consistently 4.5% higher returns than a 60/40, just as analysts expect in the future.
(Source: Portfolio Visualizer Premium)
This is the most volatile version of ZEUS and yet still no bear markets in eight years.
- just five 5%-plus pullbacks
ZEUS In The Bear Market Of 2018
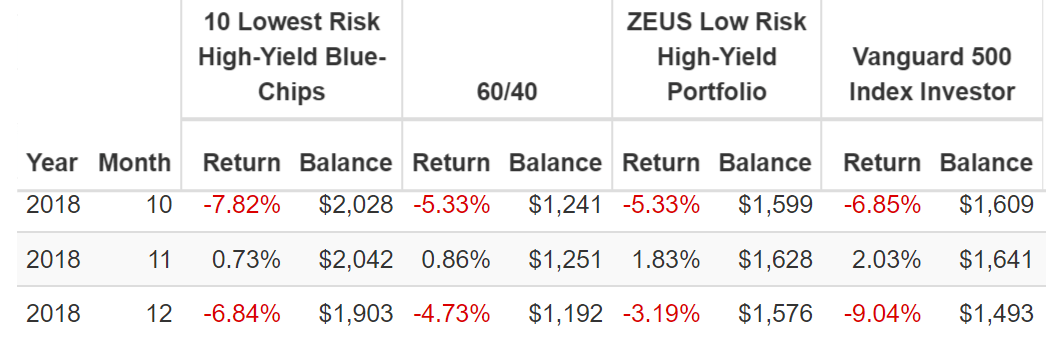
(Source: Portfolio Visualizer Premium)
(Source: Portfolio Visualizer Premium)
On Dec. 24, 2018 the S&P hit an intra-day low of -21%.
The market fell 9% in December (including a ferocious rally starting Dec. 25) and ZEUS fell one-third as much, just 3%.
Historical Returns Since November 2011 (AMFAX, EDV, SCHD, 10 Very Low Risk High-Yield Blue-Chips)
(Source: Portfolio Visualizer Premium)
Nearly market matching returns but with just 9% annual volatility, and a peak decline of 15%.
- negative-volatility-adjusted returns 85% better than a 60/40, 37% better than the blue-chips on their own, and 37% better than the S&P 500.
(Source: Portfolio Visualizer Premium)
Silky smooth 12% annual returns.
(Source: Portfolio Visualizer Premium)
No bear markets in 11 years, and just four 5%-plus pullbacks.
Historical Returns Since August 2010 (AMFAX, EDV, VYM, 10 Very Low Risk High-Yield Blue-Chips)
(Source: Portfolio Visualizer Premium)
11% annual returns as expected with 9% annual volatility and a peak decline of less than 15%.
- negative-volatility-adjusted total returns 41% better than the S&P, 46% better than the low risk blue-chips, and 88% better than a 60/40
(Source: Portfolio Visualizer Premium)
11 years and just five 5%-plus pullbacks with no bear markets.
ZEUS In The Bear Market Of 2011
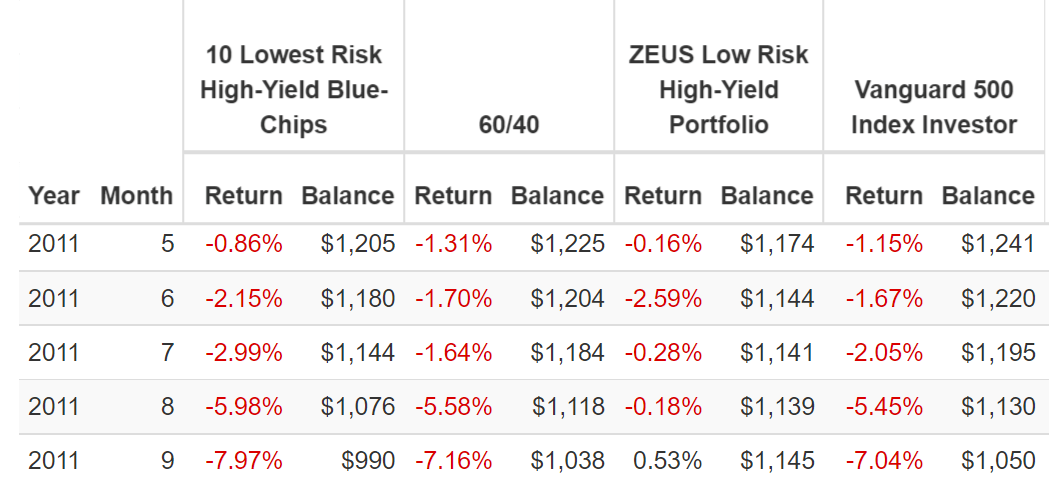
(Source: Portfolio Visualizer Premium)
The S&P fell 22% at its peak in 2011 while ZEUS fell a peak of 2.6%. It went up 0.5% in September 2011 when the market crashed 7% and so did a 60/40.
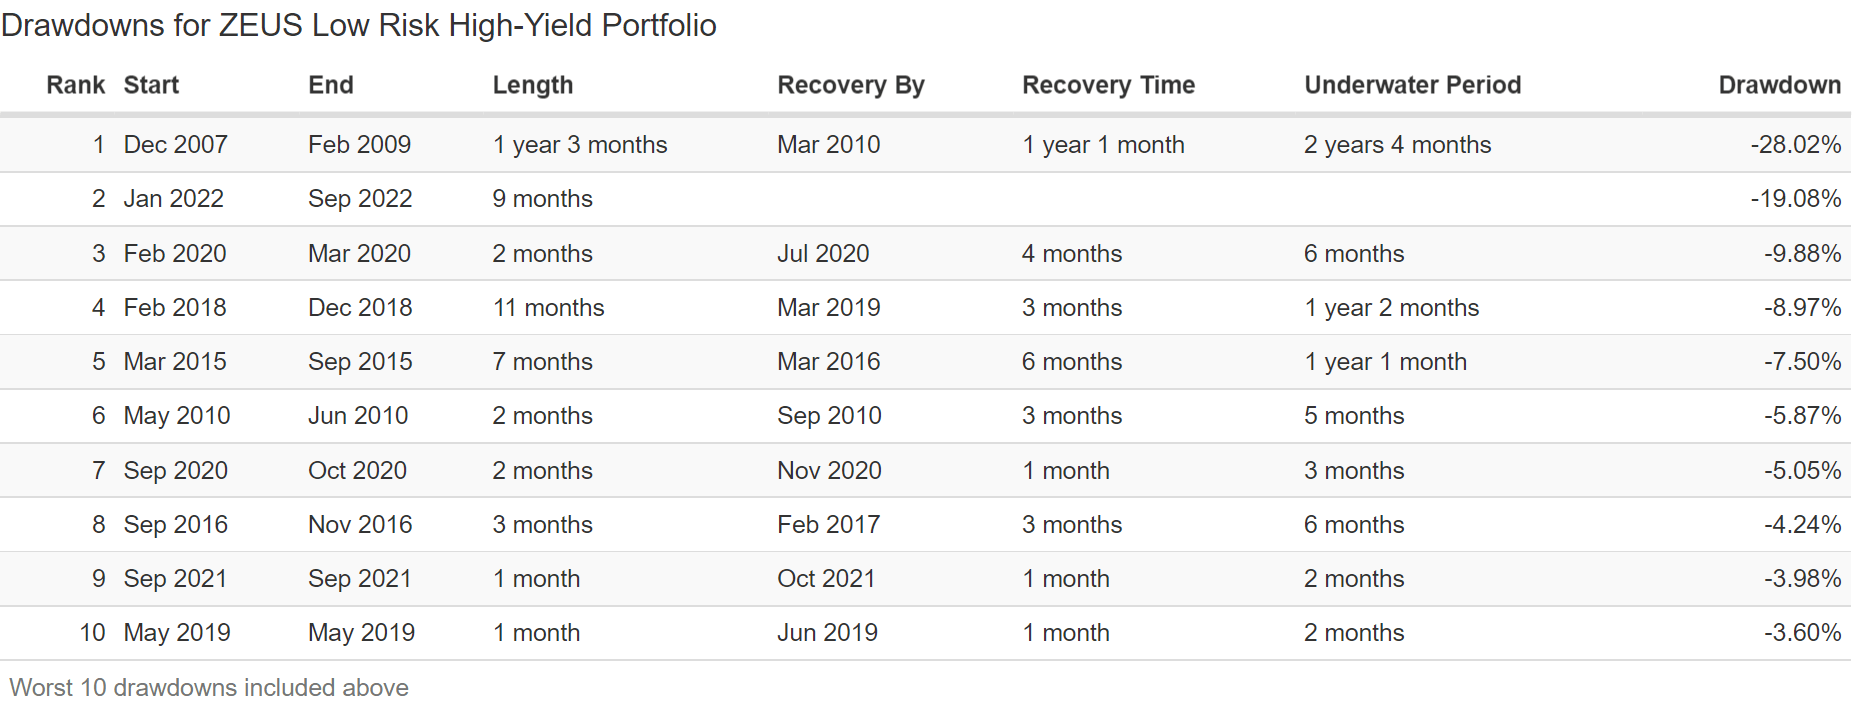
Historical Returns Since December 2007 (RYMTX, EDV, VYM, 10 Very Low Risk High-Yield Blue-Chips)
(Source: Portfolio Visualizer Premium)
Even including the Great Recession, less than 11% annual volatility and almost 50% smaller peak decline than the S&P 500.
(Source: Portfolio Visualizer Premium)
Consistent rolling returns at the same rate as analysts expect in the future.
(Source: Portfolio Visualizer Premium)
In 15 years just one bear market, during the second-largest market crash in US history.
Just seven 5%-plus declines in all that time of consistent double-digit returns.
ZEUS In The Great Recession
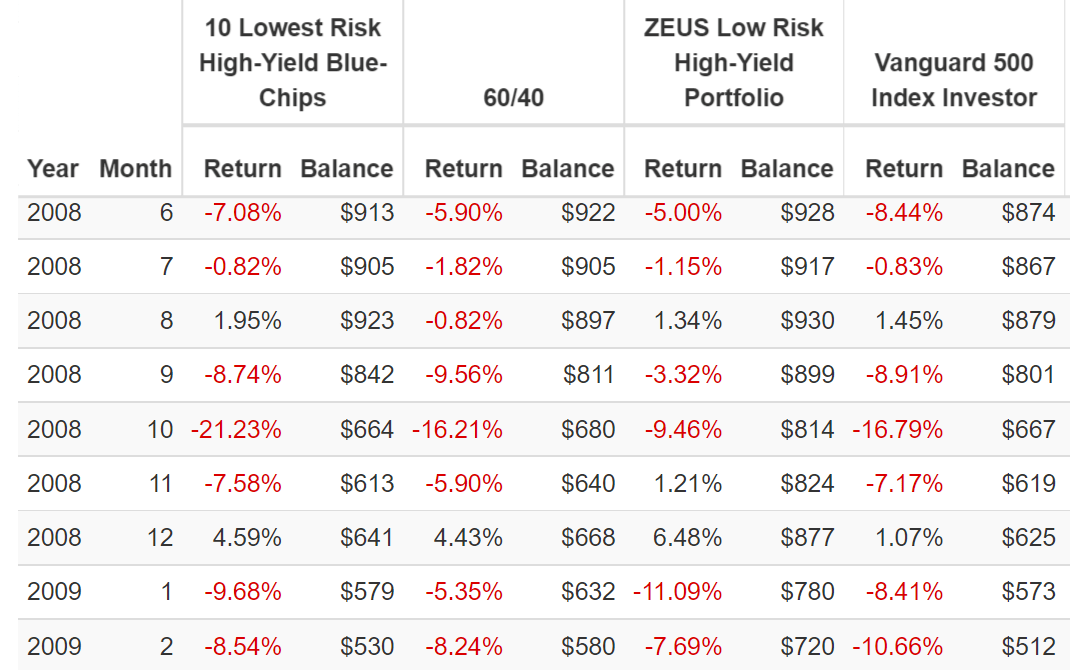
(Source: Portfolio Visualizer Premium)
October 2008 the market fell 17% and the low risk blue-chips 21%. Even a 60/40 fell 16% but ZEUS fell less than 10%.
- 41% less than the market
- 38% less than a 60/40
Bottom Line: These Are The 10 Lowest Risk High-Yield Blue Chips For This Recession
Let me be clear: I’m NOT calling the bottom in any of these blue chips (I’m not a market timer).
Sleep Well At Night doesn’t mean “can’t fall hard in a bear market.”
Fundamentals are all that determine safety and quality, and my recommendations.
- over 30+ years, 97% of stock returns are a function of pure fundamentals, not luck
- in the short term; luck is 25X as powerful as fundamentals
- in the long term, fundamentals are 33X as powerful as luck
Or to put another way, price volatility is NOT a good measure of risk.
Volatility caused by money managers who speculate irrationality with huge sums will offer the true investor more chance to make intelligent investment moves. He can be hurt by such volatility only if he is forced, by either financial or psychological pressures, to sell at untoward times.” Warren Buffett (emphasis added)
Very low risk stocks are not stocks that can’t fall in a bear market (such things don’t exist). But companies that are impeccable at managing every single aspect of their fundamental risk?
Those are plentiful and BTI, SIEGY, CSCO, ADBE, LIN, ALIZY, TSM, SWK, KRC, and MSFT are the 10 lowest risk high-yield blue-chips you can buy today according to S&P.
- 3.5% very safe yield
- A- stable credit rating
- 99th percentile risk management
- 11.7% CAGR growth consensus
- 15.2% CAGR long-term return consensus vs. 15.4% CAGR returns over the last 25 years
If you want to sleep well at night in the coming recession, you need to focus on safety and quality first, and prudent valuation and sound risk management always.
That’s what these 10 very low risk high-yield blue-chips offer, no matter how bad the recession of 2023 proves to be.
So if you’re tired of worrying about market volatility, consider these 10 very low risk blue-chips.
If you’re sick of losing sleep in market crashes, turn to 10 of the world’s best world-beater blue-chips, with 99th percentile risk management.
If you want to enjoy generous, safe, and steadily growing income in all economic conditions, these are 10 very low risk blue-chips that fit the bill.
Be the first to comment