

JHVEPhoto
November 16th was not a particularly pleasant day for shareholders of retail giant Target (NYSE:TGT). Despite reporting revenue figures for the third quarter of its 2022 fiscal year that exceeded expectations set by analysts, shares of the company plunged, falling 13.1% in response to missed earnings, soft guidance, and surging inventory levels. In the event that the company can return to the kind of financial performance experienced in prior fiscal years, there might be some upside for investors. Eventually, that performance will come. But when you factor in how the data is looking today, that could be multiple quarters from now. Because of this, the opportunity cost for investors leads me to believe that there are better prospects to consider at this time.
A big markdown
Author – SEC EDGAR Data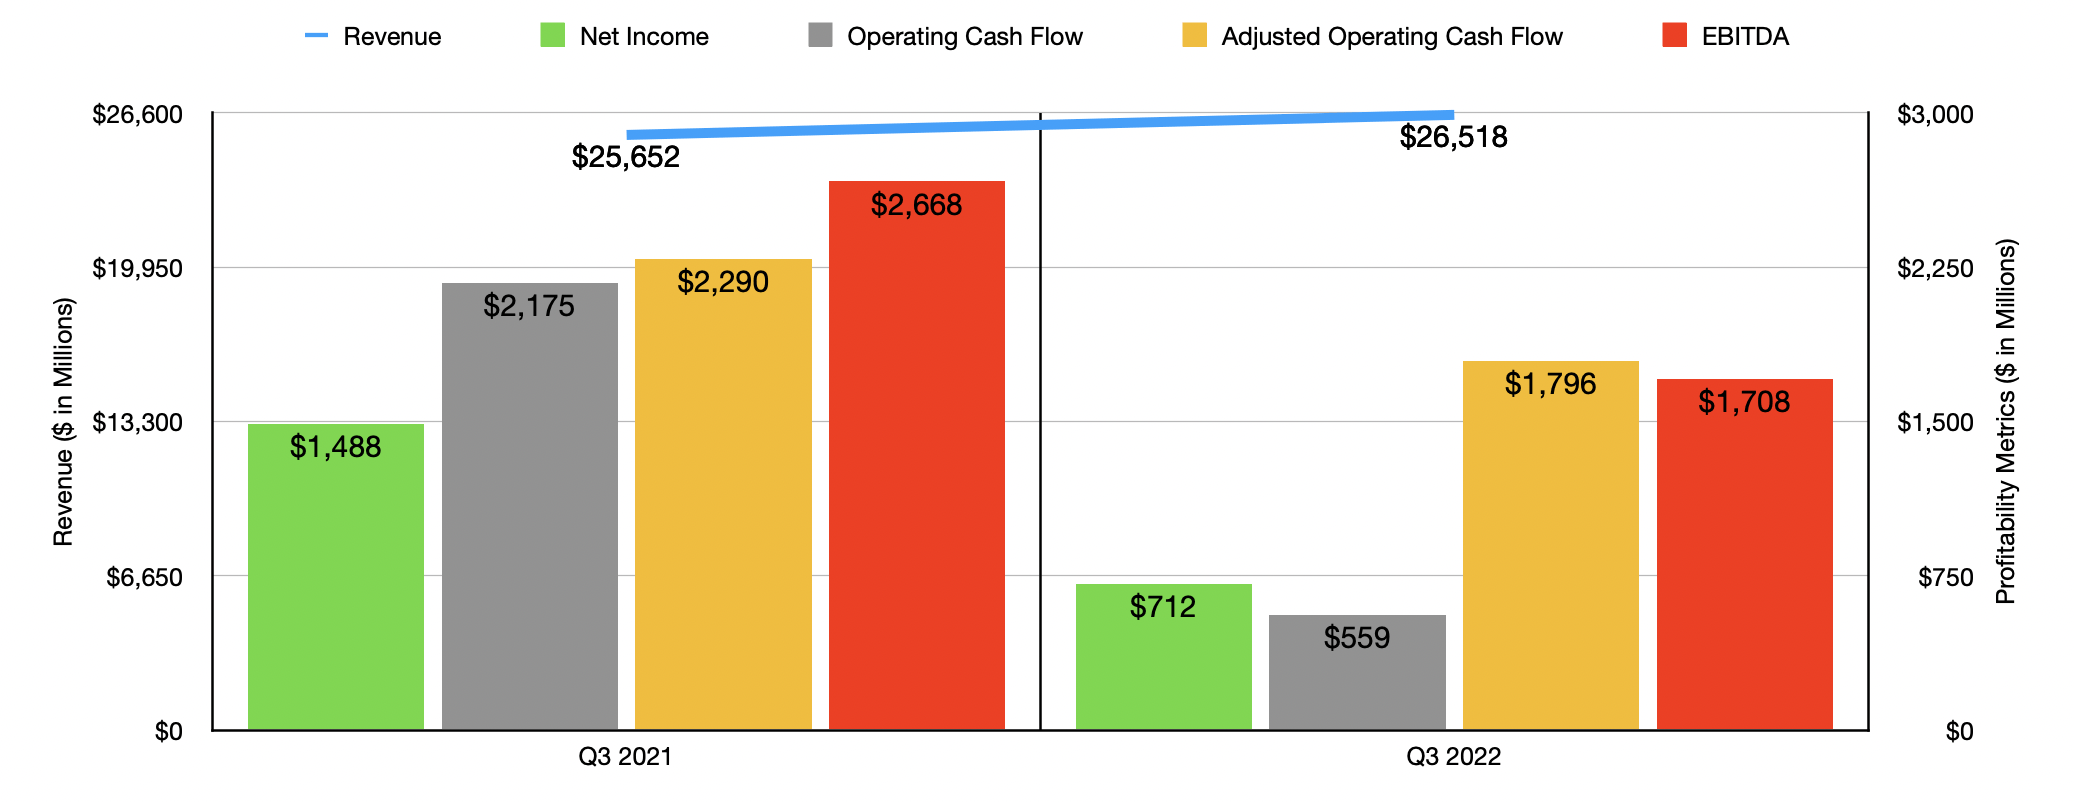
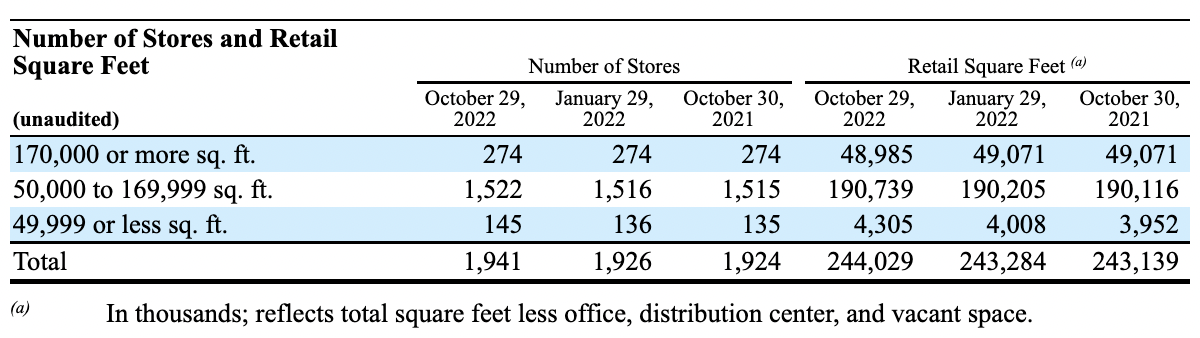
Things are not going particularly well for retail chain Target. Before the market opened on November 16th, the management team at the company announced financial results covering the third quarter of the company’s 2022 fiscal year. The first thing to note is that overall revenue for the quarter came in quite strong. Sales of $26.52 billion represented a 3.4% increase over the $25.65 billion reported the same time last year. In addition, this sales figure beat analysts’ expectations by $120 million. This was driven really by two key factors. First and foremost, the number of stores the company had in operation increased to 1,941. That represents a small rise over the 1,924 locations the company had in operation the same time last year. In addition to this, the company benefited from a 2.7% increase in comparable store sales. This, in turn, was driven by a 1.4% increase in the number of transactions at the company’s stores and a 1.3% rise in average transaction amount. Surprisingly, substantially all of the growth came from the company’s physical stores. Digitally originated comparable sales grew by only 0.3%, while for the physical stores that increase was 3.2%.
Target Target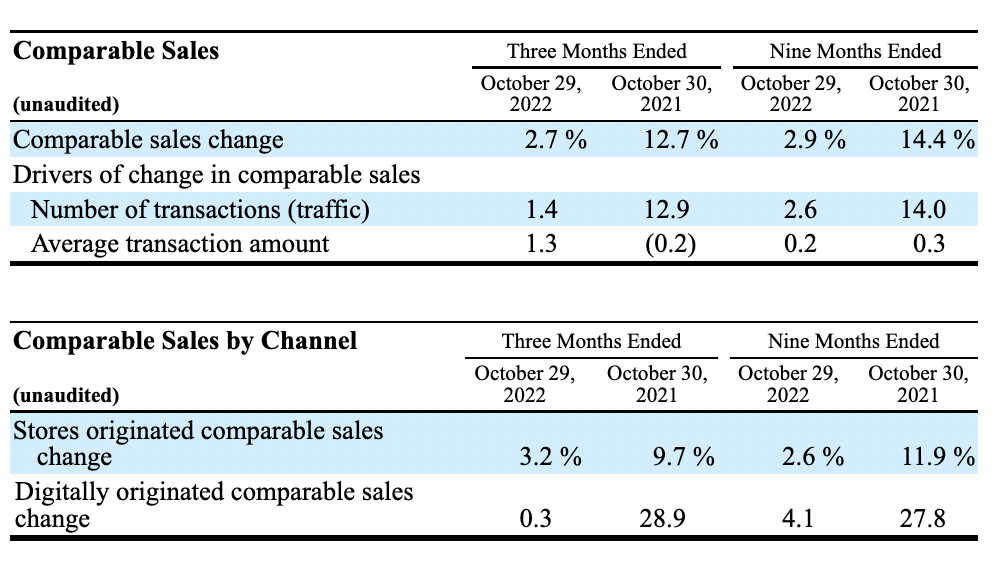
All of this is great to see. But sadly, this is where the good news comes to an end. Pretty much everything else reported during the quarter was disappointing. For starters, earnings per share came in at only $1.54. That’s down from the $3.04 per share reported the same quarter last year. It also missed expectations by $0.64 per share. This translates to net income of $712 million, compared to the $1.49 billion reported the same time last year. Despite sales rising, the company suffered from a substantial decline in the company’s gross profit margin. This fell from 28% to 24.7%. While this may not seem large, such a decline translates to missed bottom line results for the third quarter alone of $875.1 million on a pre-tax basis. This change was driven by multiple factors, including higher markdown rates, inventory shrinkage, rising merchandise and freight cost net of retail price increases, and more. Increased compensation and headcount in the company’s distribution centers, combined with the costs of managing early receipts of inventory, also played a role.
For this year as a whole so far, inventory shrinkage impacted earnings negatively to the tune of around $400 million compared to what the company saw last year. And for the year as a whole, management expects this number to grow to around $600 million, driven largely by, allegedly, organized retail crime. Also impacting the company’s bottom line was a rise in selling, general, and administrative expenses. This grew from 18.9% of sales to 19.7%, driven largely by cost inflation that includes hourly team member compensation. Naturally, all of this has impacted other bottom line results. Operating cash flow fell from $2.18 billion to $559 million. If we adjust for changes in working capital, it would have gone from $2.29 billion to just under $1.80 billion. Meanwhile, EBITDA has also declined, falling from $2.67 billion to $1.71 billion.
Author – SEC EDGAR Data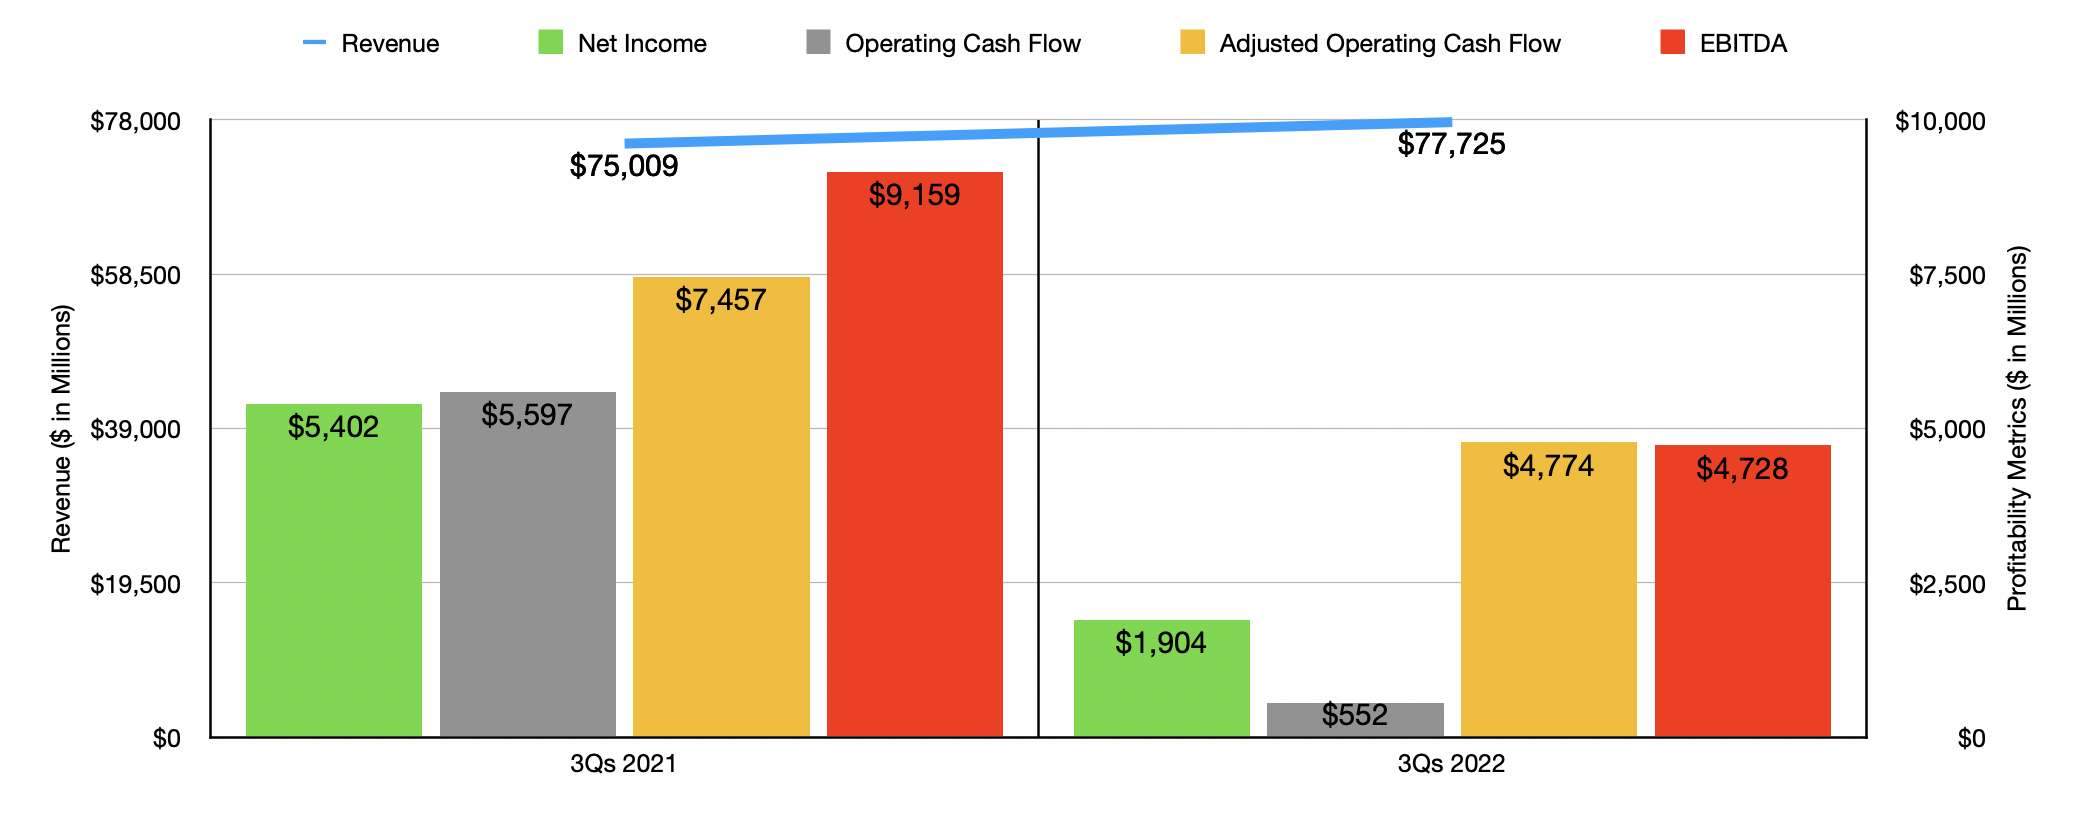
The results posted for the third quarter were not a one-time event. The company has experienced weakness this entire year on the bottom line. Although sales of $77.73 billion for the first nine months of the 2022 fiscal year beat out the $75.01 billion reported the same time last year, profits have fallen from $5.40 billion to $1.90 billion. Operating cash flow plunged from $5.60 billion to $552 million, while the adjusted figure dropped from $7.46 billion to $4.77 billion. Even EBITDA declined, falling by nearly half from $9.16 billion to $4.73 billion.
When it comes to the 2022 fiscal year in its entirety, we don’t honestly know what to expect. We do know that management said that the company might experience a low single-digit decline in comparable store sales in the fourth quarter of this year. This matches up with their rhetoric that, toward the end of the third quarter, the company experienced a softening in sales and profit trends that persisted into the month of November. The company is also forecasting that the operating margin rate for the enterprise should be around 3%. To put this in perspective, that number in the third quarter was 3.9%. So more likely than not, investors should anticipate a rather rough final quarter for the year. Another warning sign relates to the company’s inventory levels. In the latest quarter, inventory totaled $17.12 billion. This compares to the $14.96 billion reported in the third quarter of 2021 and is up from the $15.32 billion reported in the second quarter of this year.
If we annualize results experienced so far in 2022, we would expect net income for the company of $2.45 billion. Adjusted operating cash flow would be $6.45 billion and EBITDA would total $6.18 billion. These numbers would imply a forward price to earnings multiple of 29.3, a forward price to adjusted operating cash flow multiple of 11.1, and a forward EV to EBITDA multiple of 14.1. As you can see in the chart above though, these numbers are substantially higher than if we were operating with results that matched the 2021 fiscal year. Even a return to results achieved in 2020 would give us multiples of 16.4, 9.6, and 9.7, respectively.
Author – SEC EDGAR Data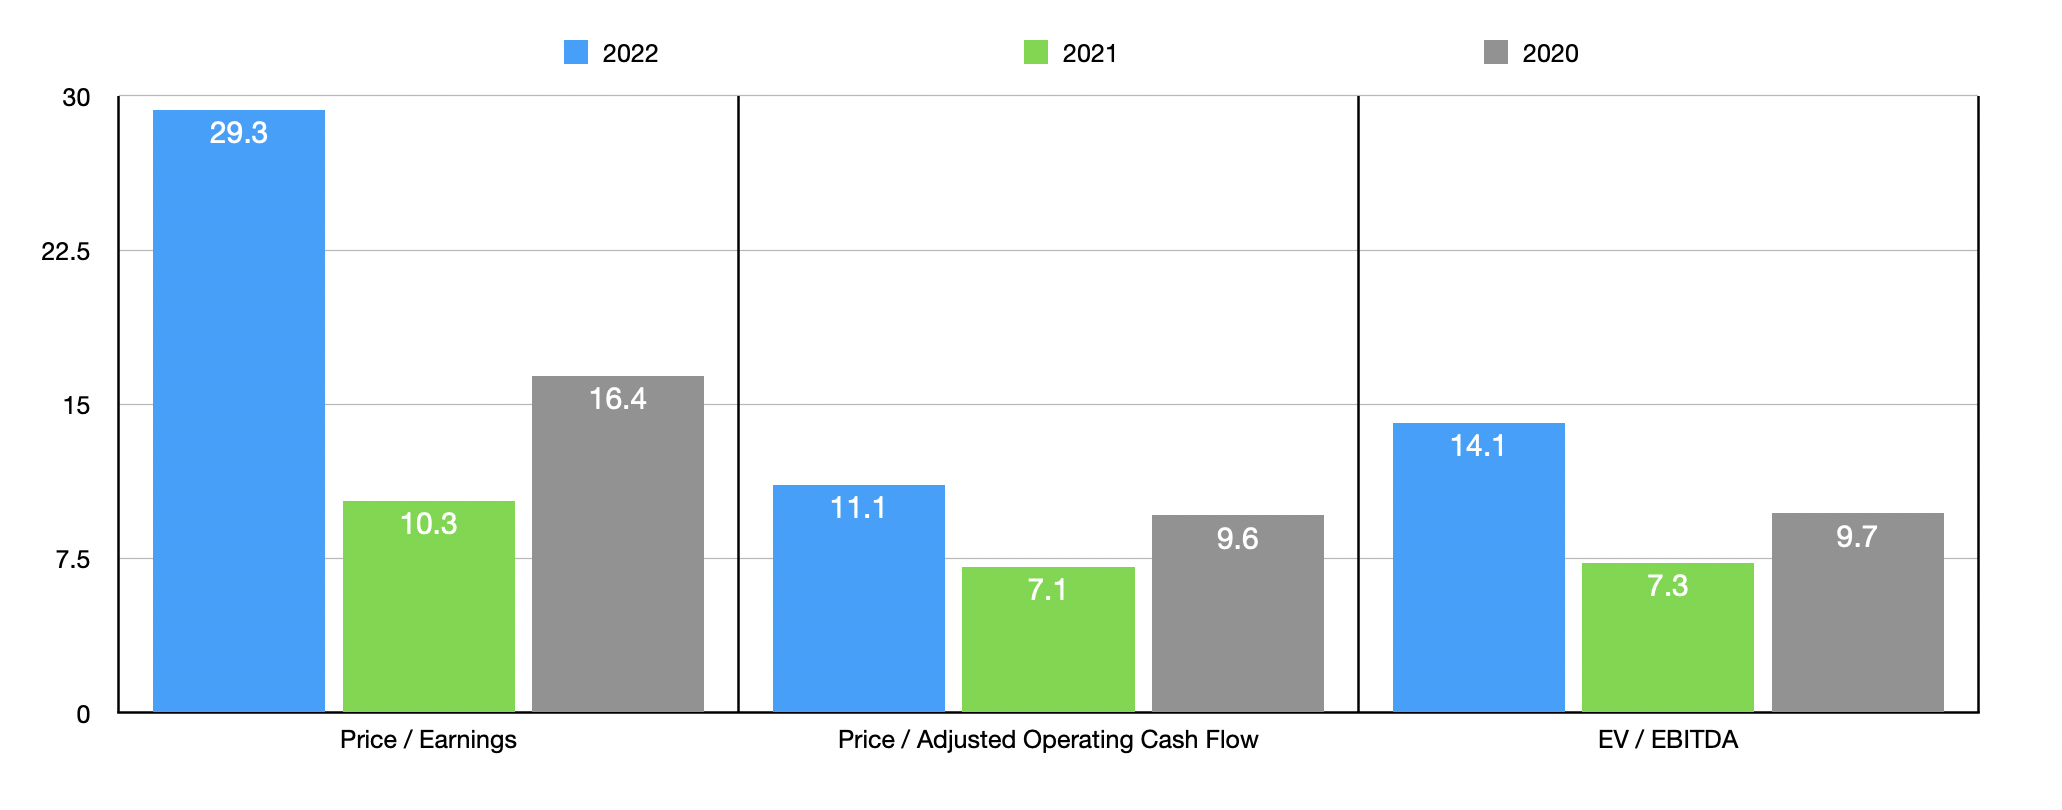
As part of my analysis, I decided to compare the company to five similar firms. But what I did was look at data through the lens of the 2020 fiscal year, recognizing that the 2021 fiscal year was unusually robust for Target and also recognizing that the projected figures for this year might also not represent a typical year for the company moving forward. On a price-to-earnings basis, these five companies ranged from a low of 8.4 to a high of 26.7. Using the EV to EBITDA approach, the range was from 4 to 13.5. In both of these scenarios, Target was the most expensive of the group. Meanwhile, using the price to operating cash flow approach, the range was from 2.8 to 13.4, with three of the five companies being cheaper than our prospect.
| Company | Price / Earnings | Price / Operating Cash Flow | EV / EBITDA |
| Target | 16.4 | 9.6 | 9.7 |
| Walmart (WMT) | 20.8 | 12.2 | 11.0 |
| Dollar General (DG) | 20.8 | 13.4 | 13.5 |
| Dollar Tree (DLTR) | 26.7 | 9.9 | 13.0 |
| The Kroger Co. (KR) | 8.4 | 3.9 | 4.4 |
| Albertsons (ACI) | 9.6 | 2.8 | 4.0 |
*All Using Results from 2020
Takeaway
Operationally speaking, things could definitely be going better than they are right now when it comes to Target. To make matters worse, it looks as though the situation will deteriorate further before it gets better. In the event that the company can return to results even achieved in 2020, I would make the case that shares might have some upside potential. But even in that context, shares of the company look to be on the pricey end of the scale compared to similar firms. Given all of these factors, particularly the potential for further deterioration, I have decided to rate the company a ‘hold’ for now.
Be the first to comment