

Courtney Hale/E+ via Getty Images
Investment Summary
We’ve been debating at lengths the best ways to allocate towards the diabetes management segment of medtech for months now. We are long-term holders of Insulet (PODD) and DexCom (DXCM) and believe these to be the leading players in the insulin pump space, with the Omnipod 5 collaboration, along with Medtronic’s (MDT) MiniMed device.
Tandem Diabetes Care, Inc (NASDAQ:TNDM) is also on our radar, but unfortunately doesn’t display the tight fit to our US equity strategy as DXCM and PODD do. I’d point out that TNDM manufactures insulin pumps and supplies and the differentiator is in its software. TNDM does not however manufacture its own continuous glucose monitor (“CGM”), instead, it integrates with DXCM’s CGM and additional software. With this in mind, along with the points laid out in this report, I rate TNDM a hold, and do not provide a price target on this basis.
TNDM Q2 earnings: growth trends mixed
The company came in with a mixed set of numbers with that missed guidance at the top and bottom-line. Despite this revenue of $200mm came from a shipment of 32,000 pumps for the quarter and was up 16% YoY. The upside was underscored by 40% YoY growth in the company’s installed base, now comprised of >265,000 customers in the U.S. alone. That saw recurring revenue attribute ~50% of overall turnover.
Geographically, U.S. sales stretched up by c.14% to $146mm driven by a 35% growth in supply sales. It shipped 21,000 pumps in the U.S. – flat YoY, partly driven by a high comps last year, but also seasonality trends faltering in the quarter. Per CFO Leigh Vosseller on the earnings call:
“Typically, we see pump demand build across the months within each quarter as well as in the quarters across the year. However, Q2 did not materialize in the same way as it has historically and that pressure continued through July. Our shipments this quarter grew sequentially from the first quarter by 12% despite increasing economic pressures as we exited the second quarter.”
Meanwhile, ex-US sales were up 23% to $55mm driven in part by the 110,000 currently installed user base. As seen in Exhibit 1, TNDM’s growth in shipments has been recognized across each quarter on a per-annum basis from FY17-date. From the seasonality trends seen below, volume appears to stretch up throughout the back end of the year. However, with the absence of this in Q2 FY22 I question if this trend will continue in tandem with previous periods for the company.
Exhibit 1.
Data: HB Insights Calculations, TNDM SEC Filings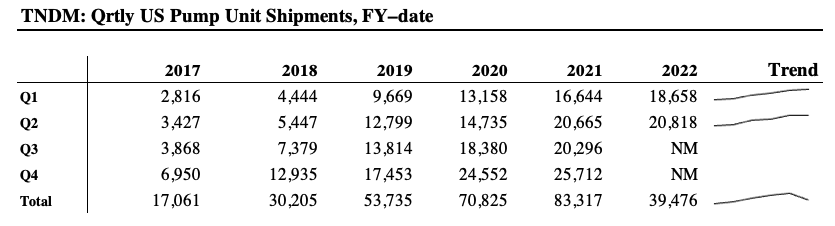
Softening fundamentals since FY21
As seen in Exhibit 2, the company’s quarterly operating performance has been lumpy from FY15 to date. Looking strictly at operating income and free cash flow (”FCF”), each has suffered a sequential decline over the past two quarters. Meanwhile, TTM FCF yields are negligible and don’t even surpass 100bps each period. What this tells me is that TNDM’s bottom-line fundamentals are weakening, and this reduces the fundamental momentum it can carry into the forward looking climate. That’s one of weakening economic growth and a higher cost of capital.
Exhibit 2. Softening operating income and FCF off high bases without the return on invested capital to back up
Note: All figures are in $mm or [%]. Free cash flow calculated as [NOPAT – investments]. FCF yield calculated as a function of enterprise value on TTM basis. (Data: HB Insights, TNDM SEC Filings)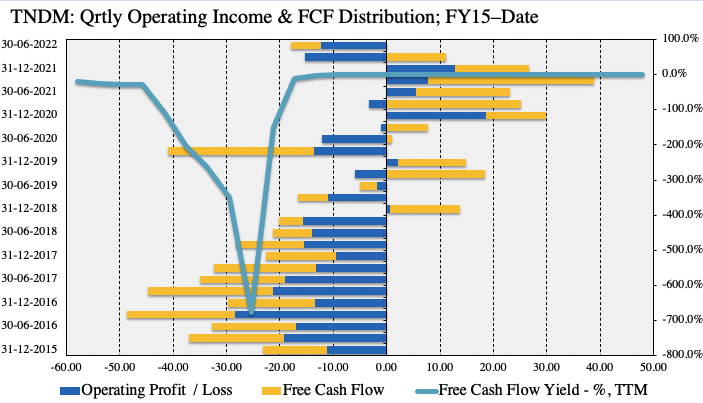
Similar trends are noticed at the operating level, as seen below. Inventory turnover has remained flat at ~4-4.5x since 2020, whereas accounts receivable turnover has payables turnover has narrowed sequentially to 9.3x in the same period. The average inventory days has come down by roughly 3 days to 78 days from Q2 FY21 to Q2 FY22.
Net-net, this has resulted in the cash conversion cycle settling slightly below pre-pandemic levels at 82 days. Whilst some these activity ratios have improved since the onset of COVID-19, most are still in-line with pre-pandemic numbers, and some are even worse off. This suggests to me there’s been no meaningful improvements here since the pandemic.
Exhibit 3. Whilst activity ratios have improved since FY20, they still remain in-line with pre-pandemic numbers.
- This indicates to me there’s been no meaningful change in working capital management or efficiency since before FY20.
- Some are even behind this period – accounts receivable turnover and inventory turnover in particular.
Note: All calculations are from GAAP earnings with no reconciliations. (Data: HB Insights, TNDM SEC Filings)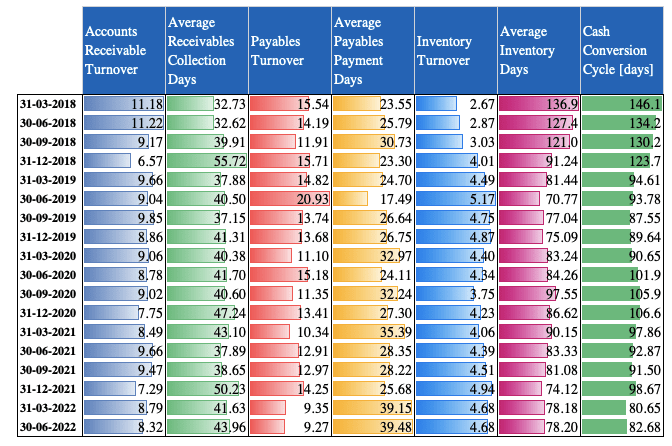
It’s therefore unsurprising to see management reduce FY22 sales guidance by 200bps to $845mm at the upper end, calling for 19-20% growth in worldwide sales.
Technical factors
With the stock trading sideways for such an extensive period in FY22 I wanted to gauge the market’s psychology behind it and understand what information can be obtained from price action. As seen in Exhibit 4, tracing the fibs down from the April high to the June bottom shows that TNDM has reclaimed about 38% of the downside move and is testing $85-$90 as shown.
I note the stock has already tested this mark and failed back in July/August, and has recently done so in early September as well. Should it break through the $90 mark on the Fibs I’d be looking to the next target of $100, however, if it rejects this mark once more I’d be anticipating further downside back to the June lows.
Exhibit 4. Rejected at the $90 mark 3x over the past 3 months
Data: Refinitiv Eikon, HB Insights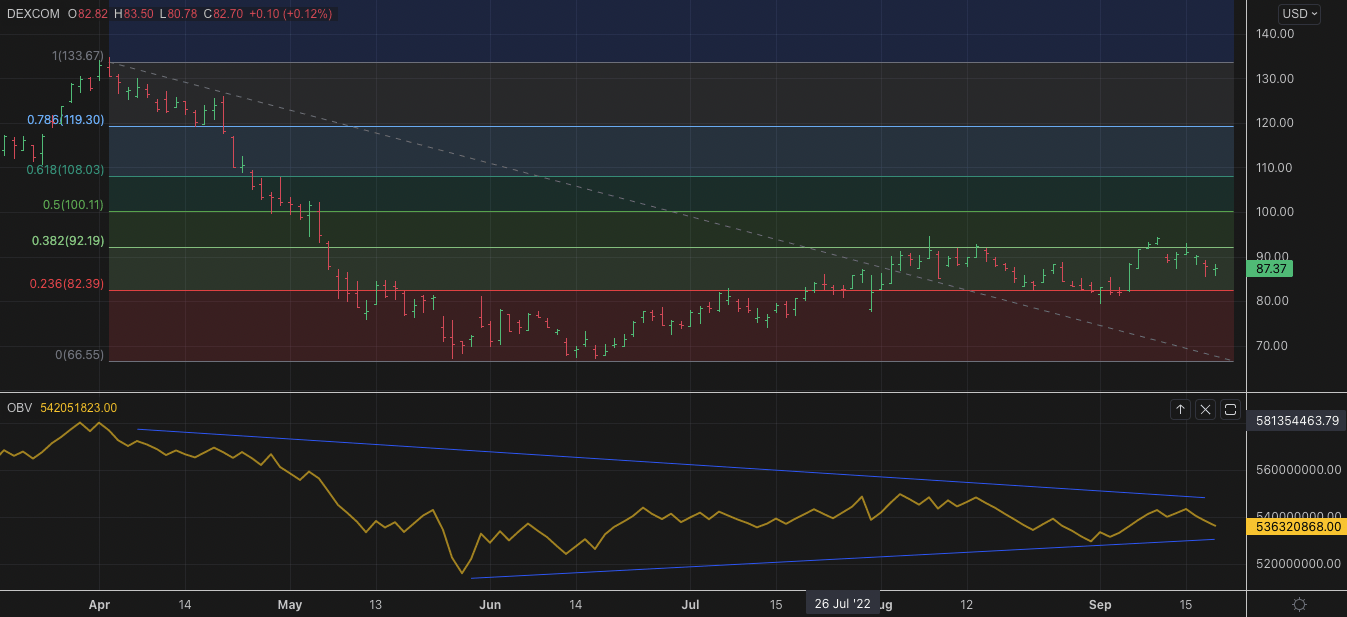
Long-term trend indicators are unsupportive of a breakout, with momentum and on balance volume pushing lower in continuation of a downtrend that’s been in situ since April.
Exhibit 5. Long-term trend indicators continue to head south
Data: Refinitiv Eikon, HB Insights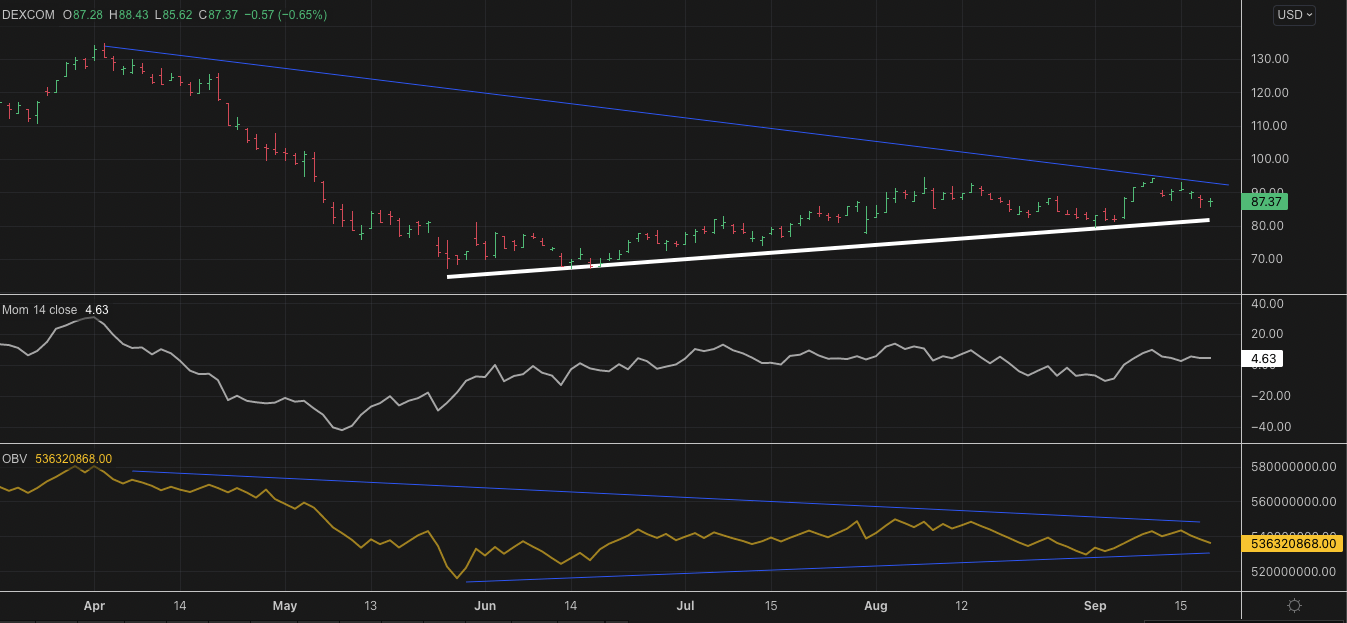
Valuation and conclusion
Shares are richly priced relative to peers in the GICS industry peer group. Trading at 7.9x book value and almost 4.9x sales are substantial premium’s to peers, whilst the company’s return on equity lags. Moreover, the c.3.9% TNDM realizes on a TTM basis reduces to just 0.5% at a 7.9x book value multiple. These are unattractive and in reality keep me on the sidelines in combination with the points above. I’m not prepared to pay nearly 8x book value for unpredictable free cash flows that have been dwindling, much less the lack in profitability.
Exhibit 6. Multiples and comps
Data: HB Insights, Refinitiv Datastream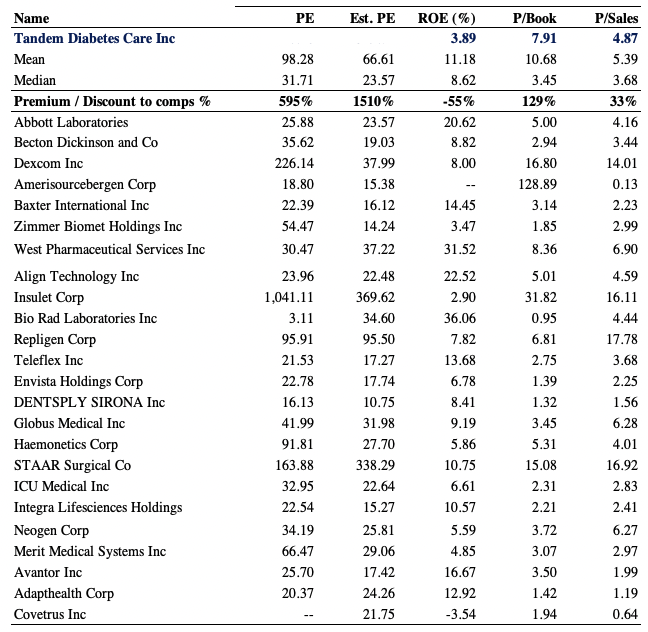
Net-net, with more compelling value in the wider diabetes management space, more so in the insulin pumps universe, I rate TNDM a hold. With softening bottom-line fundamentals and valuations sitting well above more exciting peers in the industry, there’s really a lack of flesh to put on the skeleton with TNDM at present, in my estimation. I’m keeping a close eye on the name and its numbers going forward, but the opportunity cost of allocating over more compelling names, as mentioned, is far too great right now. Rate hold.
Be the first to comment