

Darren415
This article was first released to Systematic Income subscribers and free trials on Sep. 13.
Mortgage REIT AGNC Investment Corp. (NASDAQ:AGNC) has recently issued a new preferred – the 7.75% Treasury Reset Series G with a temporary ticker (AGCGV) and permanent ticker (NASDAQ:AGNCL). The issuance has fueled speculation of a possible redemption of (AGNCN) which will become redeemable in mid-October – a possibility we highlighted earlier.
In this article, we discuss the new preferred in the context of the broader AGNC 5-preferred suite. We also use this issuance to illustrate how income investors may want to go about gauging relative value in a preferreds suite of a single issuer.
The Big Picture
Mortgage REITs have had a tough time this year due to the sharp rise in the MBS basis i.e., the underperformance in agency MBS securities relative to Treasuries. Some investors think that the pain in the agency MBS sector has been due to the back-up in rates but that’s not actually the case as we point out here.
The mortgage REIT sector, as proxied by the iShares Mortgage Real Estate ETF (REM) has delivered around a -15% return which puts it at the bottom end of the broader income space. The agency-focused and hybrid-focused mREIT preferreds sectors have outperformed their common equity counterparts. For instance, the agency-focused preferreds space which includes issuers like AGNC, NLY, DX, ARR, IVR has delivered a stronger return of -9% which is not amazing but it’s certainly better than what the common shares have done. Some preferreds (AGNCN, NLY.PF) are even in the green for the year.
Systematic Income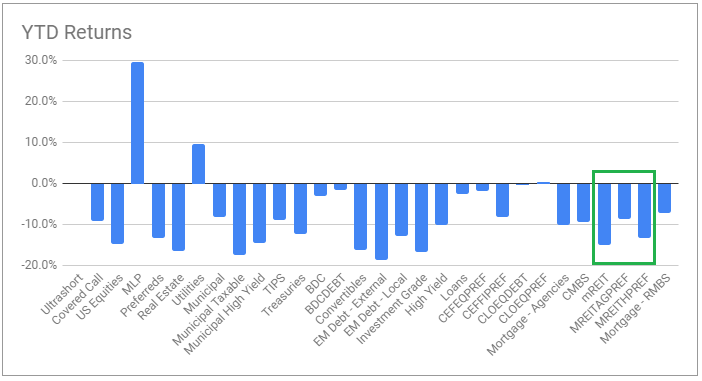
Our own allocation approach in the mREIT space has focused exclusively on the preferreds not only due to their greater resilience relative to the common shares but also very attractive yields and a more stable dividend base.
Specifically, while the longer-term drop in mREIT book values has caused dividends to move lower on common shares, the preferred shares have a stated dividend which has to be paid out on the “par” amount (barring a dividend suspension). For instance, while the AGNC common dividend has moved consistently lower as the book value has fallen, this is not something that can happen to preferred stocks.
Total returns have also tended to favor preferred stocks due to the same dynamic which has hurt common dividends – the historic deflation in book value. For instance, this is what a comparison of the AGNC common vs. its preferreds looks like.
Systematic Income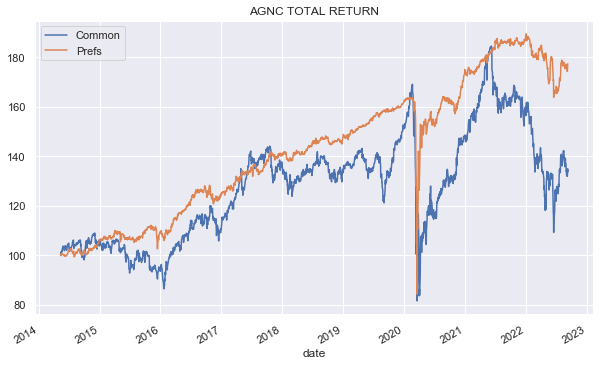
In short, the preferreds have delivered double the return of the common over the last nearly 10 years. This is not to say that some investors can’t have great success trading the common; however, in our view, they are less suitable from a pure buy-and-hold income perspective.
Systematic Income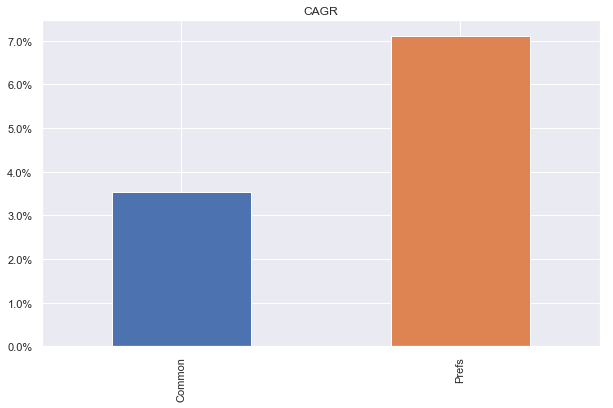
In the agency-focused mortgage REIT space, we have tended to favor NLY and DX preferreds over their AGNC counterparts. That said, AGNC preferreds are still worth a look from the perspective of diversification as well as uncommon coupon profiles (such as the soon-to-float AGNCN as well as the new Treasury-linked AGCGV). In the section below, we discuss the new preferred in the context of the broader AGNC preferreds suite.
The New AGNC Preferred
Last week AGNC issued Series G with a temporary ticker AGCGV and a permanent ticker AGNCL. The stock has a 7.75% coupon until 15-Oct-2027 at which point it switches to a floating-rate coupon of 5Y Treasury Yield + 4.39%, which resets every 5 years, unless redeemed.
AGNCL will be the first agency-focused Treasury-linked preferred and the third Treasury-linked mREIT preferred. In the hybrid mREIT preferred subsector (RITM.PD) and (EFC.PB) also have 5Y Treasury-linked coupons.
This is how all of the AGNC preferreds stack up:
Systematic Income Preferreds Tool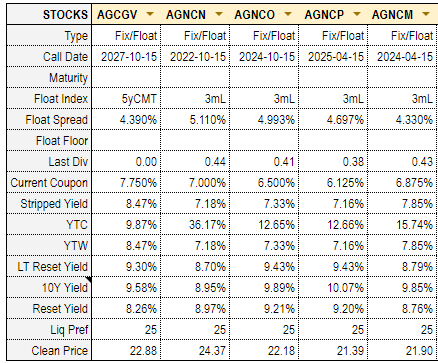
To quickly sum up – all the series are fixed for an initial period and then turn into floating-rate securities. One of these [AGNCN] is nearly floating as its non-call period is coming to an end in mid-October at which point its coupon will switch to 3M Libor + 5.11% unless it’s redeemed. Three others have later call / floating dates.
The newest AGCGV has a fixed coupon until 2027 (the typical 5-year non-call period) at which point its coupon converts to a 5Y Treasury yield + 4.39% with the 5Y Treasury yield resetting every 5 years. For investors confused about how often the floating part of the coupon resets, it happens in line with the term of the floating index i.e., the stock with the 3M Libor coupon resets every 3 months and the stock with the 5Y Treasury yield coupon resets every 5 years.
In the next section, we discuss how investors can go about gauging relative value in the suite.
Gauging Relative Value In A Preferred Suite
It’s important to say at the outset that gauging relative value in a suite of preferreds is far from trivial. This is particularly the case for a company like AGNC which has a lot of outstanding preferreds and which have very different coupon profiles as highlighted above.
For investors to gauge relative value, they need to not only know the current pricing of all the stocks but also have a view on whether the stocks will be redeemed. They also need to have a view on what different interest rates will do, in the case of AGNC, what 3M Libor and 5Y Treasury yields will do relative to each other.
It’s also important to say that it’s common for there to be no single “best” stock within the suite for all investors despite the frequent table-banging by various analysts. This is because investors will have different views on the path of interest rates and likelihood of redemption and they will have different coupon diversification needs, preferring say a Treasury-linked security over a Libor one due to their relative scarcity.
One approach that we come across now and again is a kind of price-differential approach that looks at series with a similar coupon profile and then compares the difference in their current prices to see if it is justified based on the coupon differential. For example, if one series floats soon at Libor + 6% and another floats at the same rate in two years, investors can just compare the difference in their fixed coupons over two years versus their current price differential.
This approach is intuitive but in reality it’s a kind of analytical cul-de-sac for the simple reason that few series of the same issuer have very similar floating coupons which greatly limits its usefulness. Other more theoretical problems with this approach is that it ignores the time value of money and the yield-to-call.
A better approach is to compare all the series at once on the same basis across two scenarios – the scenario in which the stocks remain outstanding and the scenario in which they are redeemed at a certain point.
Looking at the first i.e., non-redemption scenario we can plot the following chart of forward yields. These are what the yields of the various series will be based on current prices and forward rates. The black dot shows the time when the given stock’s first call date is. At that point it switches to a floating-rate from a fixed rate (which is why the line starts to wiggle after the dot).
Systematic Income Preferreds Tool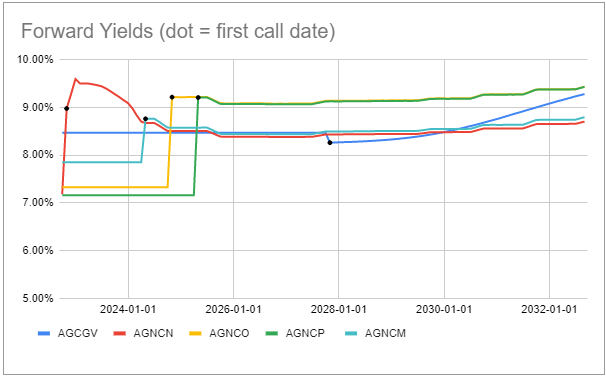
A forward rate is the future path of a given interest rate, be it 3M Libor, 5Y Treasury yield etc., that is priced in by the market today. For example, the chart below shows that the 3M Libor is expected to rise to a bit above 4%, then descend back down to about 3% and remain there for a long while. It’s important to highlight that it’s unlikely these forward rates will be realized but they are useful because they provide a fair-value basis for gauging future yields. For instance, investors who were gauging the future yield of AGNCN in early 2022 on the basis of a near-zero Libor rather than the much higher forward Libor rate may have been surprised by how high the stock’s yield will be when it floats in a month’s time. Ultimately, investors should have their own view of what rates will do but using forward rates is a good first step.
Systematic Income Preferreds Tool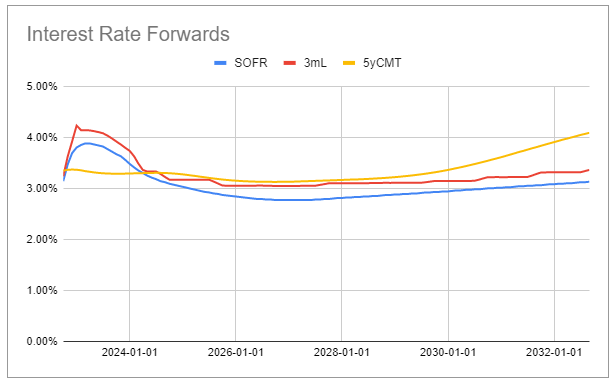
Let’s look at the non-redemption forward yield chart again. What we see is that the yield of AGNCN will be the highest for about a year and a half (once it floats in October) after which it will be taken over by (NASDAQ:AGNCM) and then by (NASDAQ:AGNCO) and (NASDAQ:AGNCP). The yield of AGNCN will then move to the lowest level (only AGCGV will have the lowest yield for about 2 years in 2028-2030). We also see that the yield of AGNCO and AGNCP will be the lowest for about 2 years at which point they will move to being the highest.
Systematic Income Preferreds Tool
The forward yield profile of the new AGCGV is interesting. It is in second place for about a year and a half at which point it moves to being one of the worst. However starting around 2028 it zooms up and will dominate the other stocks by around 2034.
In short, in the non-redemption scenario for investors with a very long-term horizon AGCGV is actually the best-looking stock – it has a decent yield over the next decade and then slowly moves to the highest yield level. For investors with a shorter-term horizon or those more tactically-minded, AGNCN looks good given its big yield superiority over the next year-and-a-half. It’s quite likely its big yield advantage in the near term could push up its price even higher by low information investors at which point informed investors can rotate into another series. Finally, for investors with a medium-term outlook AGNCO looks pretty good – its yield is second worst for a couple of years but then the highest for about a decade until it loses out to AGCGV.
Now we also need to look at the redemption scenario for the suite. To gauge value here we look at what we call forward call yields. Some investors simply look to the lowest priced stock to gauge yield-to-call however this is not foolproof because a stock could be redeemed at any point down the line rather than immediately. This means that the later the call the less its current price matters and the more the coupon that is paid out over the non-call period matters.
The chart below shows the yields-to-call assuming the call happens as of a given date. The lines for each series start on the first call date. On this basis, AGNCM, AGNCP and AGNCO look best. This chart is useful for investors who are upbeat about AGNC fundamentals since an improving credit profile should allow AGNC to refinance its preferreds at better interest rates in which scenario it will keep redeeming the currently outstanding preferreds.
Systematic Income Preferreds Tool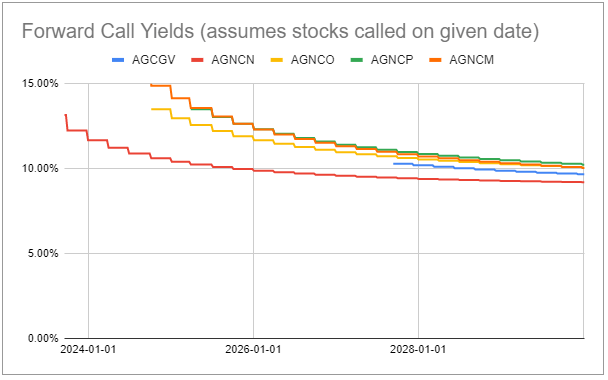
Stance and Takeaways
One key takeaway from this exercise is that the current pricing across the AGNC preferreds suite is not obviously dumb. Stocks with the highest yields over the near term like AGNCN tend to have the lowest yields later on and vice-versa, which equalizes yields more-or-less over the longer period. Also, the stocks with the highest yields-to-call over the near term are also much less likely to be redeemed over the near term (because they have the lowest yields in the near term).
Our view is somewhat nuanced across the suite. We see value in AGNCN which will float first and pop out to the highest yield (unless redeemed). The fact that it will be immediately redeemable should also anchor the stock somewhat in case we see another market downdraft. We could also easily see the stock bid up by yield-chasing investors leading to further capital gains.
We also see value in AGNCO which has a relatively low yield for a couple of years but then dominates the suite over the longer term. Just as AGNCN outperformed sharply this year we could see interest move to AGNCO eventually.
Finally, we see value in the new AGCGV which is appealing for two diversification reasons. Because it has a long fixed-rate period it can easily boast the highest yield if short-term rates don’t perform as expected and the economy hits a big bump which then causes inflation to move much lower, in turn causing the Fed to reverse its recent interest rate hikes. This will cause the other series to underperform as their earlier floating-rate coupons will move lower relative to AGCGV.
The second appealing aspect of AGCGV is that it is the only one in the suite that has a coupon linked to the 5Y Treasury yield. Historically, Treasury yields have tended to trade significantly higher above Libor. The yield curve (3M / 5Y) is currently very flat (see chart below) and the market is pricing in a very flat yield environment (compare red and yield lines in the Forward Rate chart above). If the yield curve instead normalizes much more quickly in line with its historic level, AGCGV will outperform as the 5Y Treasury yield rises above 3M Libor (or its eventual replacement SOFR).
Systematic Income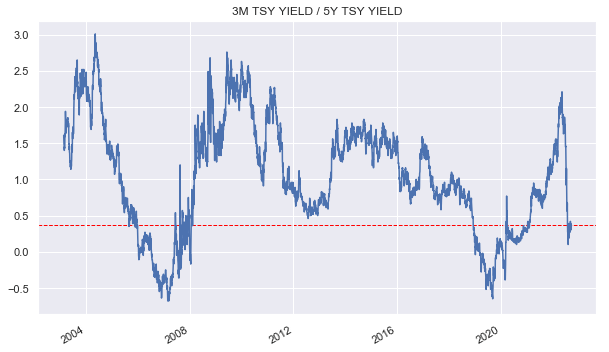
Be the first to comment