Since we launched our marketplace service recently, many readers and members have asked about the key differences between our portfolio strategy and the more “traditional” strategies like the 40-60 strategy. The reasons are multifold. For example, the 40-60 allocation does not make sense under the current market with low bond rates. Furthermore, the combination of traditional wisdom of a 4% or 5% withdrawal rate and a 60-40 portfolio has a good chance of running out of money if you are looking at a timeframe of more than 20 years. These discussions are detailed in our blog article here if you are interested.
This article uses the SPDR S&P 500 Trust ETF (NYSEARCA:SPY) and Vanguard Intermediate-Term Treasury ETF (NASDAQ:VGIT) to explain the main reason. You will see that:
The 40-60 fixed allocation (or any fixed allocation) does not make intuitive sense to us. Fixed allocation strategies work most of the time, but miss extreme market opportunities – which matter the most.
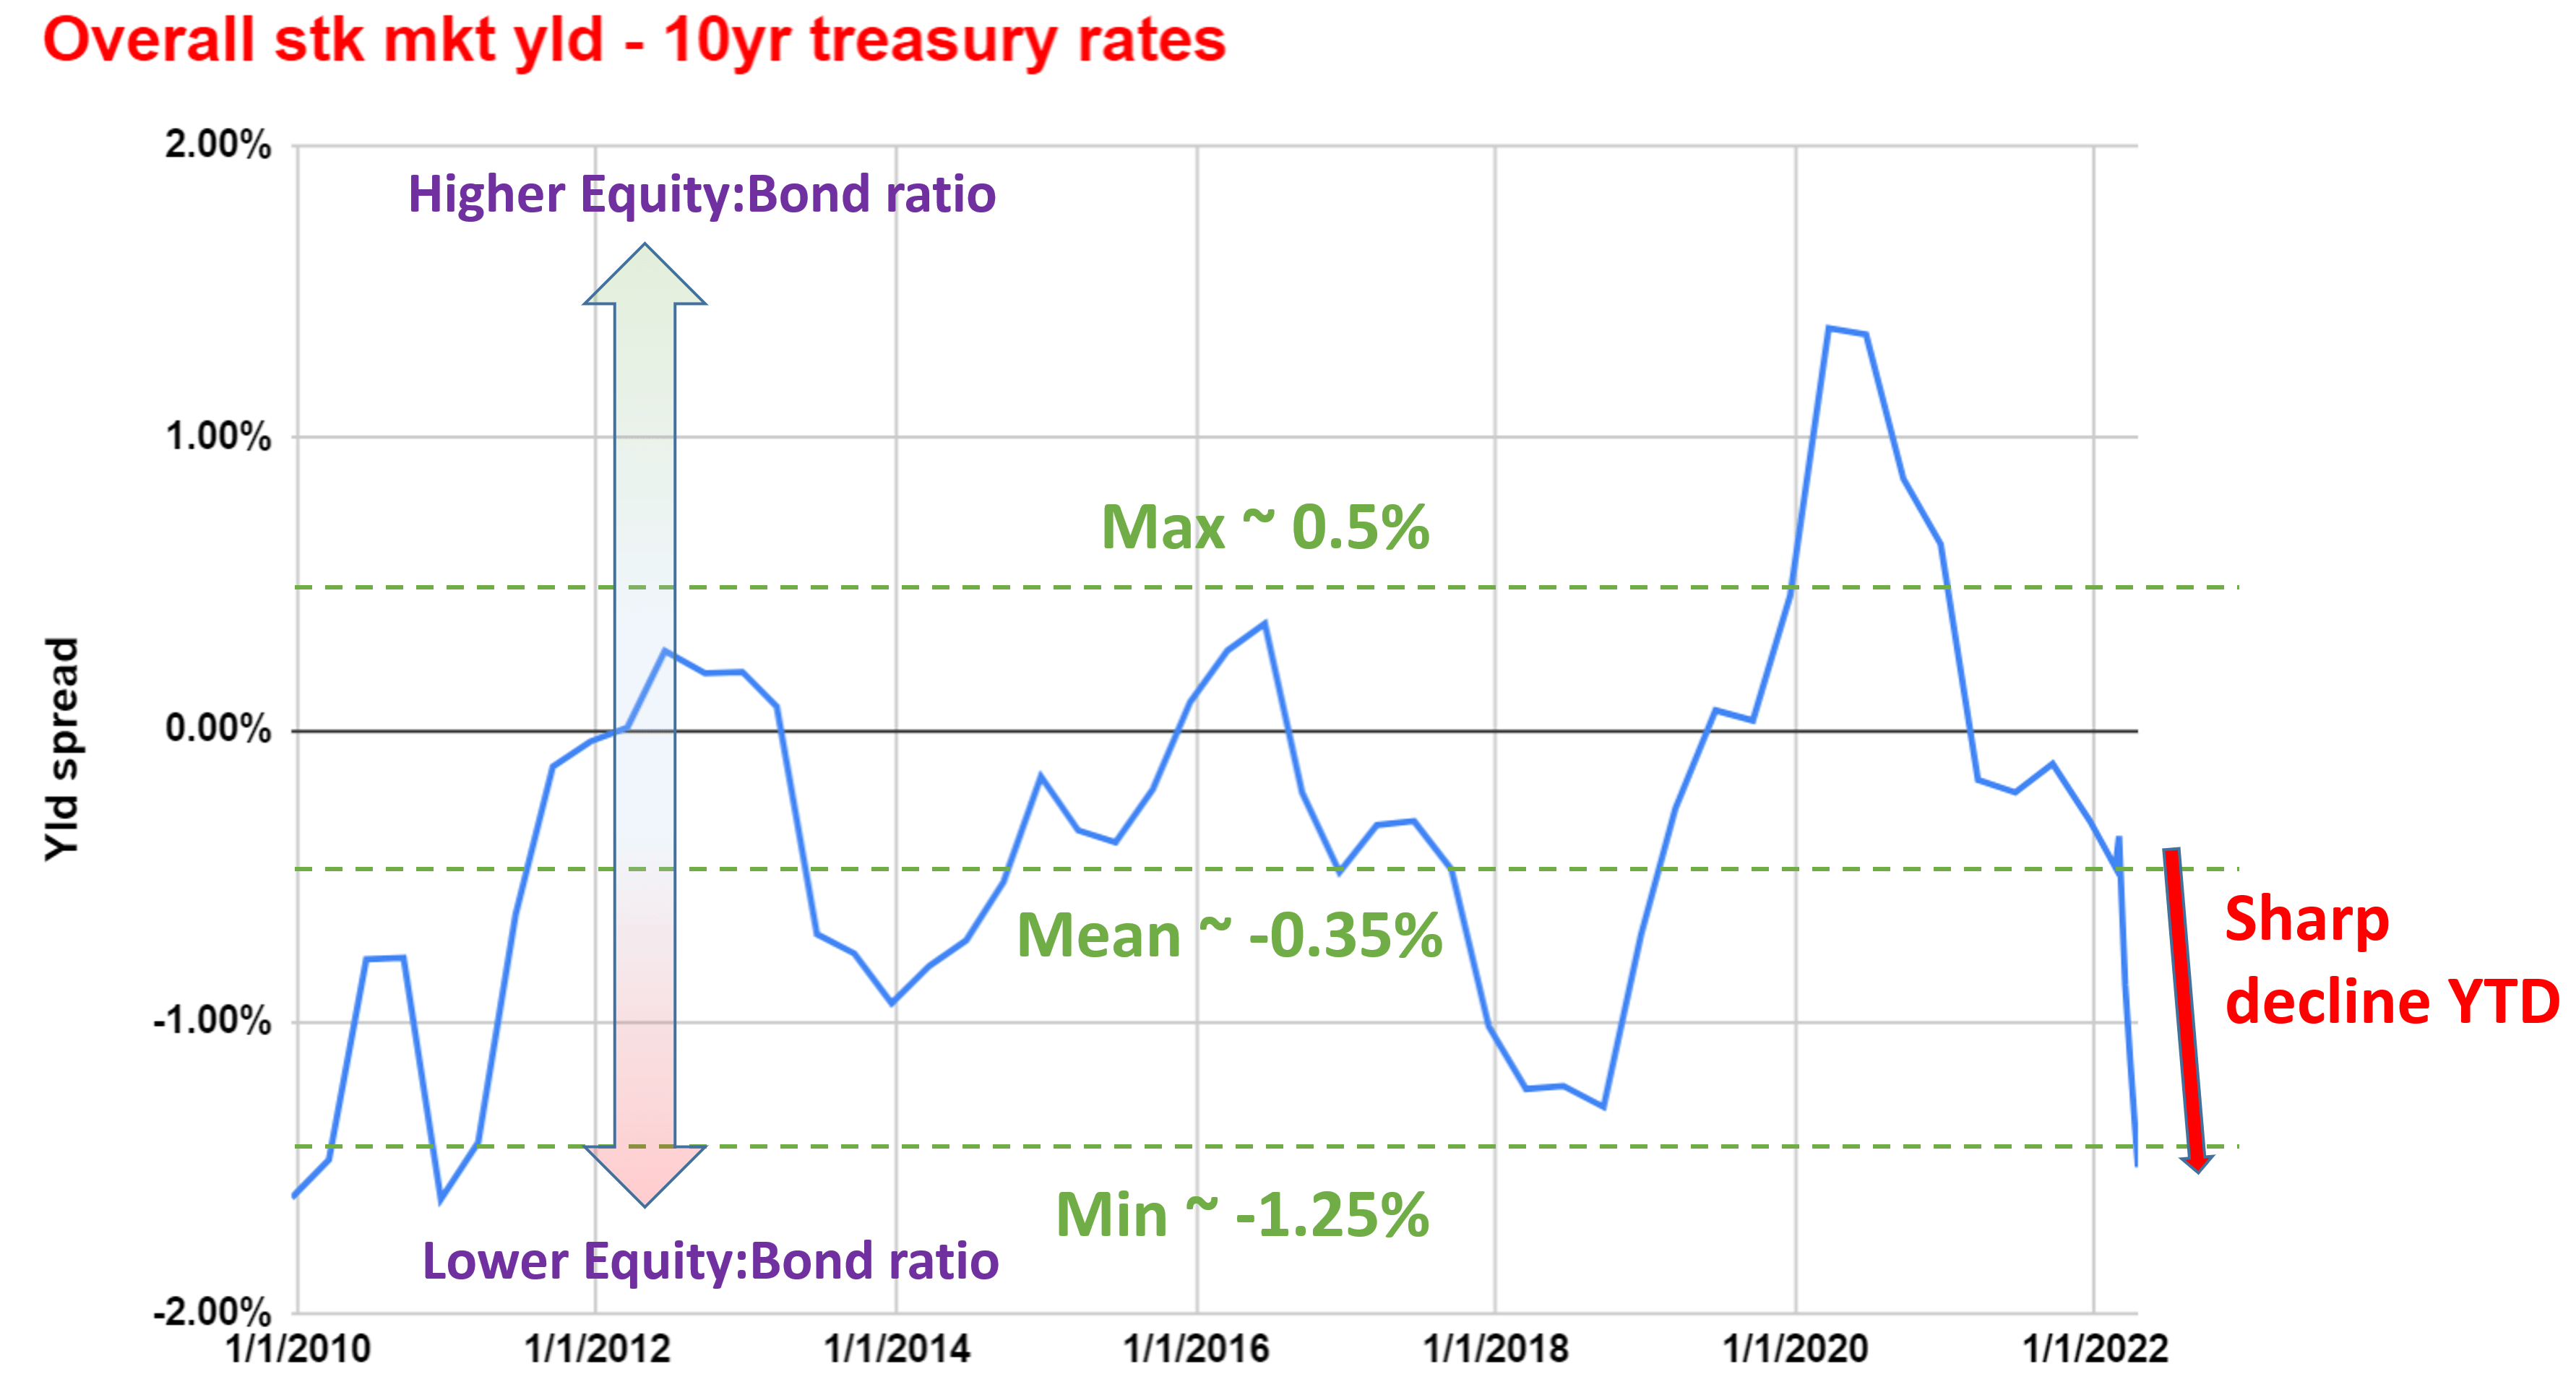
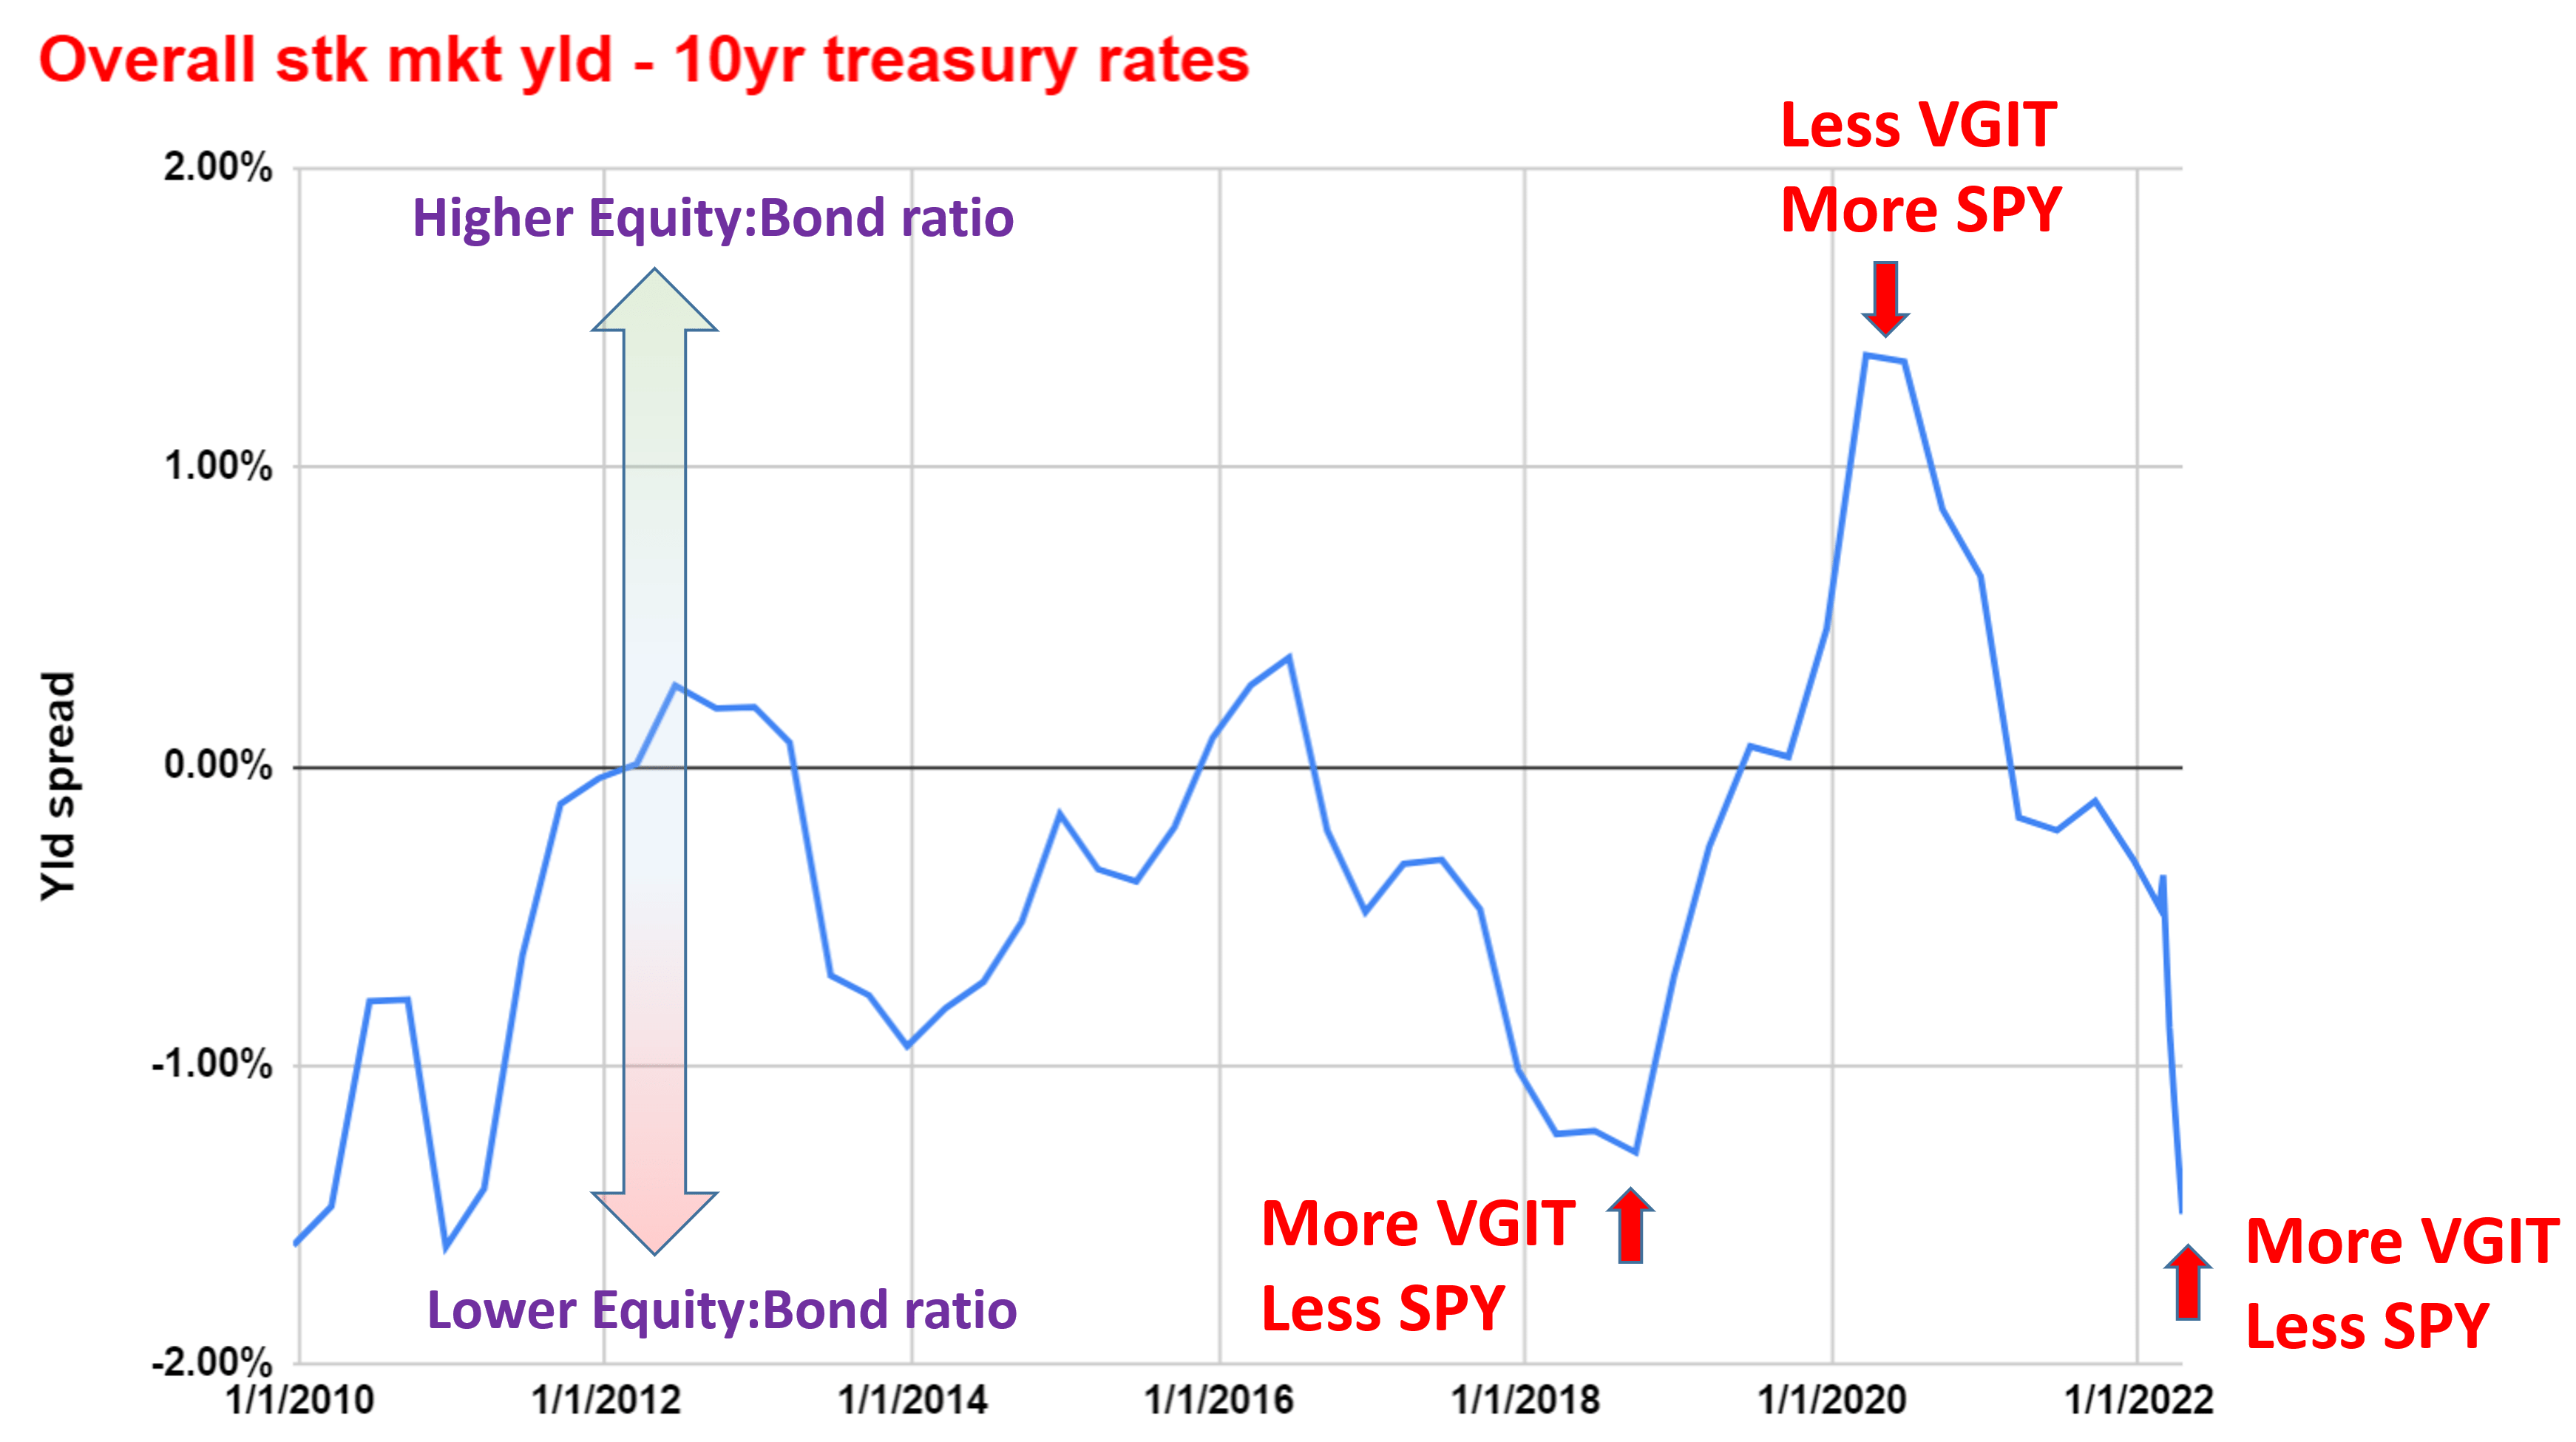
Our above assessment is mainly based on the yield spread between the equity market and treasury rates as you can see from the chart below. We ourselves use a Google sheet to track such yield spread. Feel free to download or export it via the following link too: Market Sector Dashboard.
You can see the yield spread declined sharply since the beginning of this year to a record low in a decade. If you apply the fixed 40-60 allocation method, you will suffer a sizable loss as to be detailed later. But a dynamic allocation method can mitigate a large part of the losses or even help you to benefit from such large underlying movements.
Author
SPY and VGIT: Basic Information
SPY probably is a fund that needs no introduction. With an AUM of more than $400B, it is one of the largest S&P 500 ETF funds and also one of the most liquid funds. It charges a low expense ratio of 0.09%. The expense ratio might be a bit higher than some of its competing funds such as VOO or VTI. But its tradability and liquidity certainly make it up for more active investors.
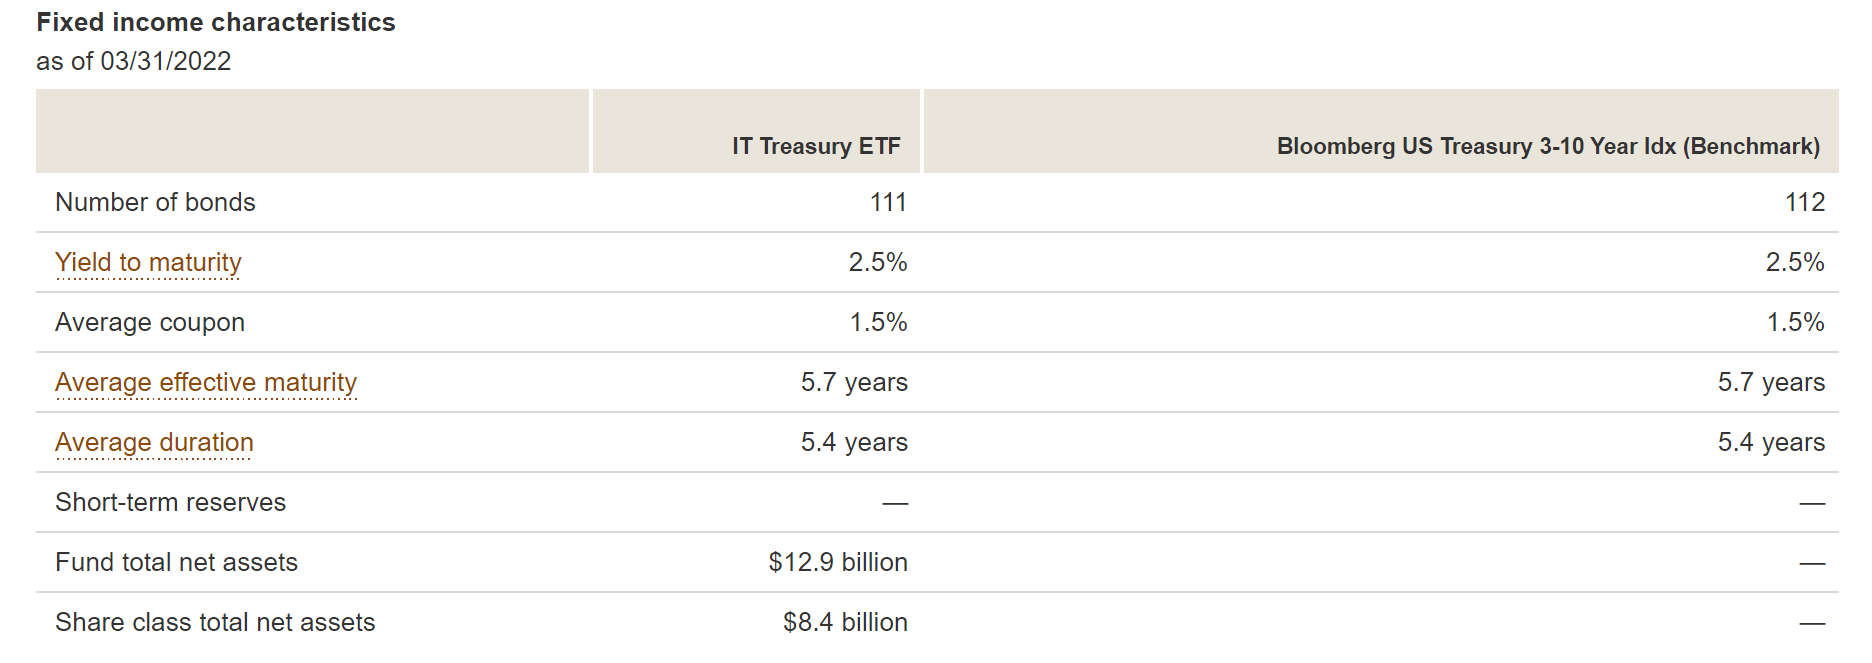
The next chart shows the details of the VGIT fund. As the name suggests, it holds a collection of intermediate-term Treasury bonds. The average effective maturity is about 5.7 years, and 99.9% of its assets are invested in US Treasury bonds.
Vanguard fund information
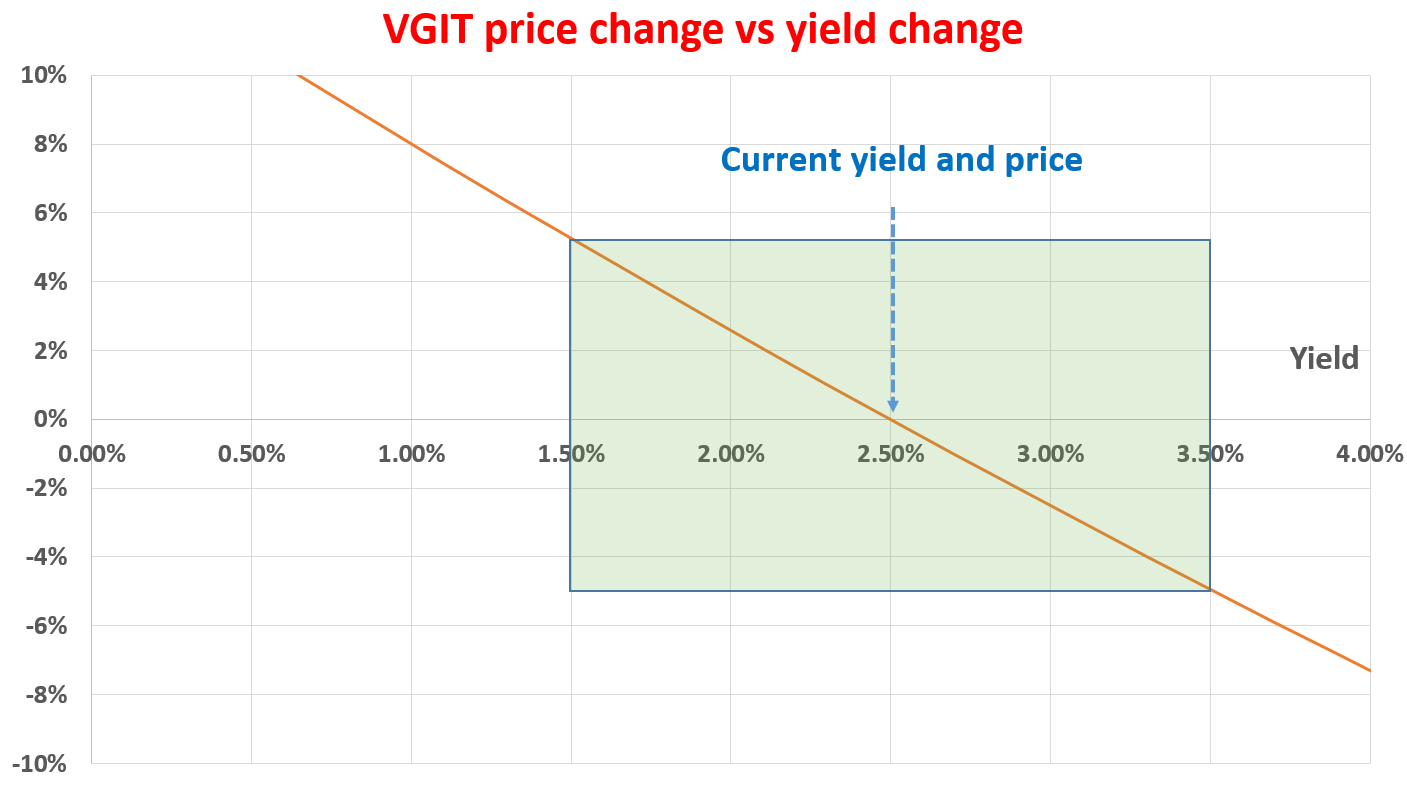
The price of a bond goes up when its yield goes down and vice versa. And a primary driving force for bond yield is the interest rate. The effective duration is a quick (but reasonably accurate) way of estimating the price change of a bond fund as a function of yield as you can see from the chart below. When the yield rises by 1% (e.g., caused by a 1% interest rate hike), the price of a bond decreases approximately by its effective duration in percentages. So in the example of VGIT, its price will drop by about 5.7%. And vice versa.
Author
How Does Dynamic Allocation Work?
For readers familiar with our writing, you already know that our view is that valuation always needs to be interpreted under the context of something. The risk-free rates and the yield spread against the risk-free rates serve as one such timeless context. Details of the calculation and application of the yield spread have been provided in our earlier article. In particular,
Simplicity – yield spread only relies on the most simple and reliable data points (treasury rates and dividends). In investing, we always prefer a simpler method that relies on fewer and unambiguous data points rather than a more complicated method that depends on more ambiguous data points.
Its timeless intuition – no matter how times change, the risk-free rate serves as the gravity on all asset valuations and consequently, the spread ALWAYS provides a measurement of the risk premium investors are paying relative to risk-free rates. A large spread provides a higher margin of safety and vice versa.
Based on this concept, our concept of dynamic allocation is pretty straightforward. When the yield spread of the equity market is significantly above the historical, we would sell bonds to buy high-quality equity funds such as SPY, and vice versa. The following two charts illustrate a simple dynamic allocation and the benefits of such a dynamic strategy.
As an example, the chart below illustrates that during early 2018, the yield spread is far below the historical average. And therefore, we would like to hold more bonds such as VGIT than SPY (more than the 40-60 template tells us). As another example, during early 2020, the 10-year treasury rate dropped below 1% and the yield spread surged far above the historical average. And that is time we would like to hold less VGIT and more SPY.
Currently, as you can see, recent bond rate surges pushed the yield spread to a record low in a decade and created opportunities for such dynamic allocation again. Next, we will illustrate specifically how you can use SPY and VGIT for such dynamics trade and generate alpha.
Author
Dynamic Allocation And Alpha Generation
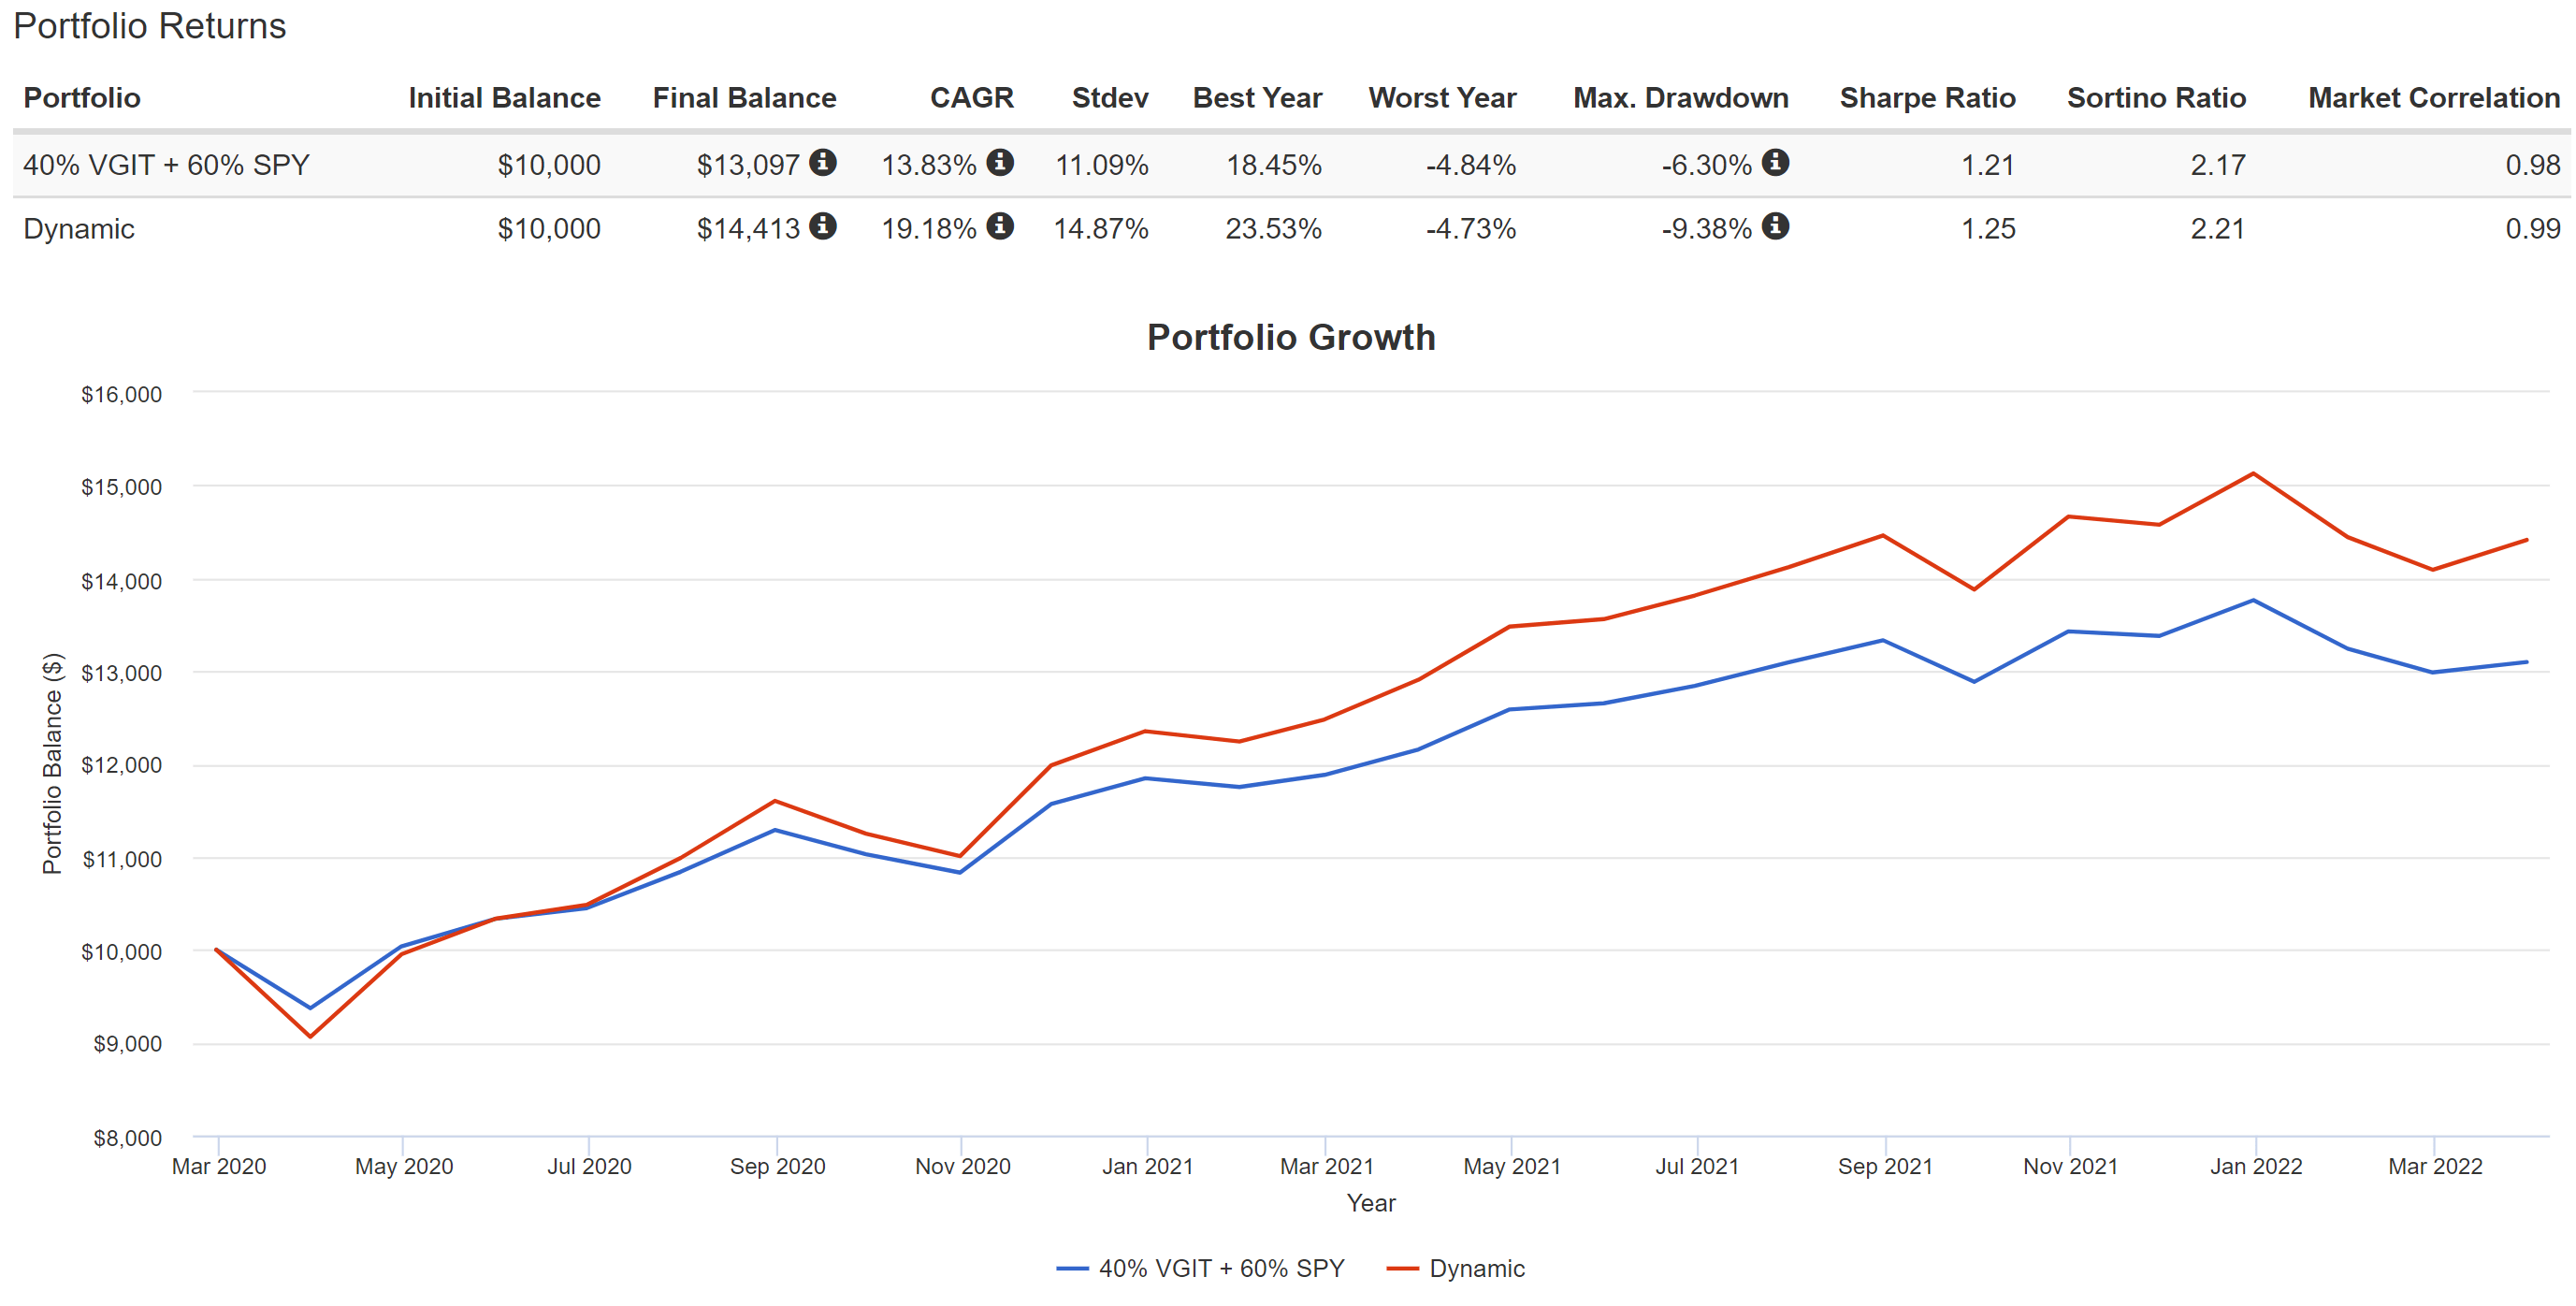
With the above insight, the next chart compares two simple portfolios to illustrate the dynamic allocation between 2020 March and now.
Portfolio 1: the traditional 40-60 portfolio consisting of 40% VGIT + 60% SPY and rebalanced quarterly.
Portfolio 2: a dynamics allocation of VGIT and SPY that started with a 20% VGIT and 80% SPY because of the extremely wide yield spread as mentioned above.
Now as you can see, portfolio 2 (the red line) consistently outperformed the traditional 40-60 strategy till now – where the yield spread has gone to the other extreme and it is time for us to switch the allocation to bet more heavily on bonds.
Source: www.portfoliovisualizer.com
In practice, our allocation method is a bit smarter than the above simple illustration for several reasons.
First, we allocate and balance more regularly and bet more heavily. E.g., we held an even lower allocation of VGIT when the yield spread was at an extremely high level in early 2020.
Second, we do not necessarily follow a quarterly rebalance schedule. Instead, we monitor the yield spread regularly, rebalance more strategically, and also include cash reserve as an asset class in the dynamical allocation. As two recent examples:
In our Nov 22, 2021 article, we cautioned readers that our model showed a record low exposure index (“EI”), a key parameter we use to allocate our cash reserve in all our accounts. We mentioned that now was a good time to decrease both bond and equity and increase cash reserve with both SPY yield and treasury rate at a historical low.
In our Dec 16, 2021 article, we cautioned again it was a good time to move toward maximum cash reserve and be in a hunker-down mode because of the same warning signals from low equity and treasury rates.
Shortly after these allocation changes, both the stock and bond market went through sizable corrections as you can see next.
Third, we do not only hold market funds like SPY as you can see from our model portfolios later. They do not create that much alpha – and it is not their fault. They are designed to give you results that are not too far from the market average. When we see a good signal, we’d rather do the research and choose our individual tactical holdings, which have created more alpha in the past for us.
Source: www.portfoliovisualizer.com
Conclusions, Risks, And Our Actual Holdings
This article explains why we do not do 40-60, and how we use SPY and VGIT dynamically to mitigate risks and boost alpha. In particular, recent bond rate surges pushed equity yield spread to a record low in a decade and created another opportunity for such dynamic allocation.
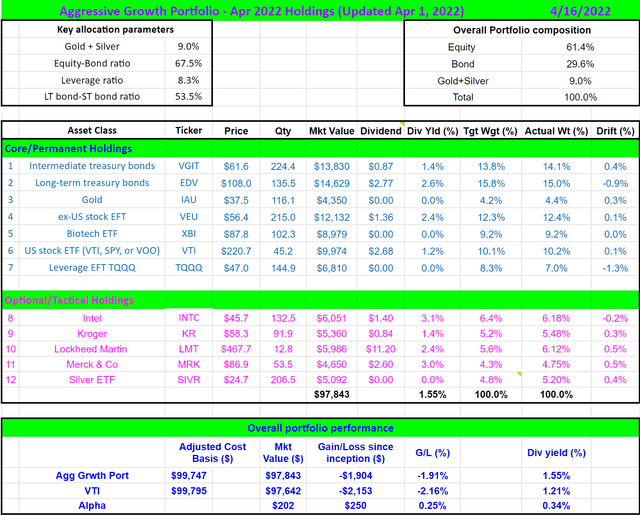
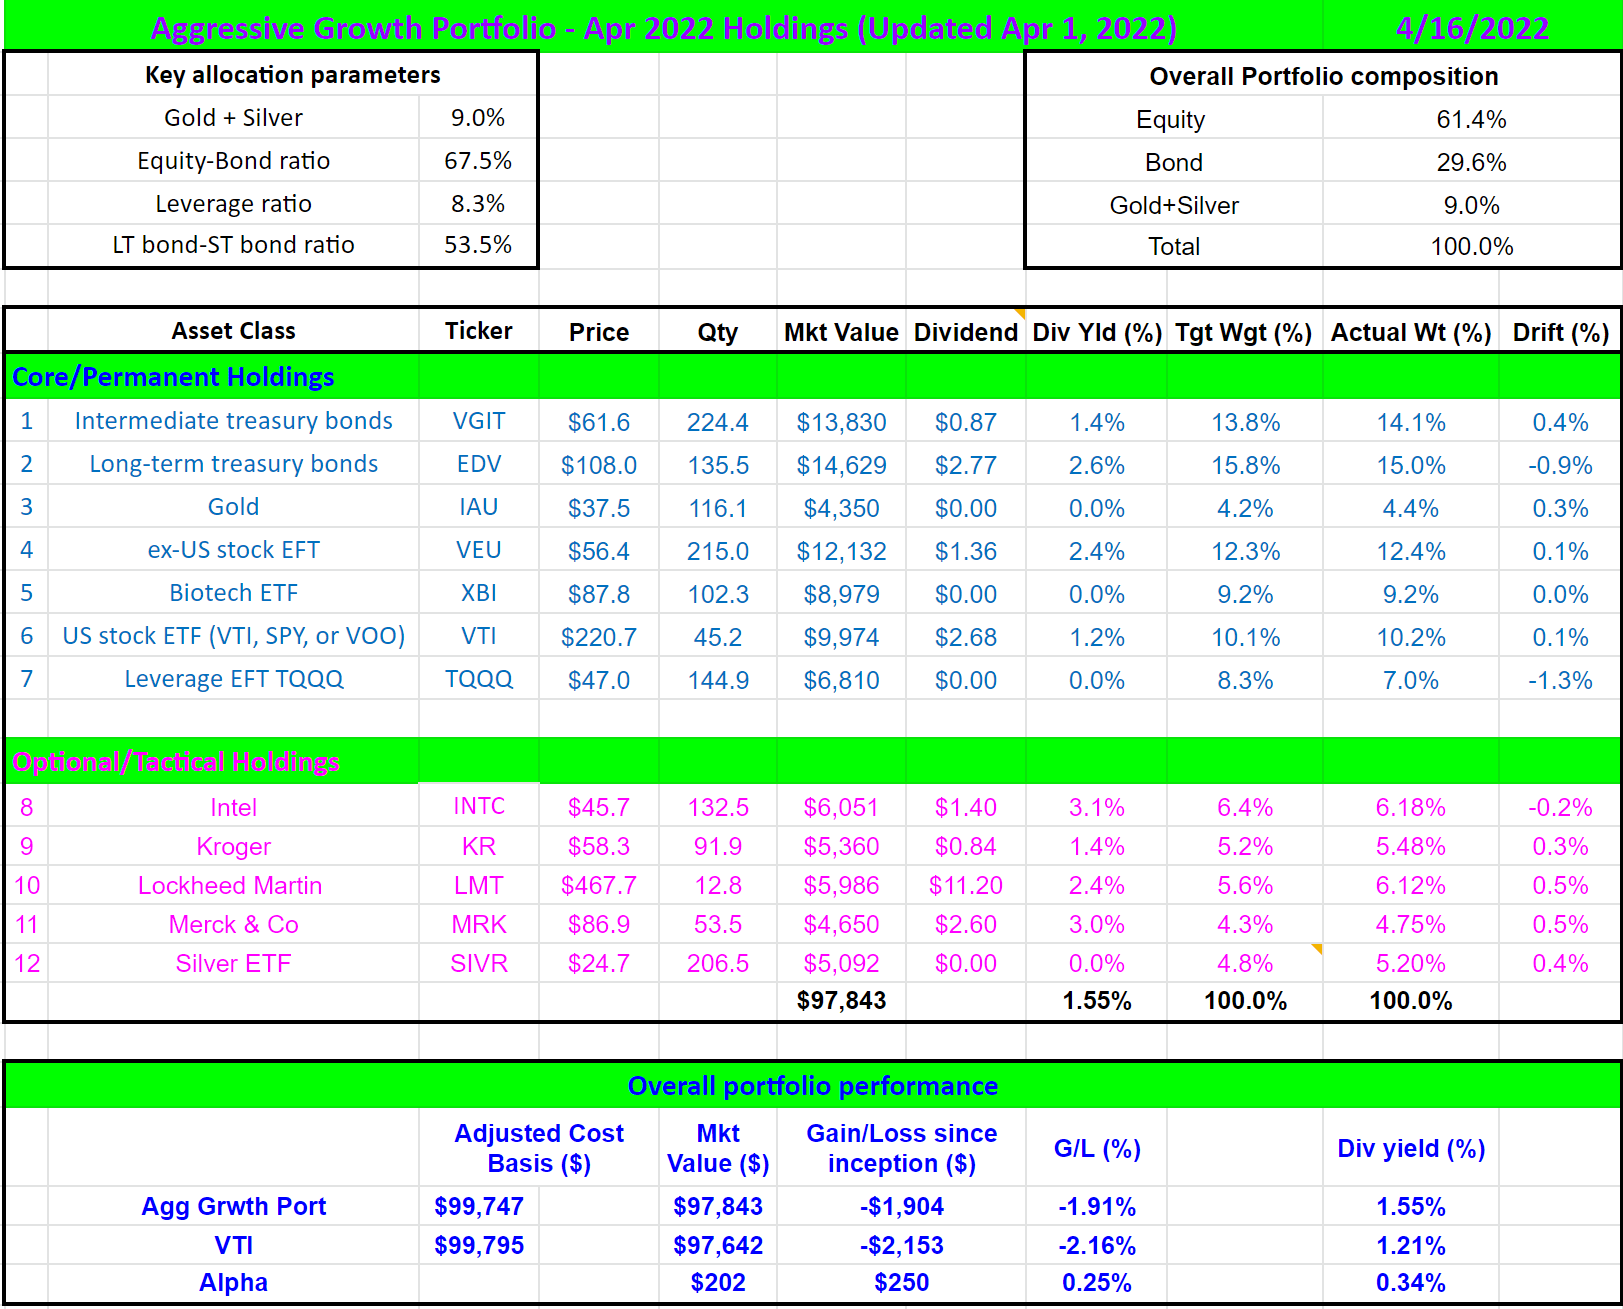
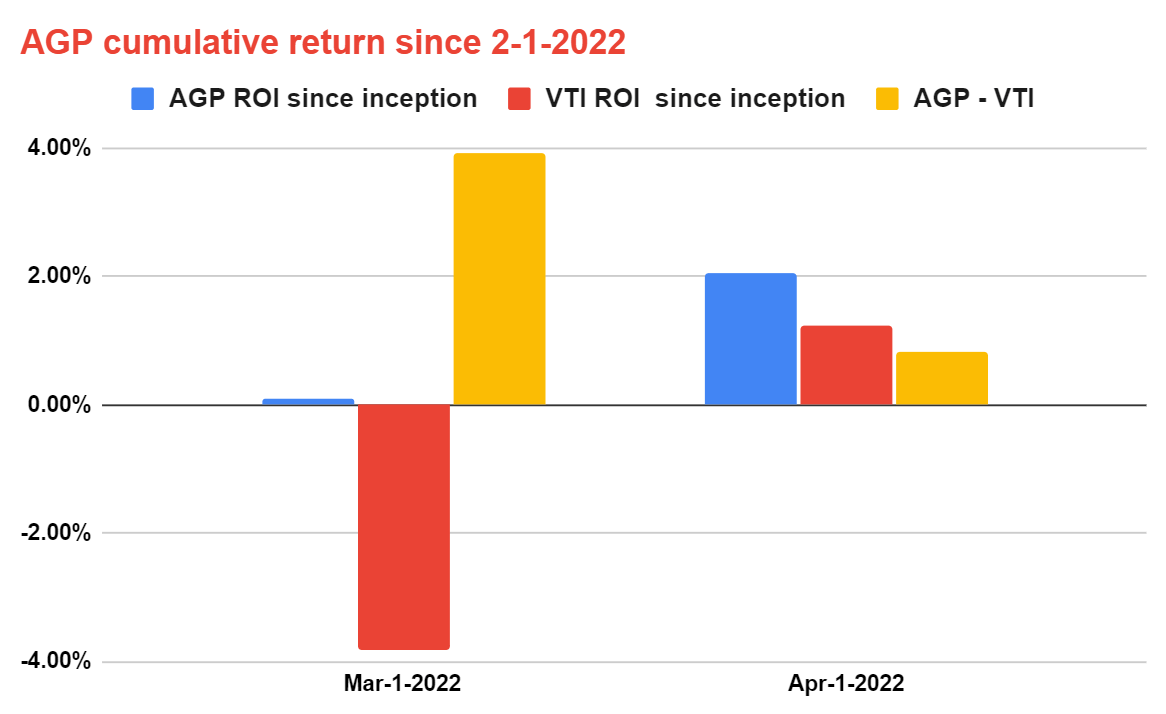
Our actual holdings are shown below (more details of this portfolio are in our blog article if you are interested). The second chart shows the performance of our AGP (aggressive growth portfolio) relative to the overall market since Feb 1, 2022, the date we officially published our AGP with our marketplace service members (longer-term performance is in our blog article). As you can see, our AGP portfolio gained not only outperformed the overall market but also has never lost money on a monthly basis despite all the market turmoil (including a war!)
Finally, we want to also point out the risks of our approach. These risks have been detailed in our other articles and here we will just provide a brief summary:
We do NOT actually use the simple yield spreads in our allocation model ourselves. Dividend yields do not always reflect business fundamentals accurately due to distortion by things irrelevant to business fundamentals, such as A) tax law – dividend can change (has changed) quite a bit depending on whether the tax codes favor it or not, B) Political climate – dividend can also change based on how politically popular it is, and C) Composition of the market index – dividend yield of “the market” can also be biased if the index is dominated by a few mega-caps who do not pay dividends – like what we are experiencing now.
Thus, we adjust for (and you should too) these factors and correct the distortion, especially in the long-term or whenever one of the above factors changes. But again, the simple summation of yields provides a good approximation already and illustrates the essence of the idea.
Finally, our AGP uses leveraged funds such as TQQQ, which entails several risks, including but not limited to risks of a total loss, fee drag, and dividend drag.
Please note that foreign exchange and other leveraged trading involves significant risk of loss. It is not suitable for all investors and you should make sure you understand the risks involved, seeking independent advice if necessary.


Be the first to comment