

Leonid Sukala
Silvergate Capital (NYSE:SI) is a $1.9 billion market cap crypto banking company in the Financials sector. The California-based regional bank is at the heart of recent crypto volatility, but SI also has diversifying activities differentiating it from other pure-crypto plays. Unlike many, once high-flying crypto-related stocks, Silvergate actually makes money and sports a reasonable price-to-earnings ratio of just under 20x as of July 6.
According to Bank of America Global Research, Silvergate Capital provides infrastructure solutions and services to participants (exchanges and global investors) of the digital currency industry. Through its proprietary global payments network, the Silvergate Exchange Network, clients can settle fiat-denominated transactions instantly.
BofA notes that SI’s digital asset deposits are a whopping 93% correlated with the price of Bitcoin. That’s a significant risk. And we can see that in the tight correlation between SI shares and the spot price of Bitcoin over the last year.
SI & Bitcoin: Nearly a Perfect Match
StockCharts.com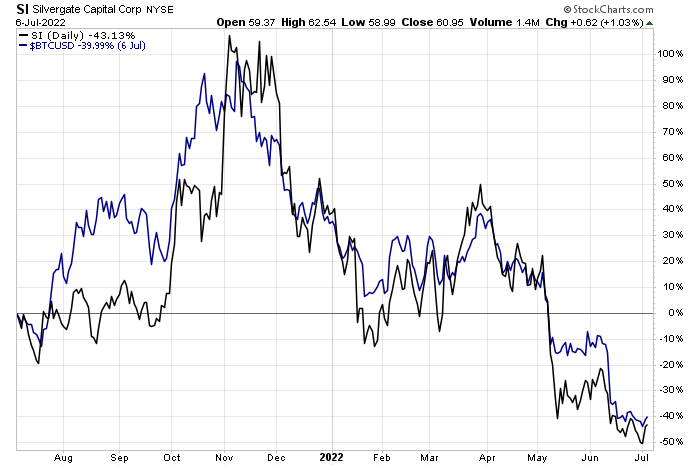
BofA believes the upcoming quarterly earnings report will be particularly pivotal for Silvergate. They see digital currency deposits about stable from the prior quarter – that will be a key metric to watch. Overall, BofA anticipates EPS of $0.82, which is below consensus. Looking ahead, strong profit growth is forecast through next year, but so much of that depends on what happens with the crypto market. Assuming big EPS growth, the stock’s P/E ratio begins to turn quite attractive. The PEG ratio is about 1.0x given that growth rate.
Silvergate’s EPS Forecast & Valuation Outlook
BofA Global Research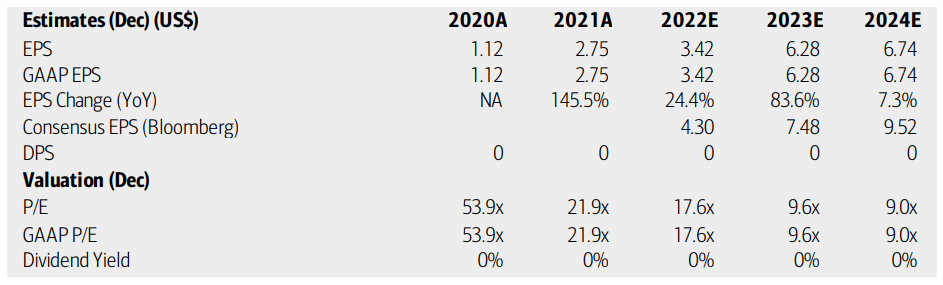
Silvergate reports Q2 results on Tuesday, July 19, BMO, according to Wall Street Horizon. It is among the early reporters this upcoming earnings season. A conference call follows later that morning. The Wall Street Journal shows a Q2 EPS estimate of $0.87, which would be solid growth from $0.80 of earnings in the same quarter a year ago. The stock climbed sharply after it reported first-quarter earnings back on April 19, beating analyst estimates by $0.35, but those gains quickly evaporated.
Corporate Event Calendar: Critical Earnings on July 19 BMO
Wall Street Horizon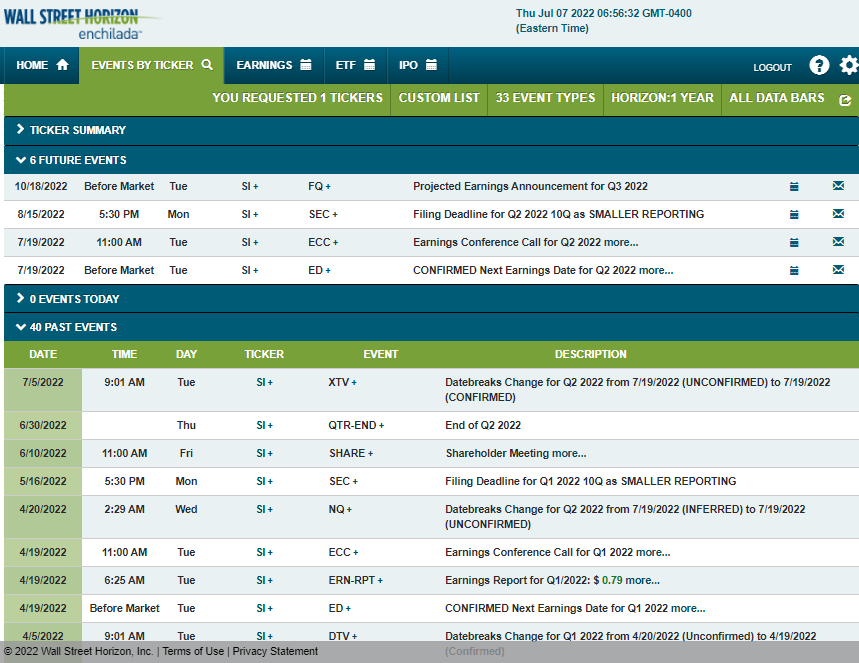
The Technical Take
While the stock looks rather cheap given its earnings growth and a much more down-to-earth valuation these days, we must look at the charts to get a sense of not just price trend, but also overall sentiment and momentum.
A key bearish move happened in May when shares broke below the important $80 to $87 range. Notice in the chart below that the $80s was resistance in early 2021 before surging above it a few weeks later. The stock then defended the $80s many times from 2021 through early this year. Unfortunately, a breakdown finally came two months ago, and a bounce back in June was rejected precisely at the breakdown point.
Next support is near $35 – the December 2020 low, and below that we have to go all the way down to $16-$17. A swing trading idea is to go long shares here and sell near $70 based on a recent price gap. But this is a ‘sell the rips’ chart to me. I would only consider taking a longer-term bullish bet should SI climb back above $90.
SI: A Possible Gap Fill on the Horizon, but Bearish Trends
StockCharts.com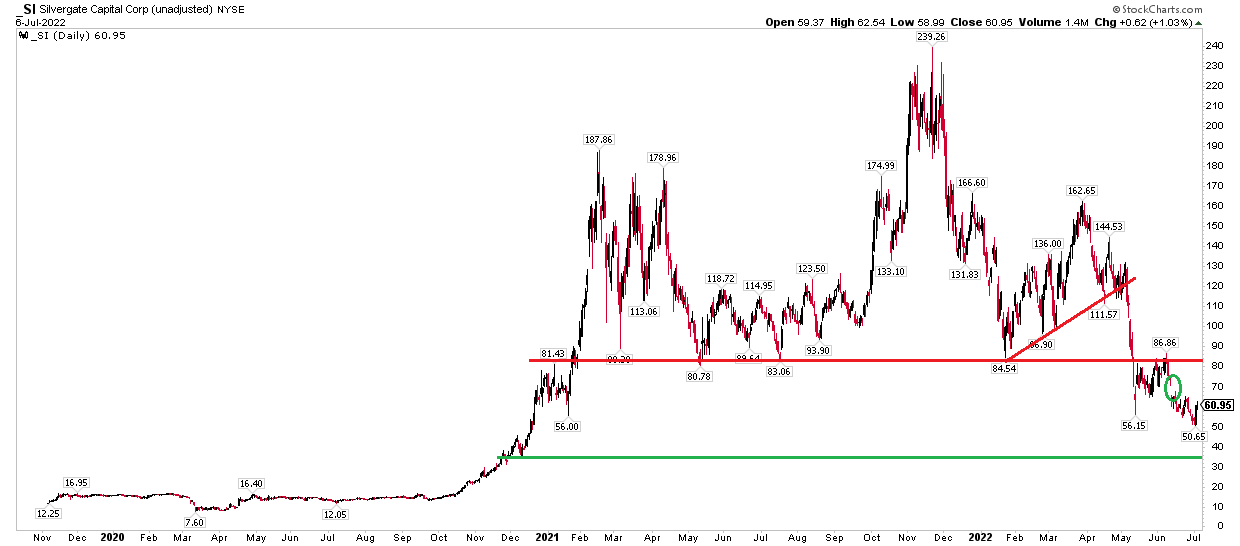
The Bottom Line
Silvergate looks cheap given its EPS growth and a more reasonable valuation, but it’s a broken chart. In this case, the technicals outweigh the intriguing fundamentals. Watch out for volatility ahead of a key earnings report on July 19.
Be the first to comment