

GBP/USD is struggling to clear the 1.3500 resistance zone. EUR/GBP is declining and remains at a risk of more losses below the 0.8380 support.
Important Takeaways for GBP/USD and EUR/GBP
· The British Pound is facing resistance near the 1.3500 and 1.3510 levels.
· There was a break below a key bullish trend line with support near 1.3460 on the hourly chart of GBP/USD.
· EUR/GBP started a fresh decline from well above the 0.8550 pivot level.
· There is a major bearish trend line forming with resistance near 0.8420 on the hourly chart.
GBP/USD Technical Analysis
The British Pound found support near 1.3350 and started a decent recovery the US Dollar. The GBP/USD pair climbed higher above the 1.3400 and 1.3450 levels.
The pair even spiked above the 1.3500 level, but there was no upside continuation. A high is formed near 1.3512 on FXOpen and the pair is now declining. The pair traded below the 1.3480 and 1.3450 support levels to enter a bearish zone.
There was a break below a key bullish trend line with support near 1.3460 on the hourly chart of GBP/USD. The pair declined below the 50% Fib retracement level of the upward move from the 1.3353 swing low to 1.3512 high.
The pair is now trading below the 1.3450 and the 50 hourly simple moving average. On the upside, an initial resistance is near the 1.3450 level.
If there is an upside break above the 1.3450 resistance and the 50 hourly SMA, the price could surpass 1.3480. The main resistance is near the 1.3500 zone. Therefore, a proper break above the 1.3500 resistance could open the doors for a steady increase. The next major resistance for the bulls could be 1.3600.
If not, the pair could extend losses below 1.3425. An immediate support is near the 1.3415 level. It is near the 61.8% Fib retracement level of the upward move from the 1.3353 swing low to 1.3512 high.
The first key support is near the 1.3400 level. Any more losses could lead the pair towards the 1.3350 support zone. The next major support sits near the 1.3250 level.
EUR/GBP Technical Analysis
The Euro started a strong decline after it failed to clear the 0.8550 resistance against the British Pound. The EUR/GBP pair traded below the 0.8500 support to move into a bearish zone.
There was a break below the 0.8450 level and the 50 hourly simple moving average. The pair even traded below the 0.8400 support. A low is formed near 0.8382 and the pair is now consolidating losses.
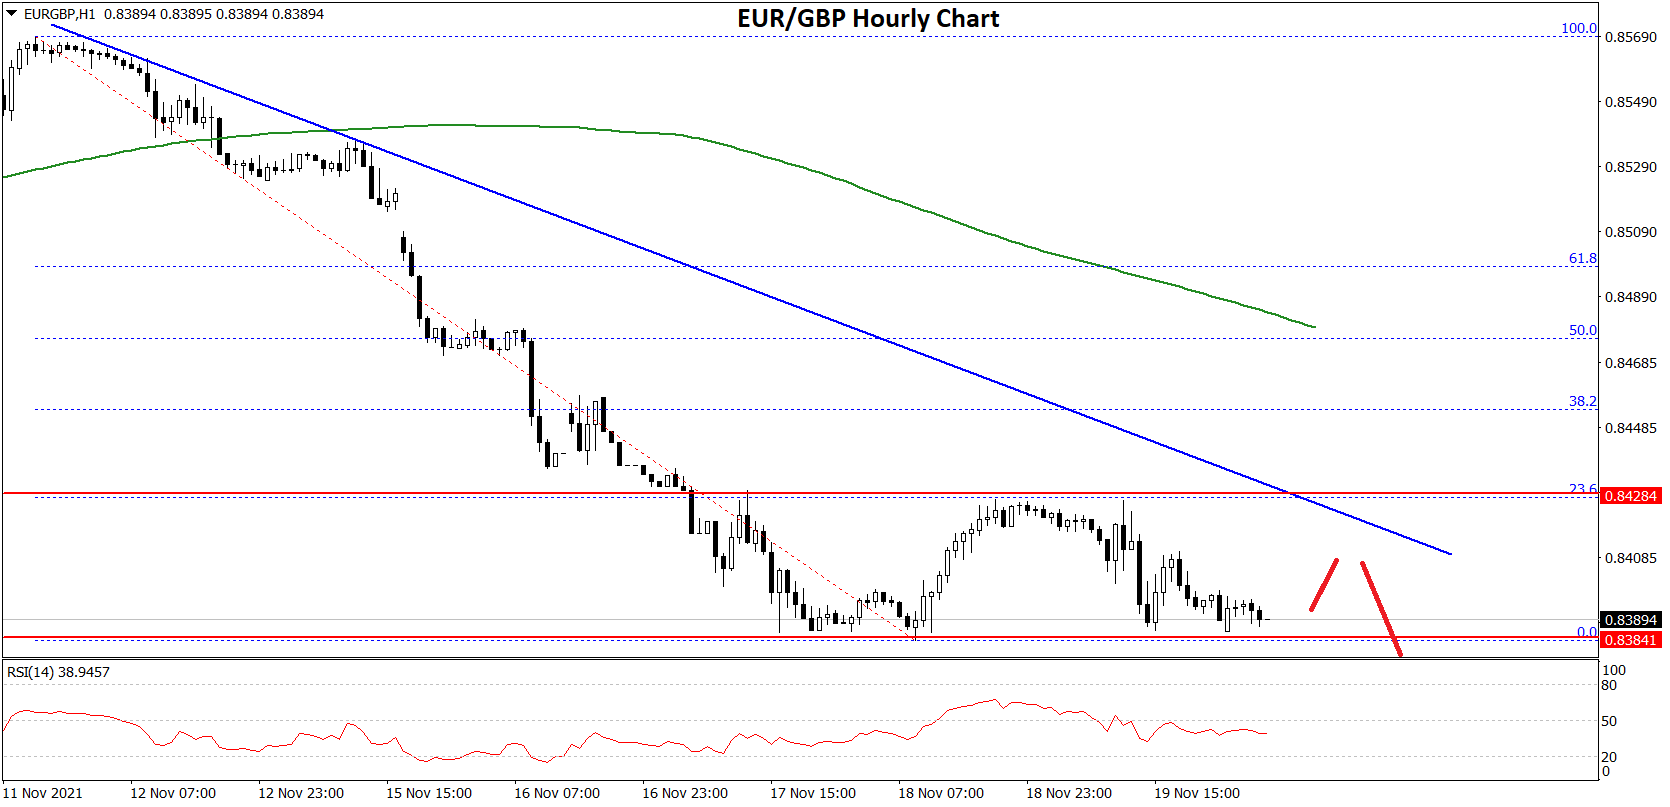
An immediate resistance is near the 0.8425 level. It is close to the 23.6% Fib retracement level of the downward move from the 0.8568 high to 0.8382 low. There is also a major bearish trend line forming with resistance near 0.8420 on the hourly chart.
The main resistance is near the 0.8480 zone. It is near the 50% Fib retracement level of the downward move from the 0.8568 high to 0.8382 low, above which pair could rise steadily.
An initial support on the downside is near the 0.8385 level. The next major support is near 0.8350 level. A downside break below the 0.8350 and 0.8355 support levels might call for more downsides. In the stated case, the pair could decline towards the 0.8300 support level in the near term.
This forecast represents FXOpen Markets Limited opinion only, it should not be construed as an offer, invitation or recommendation in respect to FXOpen Markets Limited products and services or as financial advice.

Be the first to comment