

JuSun
Produced with Avi Gilburt and Ryan Wilday
This article will delve into a high-quality technical setup that’s developing in Silvergate Capital Corp. (NYSE:NYSE:SI).
Silvergate Capital provides solutions for lending, payments, and funding to a growing array of companies in the digital currency space. They also offer financial services such as commercial banking and commercial business lending.
So, while Silvergate has risen and fallen in sympathy with the crypto market as it’s deep in the digital currency service space, its destiny is not entirely tied to movements in Bitcoin.
That said, regarding Bitcoin, though the path forecasted in the various “Moonpath” articles published over the past several months has clearly been incorrect, our expectations are still quite bullish over the next 1-3 years. We still see BTC going substantially higher and rewarding investors with longer time horizons.
Though not exciting in and of itself, SI is down roughly 38% year-to-date as of writing this article, whereas BTC is down approximately 58%. From the 2022 low, which was struck in July, SI is up over 82% as compared to BTC, which is up about 10% from its June low.
Please see the charts below as visual aid for the technical analysis:
SI Daily Chart (Jason Appel (Crypto Waves))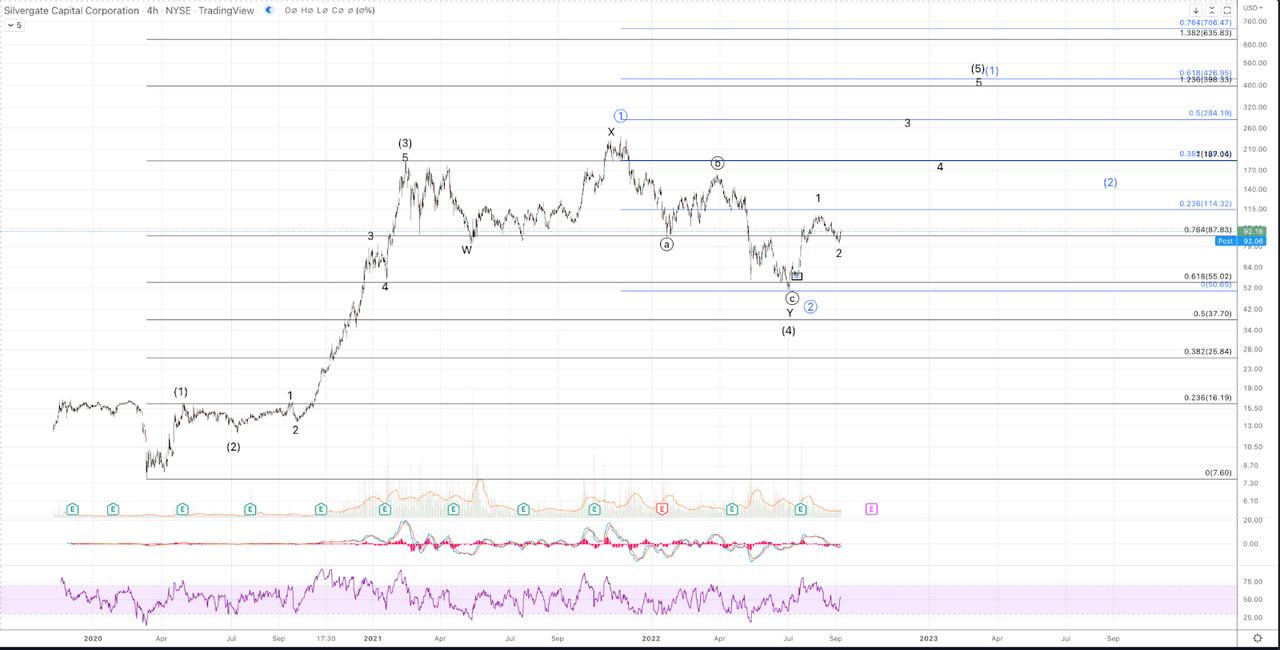
First, starting with the daily chart. Our larger degree perspective is that SI has rallied impulsively off the 2020 low. The November high can count as a wave (5), thereby completing a full 5 waves up as shown in blue. However, inside of an impulse, waves (1), (3), and (5) should all be 5 wave moves, and while the rally from the May 2021 low into November exceeded the February high, it did not do so as a clear 5 waves. As such, we are open to the possibility that the recent low has completed a wave (4) of the initial (expected) 5 waves up from the 2020 low; or that the recent low constitutes Primary wave 2 of a much bigger degree 5 up in formation. Given a clearly corrective move from the high (whether that’s counted from February or November 2021) into the July 2022 low, and now an impulsive rally from that low, expectations are for substantially higher levels to come in both cases: whether as wave (5) in black or wave (1) of circle 3 in blue.
SI micro chart (Jason Appel (Crypto Waves))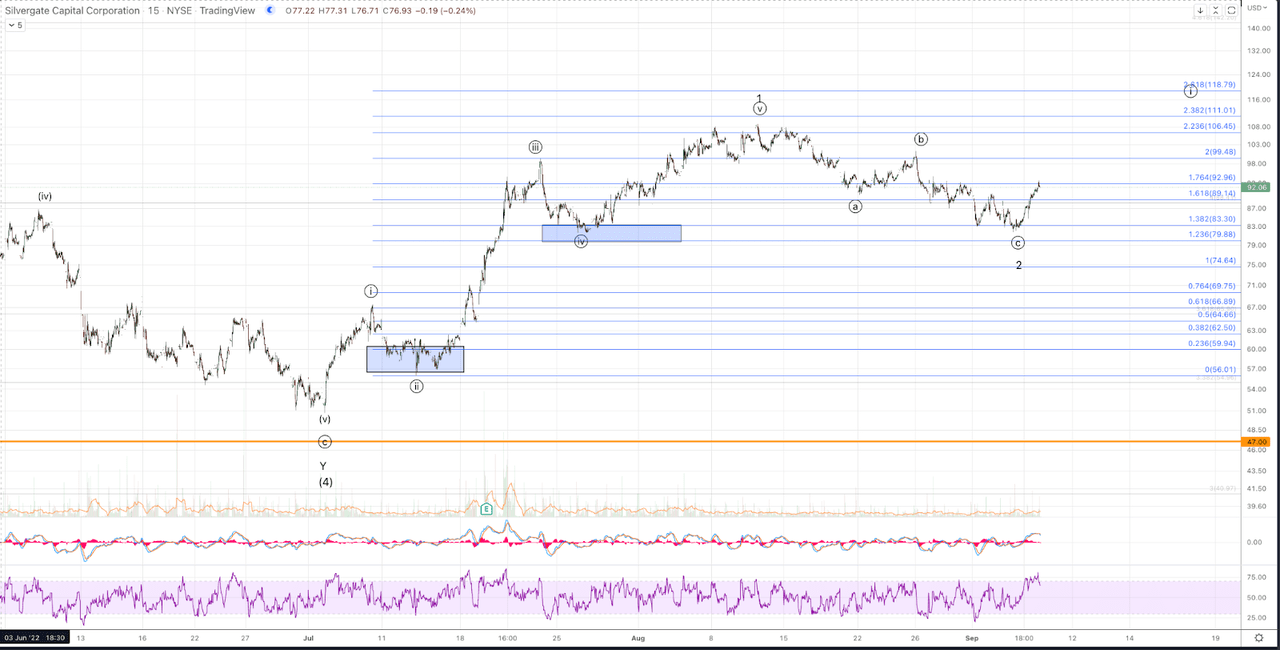
Next, let us observe the micro chart (above) showing a detailed display of the wave structure since the July 2022 low. In this case, we have a clear 5 wave structure with appropriate proportions in length among the waves and each of the motive subwaves, i, iii, and v are all smaller degree fractal impulses. In our Fibonacci Pinball methodology, after an initial 5 waves up, in this case wave i, expectations are for a corrective pullback that only retraces a portion of the initial advance. Following the initiation move and first pullback, i.e., the i-ii, an impulse then follows with a 5 wave move which should ideally exceed the 1.382 extension of the initial wave i. That is our wave iii, and in this case, SI nearly reached the 2.0 extension of wave i for the wave iii.
Following the completion of wave iii, price is expected to retrace a small portion of the wave iii advance and should ideally maintain well above the wave i high. SI did exactly that, pulling back into support for wave iv in late July. From there, the completion of the impulse depends on price forming another micro 5 wave rally, exceeding the wave iii high and ideally, doing so just by a few Fibonacci extensions before topping. As you can see, SI very nicely followed this structure for all 5 waves composing the wave 1.
The significance of the 5 wave move is that, in Elliott Wave, we have observed that these impulse movements tend to imply that following a partial correction, price will continue in the direction of the trend.
Lastly, let us examine the one-hour chart:
SI 1hr chart (Jason Appel (Crypto Waves))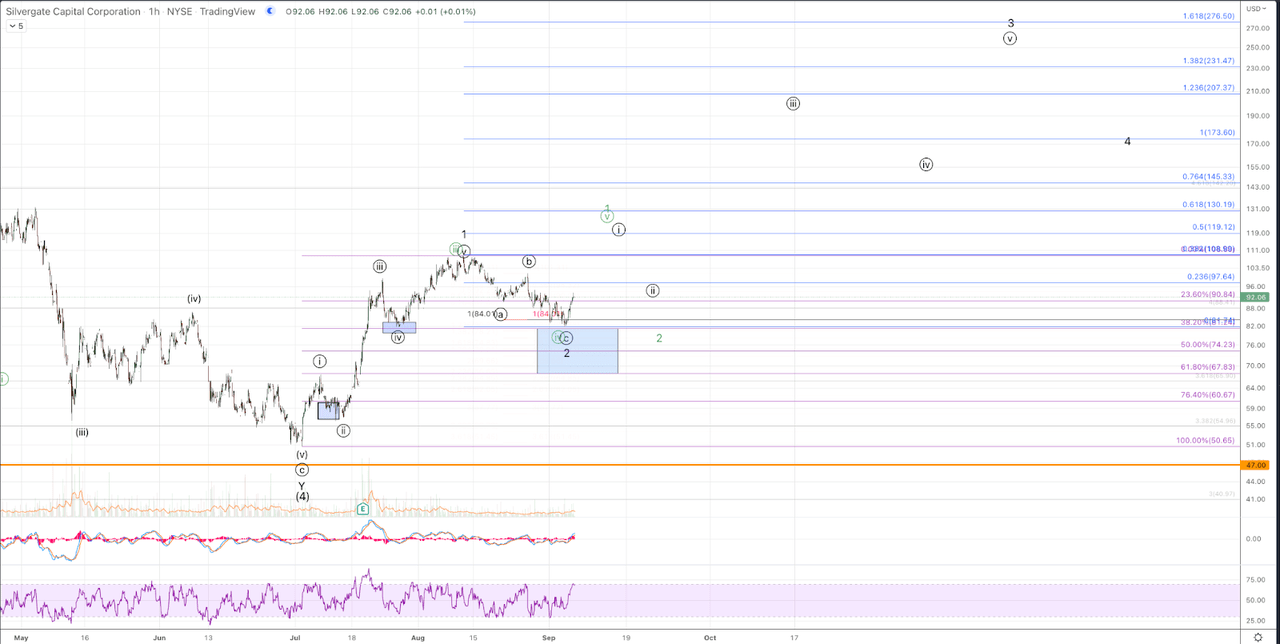
SI has a clear 3 wave move down from the August high into this week’s low, right into the standard retrace support region, noted by the blue box on the chart. Furthermore, the rally from this week’s low has surpassed the initial resistance, suggesting that a potential bottom has been struck in wave 2. Should price head south and form a lower low, please note that standard expectations for continuation higher dictate that the .618 retrace should ideally hold. That is at the $67.83 level. As such, we consider support to range all the way down to roughly $67 in the event that this week’s low is breached. Should $67 break, while it does not constitute an invalidation of the larger setup presented, it would cast greater doubt on the prospect of upside follow through.
So long as this week’s low is not broken, expectations are that a much larger move up has started targeting $200+ just for the wave 3. The initial wave circle i is expected to minimally target the August high but reaching $120+ would be preferable. Our alternative hypothesis is that price is headed up to $120 to complete a bigger 5 wave move from the July low. This path is also quite bullish and ultimately portends much higher targets to come, but it could mean that a larger and deeper wave 2 pullback is needed first before liftoff, as shown in the chart.
In summary, we see SI as a very attractive setup from current levels. Initial targets are in the $110-$120 region and intermediate targets over the next 9-18 months are in the $200+ region
Be the first to comment